COVID-19 Science Update released: July 2, 2021 Edition 96

The COVID-19 Science Update summarizes new and emerging scientific data for public health professionals to meet the challenges of this fast-moving pandemic. Weekly, staff from the CDC COVID-19 Response and the CDC Library systematically review literature in the WHO COVID-19 databaseexternal icon, and select publications and preprints for public health priority topics in the CDC Science Agenda for COVID-19 and CDC COVID-19 Response Health Equity Strategy.
Section headings in the COVID-19 Science Update align with the CDC Science Agenda for COVID-19.
Section headings in the COVID-19 Science Update have been changed to align
with the CDC Science Agenda for COVID-19.
Here you can find all previous COVID-19 Science Updates.
PEER-REVIEWED
Trends in the distribution of COVID-19 deaths by age and race/ethnicity — United States, April 4–December 26, 2020external icon. Rossen et al. Annals of Epidemiology (June 20, 2021).
Key findings:
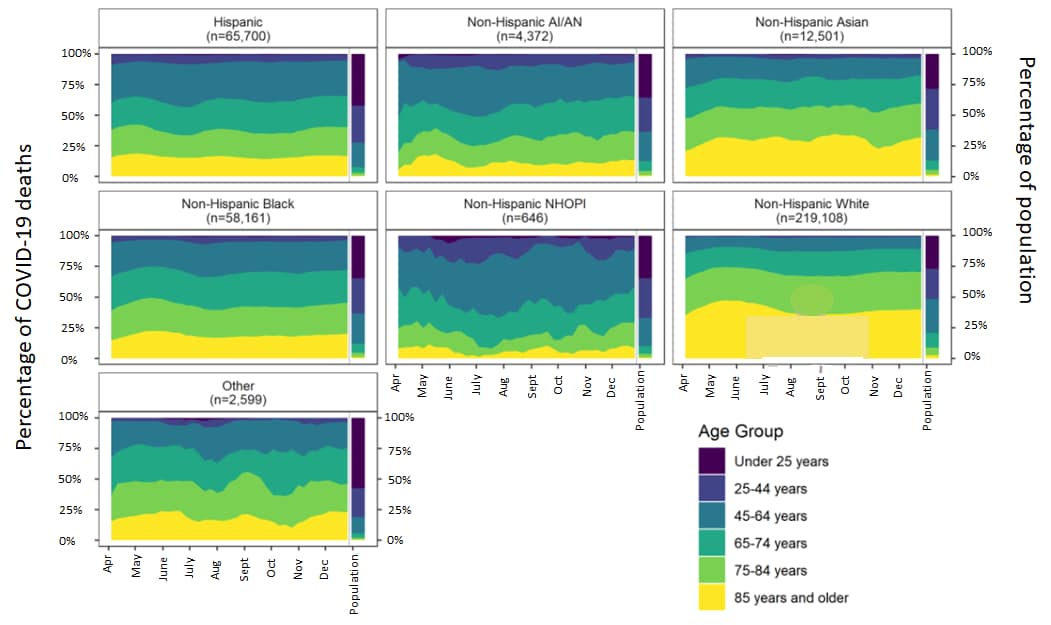
- The largest percentage of COVID-19 deaths from April through October occurred in older persons aged ≥ 85 years among both the non-Hispanic White and non-Hispanic Asian populations (Figure).
- Compared with the White population, the age distributions of COVID-19 deaths among non-Hispanic NHOPI and other racial/ethnic groups, were younger (Figure).
- The percentage of COVID-19 deaths declined in all age groups 25 and older for non-Hispanic Black persons since April and, since late July, for Hispanic persons.
Methods: Using data from the National Vital Statistics System, the percentage distribution of 363,087 US COVID-19 deaths from April 4 through December 26, 2020 was calculated by age group (<25, 25–44, 45–64, 65–74, 75–84, and ≥85 years) within race/ethnicity groups (Hispanic, non-Hispanic White, non-Hispanic Black, non-Hispanic Asian, non-Hispanic AI/AN, non-Hispanic Native Hawaiian or other Pacific Islander [NHOPI], other). Limitations: COVID-19 deaths may be underestimated by race/ethnicity due to differential reporting on death certifications; small number of deaths in some race/ethnic groups.
Implications: Prevention efforts need to focus on highly impacted older age groups and also on Hispanic/Latino, non-Hispanic Black, non-Hispanic AI/AN, and non-Hispanic NHOPI populations, where a majority of COVID-19 deaths were among persons aged <75 years.
Figure:
Note: Adapted from Rossen et al. April 4–December 26, 2020 weekly percentage distribution of COVID-19 deaths using a 4-week rolling sum of COVID-19 deaths shown for age groups by race/ethnicity. The right side of each figure shows the age distribution in the population (2019 Census). Abbreviations: NHOPI = Native Hawaiian or other Pacific Islander; AI/AN = American Indian or Alaska Native. Reprinted from Annals of Epidemiology, online June 20, 2021, Rossen et al., Trends in the distribution of COVID-19 deaths by age and race/ethnicity — United States, April 4–December 26, 2020. Copyright 2021, with permission from Elsevier.
Association of the COVID-19 pandemic with estimated life expectancy by race/ethnicity in the United States, 2020external icon. Andrasfay et al. JAMA Network Open (June 24, 2021).
Key findings:
- Updated life expectancy estimates show that COVID-19 reduced overall US life expectancy from 78.74 to 77.43 years (Figure).
- Compared with the White population (0.94 years), reductions were 3.2 times larger for the Latino population (3.03 years) and 2 times larger for the Black population (1.90 years) (Figure).
Methods: Cross-sectional study using 380,868 COVID-19 deaths in 2020 to estimate changes in life expectancy associated with COVID-19 for the total US population, non-Latino White, non-Latino Black, and Latino populations. Limitations: COVID-19 deaths may be underestimated by race/ethnicity due to differential reporting on death certificates.
Implications: Disproportionate declines in life expectancy among Latino and Black populations may stem from social and economic inequities that are associated with higher exposure to infection, poorer care once infected and thus higher fatality among those infected.
Figure:
Note: Adapted from Andrasfay et al. Updated estimates of 2020 US life expectancy at birth by race and ethnicity. Estimates for 2020 life expectancy were calculated using COVID-19 deaths reported to the National Center for Health Statistics. The absent COVID-19 scenario is assumed to be the mortality conditions of 2018. Licensed under CC BY.
PEER-REVIEWED
Three doses of an mRNA COVID-19 vaccine in solid-organ transplant recipientsexternal icon. Kamar et al. NEJM (June 23, 2021).
Key findings:
- Among solid-organ transplant recipients, the prevalence of anti-SARS-CoV-2 antibodies was:
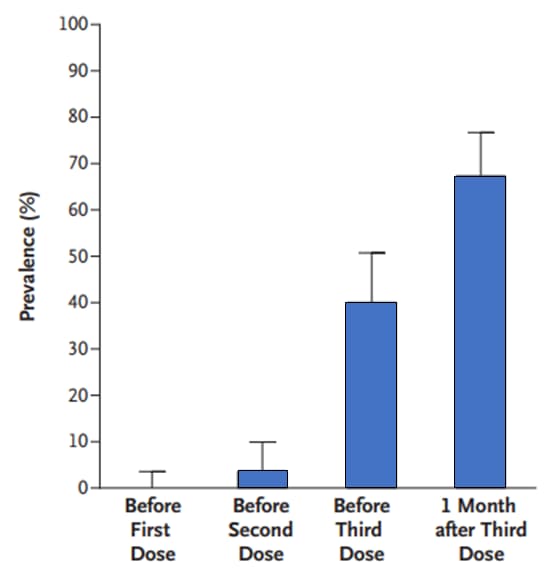
- 0% (95% CI 0 to 4) of 101 patients before the 1st dose of BNT162b2 (Pfizer/BioNTech) (Figure).
- 4% (95% CI 1 to 10) of 101 patients before the 2nd dose (Figure).
- 40% (95% CI 31 to 51) of 99 patients before the 3rd dose (Figure).
- 68% (95% CI 58 to 77) of 99 patients 4 weeks after the 3rd dose (Figure).
- No serious adverse events were reported after the 3rd dose, and no acute rejection episodes occurred.
Methods: In an anonymous retrospective study of solid-organ transplant recipients in France, 99 patients received a 3rd dose of BNT162b2 vaccine 61±1 days after the 2nd dose. Prevalence of anti-SARS-CoV-2 antibodies was assessed before the 3rd dose and 1 month afterward. Any adverse events, including rejection episodes, were recorded. Limitations: Small sample size, unknown how antibody response correlates with protection from infection.
Implications: Immunogenicity to BNT162b2 is reduced among solid-organ transplant patients but increases with additional doses. Transplant recipients and their close contacts should be vaccinated against COVID-19, and transplant recipients should continue to take precautions (masking, distancing, avoiding crowds and poorly ventilated indoor spaces) to protect themselves against COVID-19, even after vaccination.
Figure:
Note: Adapted from Kamar et al. Prevalence of anti-SARS-CoV-2 antibodies before and after respective doses of BNT162b2 vaccination. From the New England Journal of Medicine, Kamar et al., Three doses of an mRNA COVID-19 vaccine in solid-organ transplant recipients. June 23, 2021, online ahead of print. Copyright © 2021 Massachusetts Medical Society. Reprinted with permission from Massachusetts Medical Society.
PEER-REVIEWED
Immunogenicity and reactogenicity of BNT162b2 booster in ChAdOx1-S-primed participants (CombiVacS): a multicentre, open-label, randomised, controlled, phase 2 trialexternal icon. Borobia et al. The Lancet (June 25, 2021).
Key findings:
- By day 14 post-heterologous COVID-19 vaccination:
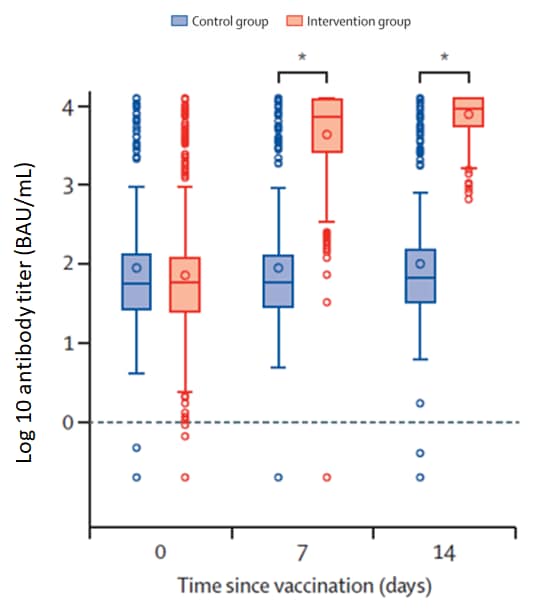
- SARS-CoV-2 receptor binding domain antibodies (anti-RBD) titers increased from 71.46 BAU/mL to 7,756.68 BAU/mL.
- Trimeric spike protein antibody titers increased from 98.40 BAU/mL to 3,684.87 BAU/mL.
- Neutralizing antibody capacity was high (NT50>1:300 and <1:1,000) or very high (NT50>1:1,000).
- All humoral immune responses were significantly higher than those of the controls (p<0·0001) (Figure).
- No serious adverse events were reported.
Methods: Phase 2, open-label, randomized, controlled trial conducted in 5 Spanish hospitals. Adults aged 18–60 years who received a prime ChAdOx1 (AstraZeneca/Oxford) dose 8–12 weeks prior to enrollment were randomly assigned (2:1) to receive either a single dose of BNT162b2 (Pfizer/BioNTech, n = 441) or no vaccine (control group, n = 222). Immune response and antibody neutralization capacity (n = 198) were determined up to 14 days after BNT162b2 dose. 7-day reactogenicity was also determined. Limitations: No control group completing the homologous ChAdOx1 regimen.
Implications: The use of an mRNA vaccine as a 2nd dose in a heterologous scheme may increase the immune response obtained after an initial dose of ChAdOx1, without serious adverse events.
Figure:
Note: Adapted from Borobia et al. Receptor-binding domain (anti-spike protein) antibody titers among the intervention group and control group on days 0, 7, and 14. Horizontal lines in boxes represent medians; open circles represent outliers; *p<0.0001. Reprinted from The Lancet, online June 25, 2021, Borobia et al., Immunogenicity and reactogenicity of BNT162b2 booster in ChAdOx1-S-primed participants (CombiVacS): A multicentre, open-label, randomised, controlled, phase 2 trial. Copyright 2021, with permission from Elsevier.
PREPRINTS (NOT PEER-REVIEWED)
Comparative immunogenicity of BNT162b2 mRNA vaccine with natural COVID-19 infectionexternal icon. Psichogiou et al. medRxiv (June 21, 2021). Published in Vaccines as Comparative immunogenicity of BNT162b2 mRNA vaccine with natural SARS-CoV-2 infectionexternal icon (September 13, 2021).
Key findings:
- Compared to vaccinated healthcare workers (HCW), antibody levels to the SARS-CoV-2 receptor binding domain (anti-RBD) were lower among unvaccinated individuals with natural infection.
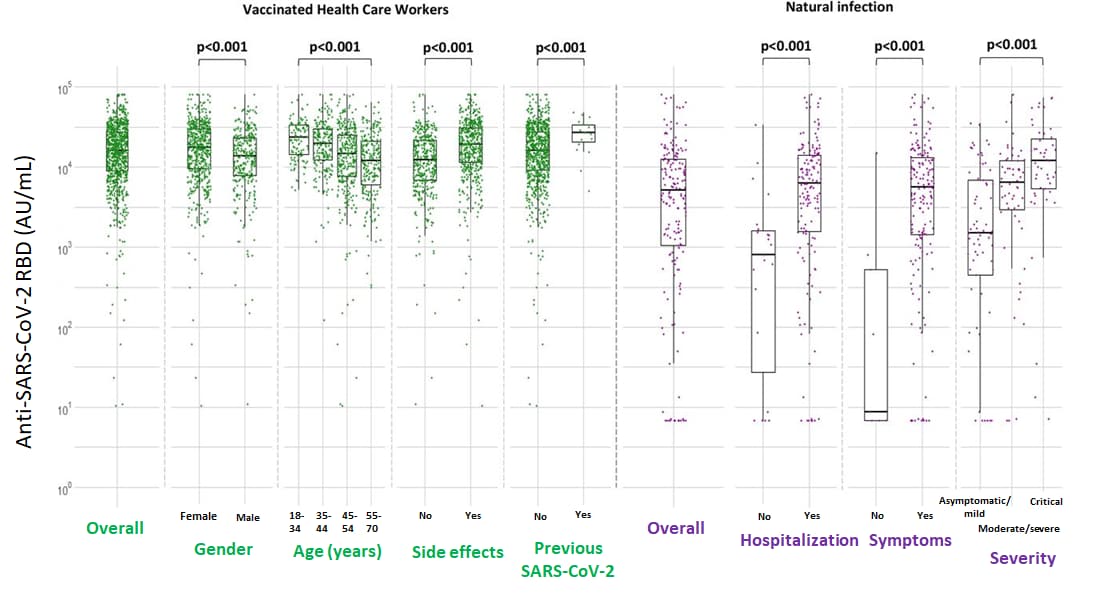
- Among vaccinated HCWs, median anti-RBD levels were 15,877 AU/mL overall.
- Among individuals with natural infection, antibody levels increased with increasing disease severity, with median anti-RBD levels of 9 AU/mL (asymptomatic), 1,634 (mild), 6,082 (moderate), 6,638 (severe), and 11,975 (critical) (Figure).
Methods: In a study in Greece, humoral immune responses were determined in 871 healthcare workers vaccinated with 2 doses of BNT162b2 and compared with those of 181 persons naturally infected with SARS-CoV-2. Immune response was determined 1–2 weeks after complete vaccination or 15–59 days post-symptom onset in persons with COVID-19. Limitations: Cellular immune responses were not evaluated.
Implications: Vaccination with 2 doses of BNT162b2 induces humoral immune responses similar to those of patients critically ill with COVID-19 and greater than those of patients with less severe illness or who are asymptomatic.
Figure:
Note: Adapted from Psichogiou et al. Logarithmic scale of median concentrations of anti-SARS-CoV-2 RBD (AU/ml) among vaccinated healthcare workers 7–15 days after the 2nd dose of BNT162b2 and among individuals with natural infection. Permission request in process.
Detection, Burden, and Impact
- Saatci et al. Association between race and COVID-19 outcomes among 2.6 million children in Englandexternal icon. JAMA Pediatrics (June 21, 2021). Among 26,322 children testing positive for SARS-CoV-2 between January 24 and November 30, 2020, 343 were admitted to hospital and 73 required intensive care. Compared with White children, Asian children were more likely to be admitted to hospital (aOR, 1.62; 95% CI 1.12-2.36) and intensive care (aOR, 2.11; 95% CI 1.07-4.14). Black children (aOR, 2.31; 95% CI 1.08-4.94) and mixed/other race children (aOR, 2.14; 95% CI 1.25-3.65) had longer hospital stays (≥36 h). An editorialexternal icon emphasized that race likely impacts health through racism and race-associated experiences, opportunities, and access.
- Lepak et al. Association of changes in seasonal respiratory virus activity and ambulatory antibiotic prescriptions with the COVID-19 pandemicexternal icon. JAMA Internal Medicine (June 21, 2021). Based on data from the Wisconsin Health System during the pre-COVID-19 period and the COVID-19 period, monthly antibiotic prescriptions for respiratory tract infections fell 79% from 10.5 to 2.2 prescriptions per 1,000 patient encounters.
Note: Adapted from Lepak et al. Antibiotic prescriptions normalized by number of patient encounters. Ambulatory antibiotic prescribing rates for all indications, non-respiratory tract infection (RTI) indications (e.g. urinary tract infection), and RTI indications. Circles are pre-pandemic period, and triangles and blue background are COVID-19 pandemic period. The dotted line denotes the onset of the COVID-19 pandemic. Reproduced with permission from JAMA Internal Medicine, 2021. Published online June 21, 2021. https://doi.org/10.1001/jamainternmed.2021.2621. Copyright© 2021 American Medical Association. All rights reserved.
Transmission of SARS-CoV-2
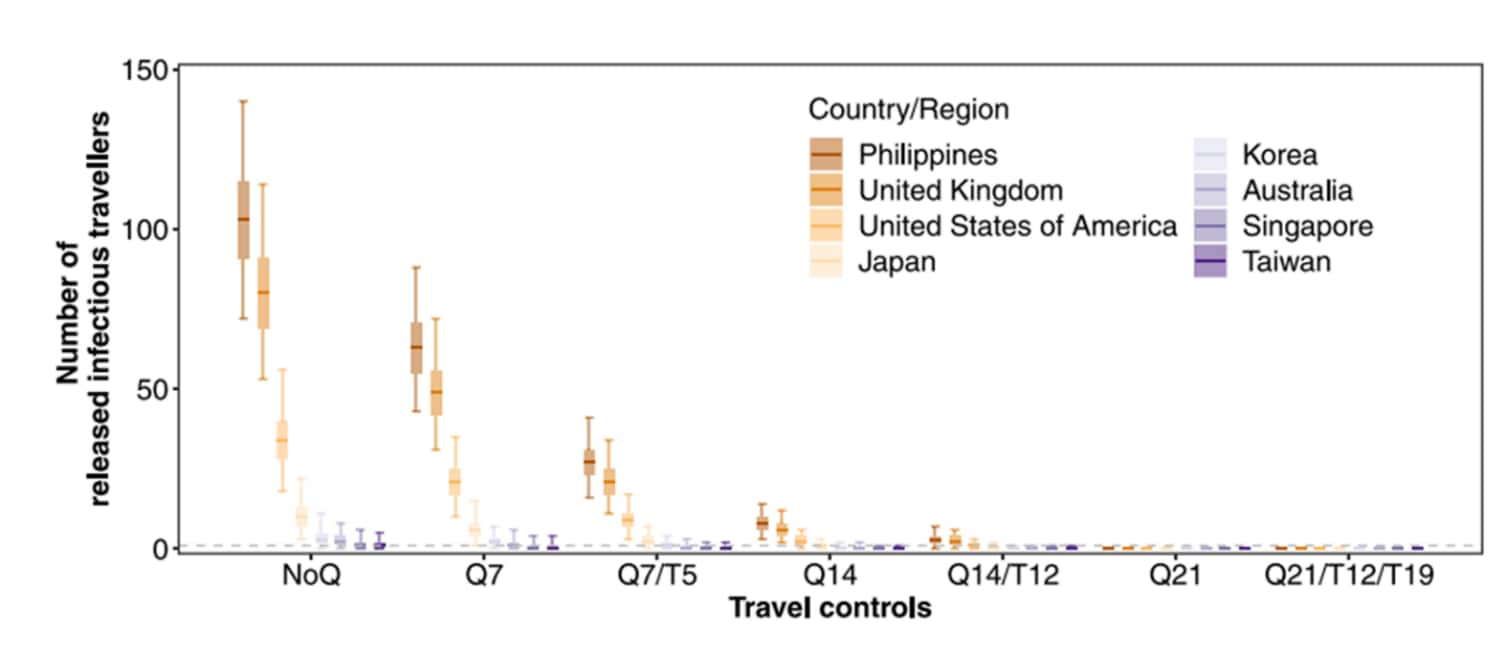
- Yang et al. The differential importation risks of COVID-19 from inbound travelers and the feasibility of targeted travel controls: A case study in Hong Kongexternal icon. The Lancet Regional Health – Western Pacific (June 20, 2021). Based on data from passengers arriving in Hong Kong from 8 locations between April 1 and July 31, 2020, the Philippines, with strict quarantine and testing controls, was predicted to have the greatest importation risk (95.8% of ≥1 infectious traveler, 95% CrI 94.8-96.6%), higher than from low prevalence locations and fewer controls (e.g. Taiwan, 23.4%, 95% CrI 21.6-25.3%).
Note: Adapted from Yang et al. Predicted number of infected travelers. Controls: NoQ (immediate release), Q7 (release after 7-day quarantine without secondary test), Q7/T5 (release after 7-day quarantine with negative test on day 5), Q14 (release after 14-day quarantine without secondary test), Q14/T12* (release after 14-day quarantine with negative test on day 12), Q21 (release after 21-day quarantine without secondary test), and Q21/T12/T19 (release after 21-day quarantine with 2 negative tests on days 12 and 19). Median: thick horizontal bars; interquartile: shaded rectangles; 95% quantiles: solid vertical lines of 2,000 simulations. *Q14/T12 was the regime in force in Hong Kong during study period. Countries with high prevalence; countries with low prevalence. Licensed under CC-BY-NC-ND.
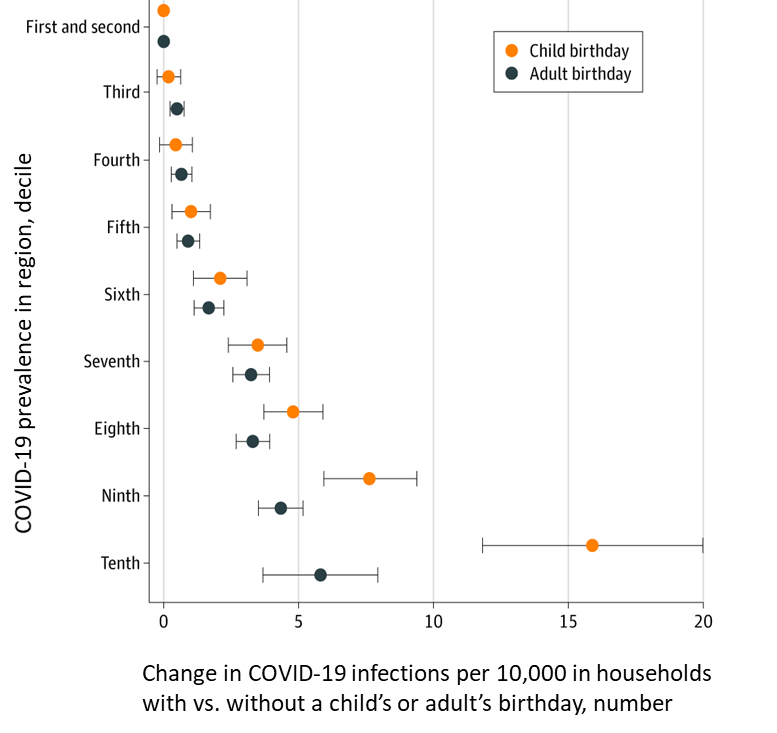
- Whaley et al. Assessing the association between social gatherings and COVID-19 risk using birthdaysexternal icon. JAMA Internal Medicine (June 21, 2021). Among 2.9 million US households, COVID-19 diagnoses among households in counties in the 10th decile of COVID-19 prevalence were 15.8 per 10,000 persons (95% CI 11.7-19.9) higher than among households in counties in the 1st and 2nd deciles after a child birthday, compared with 5.8 per 10,000 persons (95% CI 3.7-7.9) higher after an adult birthday.
Note: Adapted from Whaley et al. Adjusted difference in COVID-19 rates per 10,000 individuals between households in which at least 1 child vs. adult member had a birthday in a given week compared with households in which no member had a birthday, January 1–November 8, 2020. Households in counties in the 1st and 2nd decile of COVID-19 prevalence were the reference. Deciles were calculated based on COVID-19 prevalence for each county-week in 2020. Error bars indicate 95% CIs. Reproduced with permission from JAMA Internal Medicine, 2021. Published online June 21, 2021. https://doi.org/10.1001/jamainternmed.2021.2915. Copyright© 2021 American Medical Association. All rights reserved.
- Karan et al. The risk of SARS-CoV-2 transmission from patients with undiagnosed COVID-19 to roommates in a large academic medical centerexternal icon. Clinical Infectious Diseases (June 18, 2021). Among 11,290 patients admitted to shared rooms in a Massachusetts hospital between September 2020 and April 2021, 25 tested positive at a median of 3 days after admission. 39% of 31 exposed roommates tested positive within 14 days.
Natural History of SARS-CoV-2 Infection
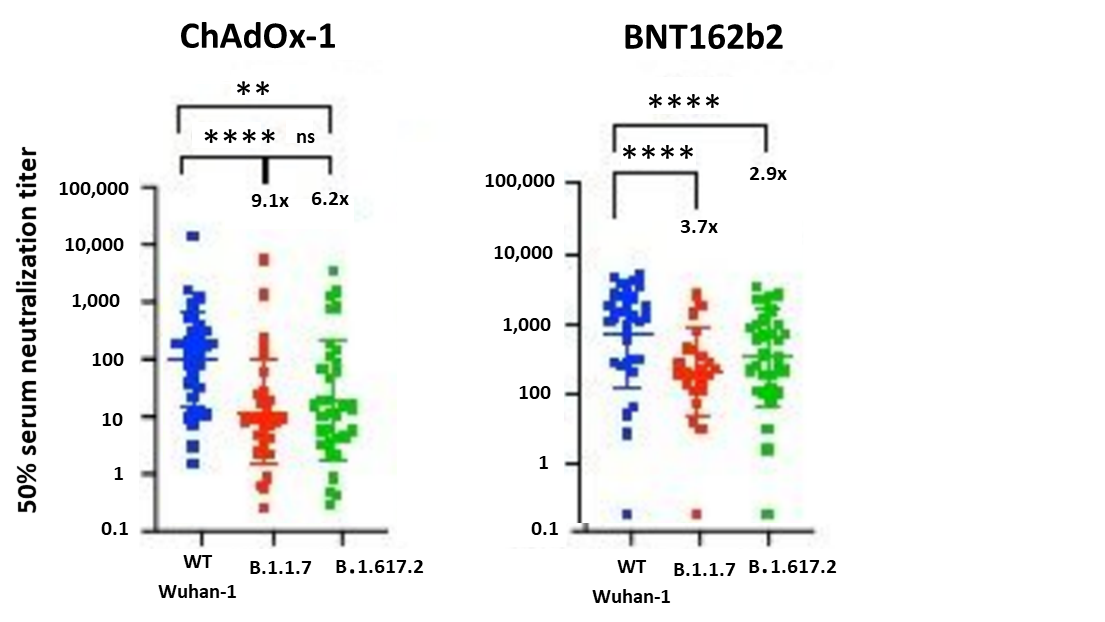
- Mlcochova et al. SARS-CoV-2 B.1.617.2 Delta variant emergence and vaccine breakthroughexternal icon. Research Square (Preprint; June 22, 2021). Published in Nature as SARS-CoV-2 B.1.617.2 Delta variant replication and immune evasionexternal icon (September 6, 2021). Vaccine breakthrough infections in a cohort of healthcare workers at 3 centers in India were predominantly B.1.617.2 (Delta) (98/133). Compared to wild-type (WT Wuhan-1), B.1.617.2 showed an approximate 8-fold reduction in vaccine-elicited antibody production. Serum neutralizing titers were lower in participants vaccinated with ChAdOx-1 (Oxford/AstraZeneca) compared to BNT162b2 (Pfizer/BioNTech) (GMT 654 vs. 3372, p = .0006).
Note: Adapted from Mlcochova et al. Neutralization of B.1.617.2 variant by sera from vaccinated individuals (n=33 ChAdOx-1 or n = 32 BNT12b2) in comparison to B.1.1.7 (Alpha) variant and Wuhan-1 (D614G) wild type. **p<0.01; ****p<0.0001; ns = not significant. Licensed under CC BY 4.0.
Prevention, Mitigation, and Intervention Strategies
- Braun-Moscovici et al. Disease activity and humoral response in patients with inflammatory rheumatic diseases after two doses of the Pfizer mRNA vaccine against SARS-CoV-2external icon. Annals of Rheumatic Diseases (June 18, 2021). After 2 doses of BNT162b2 (Pfizer/BioNTech), 86% of 264 patients with inflammatory rheumatic diseases mounted significant humoral response of neutralizing IgG antibodies (median 3,058 AU/mL, range 58–40,000). Only minor side effects were reported. The type of immunomodulatory treatment influenced the humoral response.
- Mazzola et al. Poor antibody response after two doses of SARS-CoV-2 vaccine in transplant recipientsexternal icon. Clinical Infectious Diseases (June 24, 2021). Compared to 100% of a group of healthy controls (n = 25), only 28.6% of 133 solid-organ transplant recipients without previous COVID-19 infection were seropositive 28 days after the 2nd dose of BNT162b2 (Pfizer/BioNTech). Seroconversion was 37.5%, 16.6%, and 34.8% in liver, kidney, and heart recipients, respectively. Fewer than 2 years between transplantation and 1st vaccine was associated with negative serologic response (aOR, 2.87; 95% CI (1.06-7.75)).
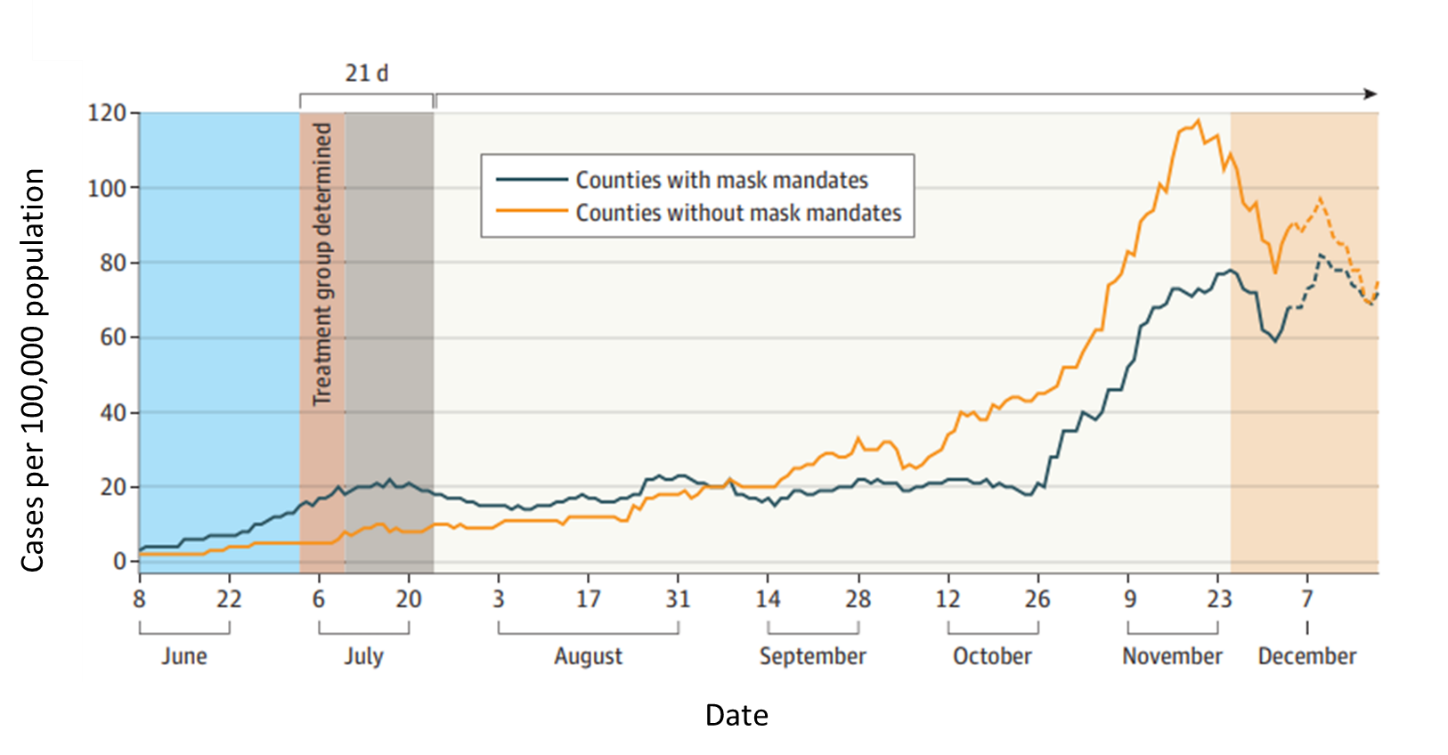
- Ginther et al. Association of mask mandates and COVID-19 case rates, hospitalizations, and deaths in Kansasexternal icon. JAMA Network Open (June 23, 2021). By mid-October 2020, counties that adopted the July mask mandate (n = 15) in Kansas experienced significantly lower rates of COVID-19 cases, hospitalizations, and deaths compared with those that did not (n = 68). Through December 4, cases were 20.33 (95% CI -26.54 to -14.12) per day lower in mask counties. Similar patterns were seen for hospitalizations and deaths.
Note: Adapted from Ginther et al. 7-day moving average of COVID-19 cases per 100,000 population in mask and no mask counties in Kansas between June and December 18, 2020. Treatment group = July mask mandate. Licensed under CC BY.
Disclaimer: The purpose of the CDC COVID-19 Science Update is to share public health articles with public health agencies and departments for informational and educational purposes. Materials listed in this Science Update are selected to provide awareness of relevant public health literature. A material’s inclusion and the material itself provided here in full or in part, does not necessarily represent the views of the U.S. Department of Health and Human Services or the CDC, nor does it necessarily imply endorsement of methods or findings. While much of the COVID-19 literature is open access or otherwise freely available, it is the responsibility of the third-party user to determine whether any intellectual property rights govern the use of materials in this Science Update prior to use or distribution. Findings are based on research available at the time of this publication and may be subject to change.

