COVID-19 Science Update released: May 7, 2021 Edition 88

The COVID-19 Science Update summarizes new and emerging scientific data for public health professionals to meet the challenges of this fast-moving pandemic. Weekly, staff from the CDC COVID-19 Response and the CDC Library systematically review literature in the WHO COVID-19 databaseexternal icon, and select publications and preprints for public health priority topics in the CDC Science Agenda for COVID-19 and CDC COVID-19 Response Health Equity Strategy.
Section headings in the COVID-19 Science Update align with the CDC Science Agenda for COVID-19.
Section headings in the COVID-19 Science Update have been changed to align
with the CDC Science Agenda for COVID-19.
Here you can find all previous COVID-19 Science Updates.
PEER-REVIEWED
Household COVID-19 risk and in-person schooling.external icon Lessler et al. Science (April 29, 2021).
Key findings:
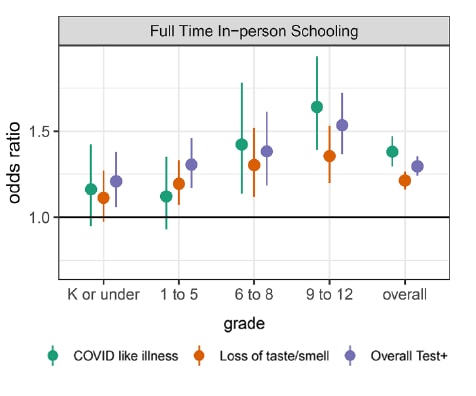
- Living with a child attending school full-time and in-person increased the odds of COVID-19-like illness (adjusted OR [aOR] 1.38, 95% CI 1.30-1.47), loss of taste or smell (aOR 1.21, 95% CI 1.16-1.27), and a positive SARS-CoV-2 test result within the previous 14 days (aOR 1.30, 95% CI 1.24-1.35) (Figure 1).
- Similar but smaller associations were found for part-time schooling.
- The strength of associations for full-time school increased with child’s grade.
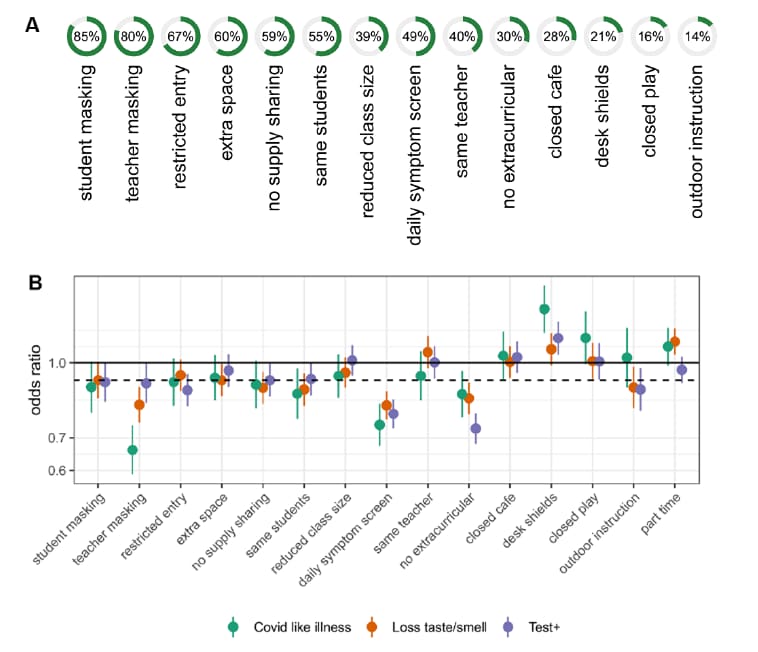
- Schools using multiple mitigation measures decreased the risk of COVID-19 outcomes most and risk was low with 7 or more mitigation measures (Figure 2).
- Individual measures with the greatest protection were daily symptom screening, no extra-curricular activities, and masking.
- Desk shields were associated with increased risk.
Methods: Social media-based survey of 2,142,887 U.S. adults between November 2020 and February 2021, weighted to adjust for non-response and coverage; analyses adjusted for county- and individual-level factors. COVID-19-like illness was self-reported fever of at least 100°F with cough, shortness of breath, or difficulty breathing. Limitations: Cross-sectional study based on self-report; weighting might not have fully addressed representativeness.
Implications: Implementation of risk-mitigation measures in a school setting may dramatically reduce risk for school children and the greater community.
Figure 1:
Note: Adapted from Lessler et al. Adjusted ORs for COVID-19-related outcomes (COVID-like illness, loss of taste/smell, and overall positive test result) for individuals living with a child attending school in person, full-time versus individuals living with children not attending in person school, by grade level. Solid line shows OR of 1.0. From Lessler, J. et al. April 29, 2021. Science. Reprinted with permission from AAAS.
Figure 2:
Note: Adapted from Lessler et al. Panel A shows percentage of full-time schools using each mitigation measure. Panel B shows adjusted ORs for COVID-19-related outcomes (COVID-like illness, loss of taste/smell, and overall positive test result) for adults by mitigation measures in schools with dotted line indicating average and solid line at 1.0. From Lessler, J. et al. April 29, 2021. Science. Reprinted with permission from AAAS.
Comparison of COVID-19 incidence rates before and after school reopening in Israel.external icon Somekh et al. JAMA Network Open (April 26, 2021).
Key findings:
- During 2 school reopening periods in Israel in 2020, children aged 0–9 years had lower rates of SARS-CoV-2 PCR positive tests than older youth and adults.
- Incidence rates increased linearly in all age groups after schools opened in September for the fall term.
- The rate of increase was lowest among children aged 0–9 years.
Methods: National PCR positivity for SARS-CoV-2 for individuals aged 0–9 (n = 47,620), 10–19 (n = 101,304), 20-39 (n = 151,295), 40–59 (n = 103,056), and ≥60 (n = 63,438) years in Israel after schools reopened two times (September 2020 and November 2020) compared to the prior week when schools were closed. Limitations: Infections in untested individuals could have been missed.
Implications: Findings support policies to prioritize school attendance for younger children.
PREPRINTS (NOT PEER-REVIEWED)
Impact of vaccination on household transmission of SARS-COV-2 in England.external icon Harris et al. Knowledge Hub (April 13, 2021). Published in NEJM as Effect of Vaccination on Household Transmission of SARS-CoV-2 in England (June 23, 2021).
Key findings:
- Likelihood of household (HH) transmission was 40-50% lower for HHs in which the index case was vaccinated ≥21 days prior to a positive SARS-CoV-2 test compared with HHs with an unvaccinated index case.
- Effects were similar for Oxford-AstraZeneca (adjusted OR [aOR] = 0.53, 95% CI 0.43-0.63) and Pfizer-BioNTech (aOR = 0.51, 95% CI 0.44-0.59) vaccines.
Methods: The cohort included 365,447 households with a laboratory-confirmed COVID-19 case ≥16 years of age diagnosed January 4, 2021 through February 29, 2021. Contacts (n = 1,018,842) were followed up for 14 days. Secondary cases were identified from the same HH as index cases based on a positive SARS-CoV-2 test 2–14 days after the index case was diagnosed. Limitations: Asymptomatic cases were not identified; some secondary cases may have been co-index cases.
Implications: Real-world data from a cross-section of the population show receipt of at least 1 dose of either the Oxford-AstraZeneca or Pfizer-BioNTech vaccine reduces risk of SARS-CoV-2 household transmission.
PEER-REVIEWED
Re-infection with SARS-CoV-2 in patients undergoing serial laboratory testingexternal icon. Qureshi et al. Clinical Infectious Diseases (April 25, 2021).
Key findings:
- SARS-CoV-2 reinfection was identified in 0.7% (95% CI 0.5-0.9%) of patients.
- The mean number of days between 2 positive tests was 116 ± 21.
- Reinfection appeared to have less severe clinical manifestations than the primary infection:
- The 63 patients with a reinfection had significantly lower rates of pneumonia, heart failure, and acute kidney injury compared with patients with primary infection.
- 2 deaths (3.2%) were associated with reinfection.
Methods: 9,119 patients with SARS-CoV-2 infection received serial tests between December 1, 2019 and November 13, 2020 in 62 healthcare facilities in the United States. Reinfection was defined by 2 positive tests separated by >90 days after resolution of the first infection. Demographic and clinical characteristics associated with reinfection were identified. Limitations: Only included those with serial laboratory tests; persons receiving serial testing may not be representative of population at-risk; no sequence data for strains associated with reinfection.
Implications: The low rate of reinfection with SARS-CoV-2 in the US seen here was similar to rates observed in France (0.47%) by Brouqui et alexternal icon. Choudhary et alexternal icon. suggests that reinfection may be due to waning SARS-CoV-2 antibodies or the presence of viral escape mutations. While reinfection appeared to be milder than primary infection, there was associated mortality. People who have recovered from SARS-CoV-2 infection should therefore continue with prevention measures such as social distancing, masking, and getting vaccinated.
Persistent symptoms the first few months following SARS-CoV-2 infection have been reported. As the pandemic progresses, new information concerning the type and longevity of continued symptoms, quality of life and development of COVID-19-associated conditions is emerging.
A. Medium-term outcome of severe to critically ill patients with SARS-CoV-2 infectionexternal icon. Gautam et al. Clinical Infectious Diseases (April 24, 2021.)
Key findings:
- COVID-19 patients reported shortness of breath (SOB, 63%), fatigue (54%), reduced mobility (38%) and pain (37%) up to 7 months post-symptom onset.
- Patients with SOB had higher rates of comorbidities, residual chest radiographic and lung function test abnormalities than patients without SOB (p <0.01 for all).
- All patients reported significantly reduced quality of life.
Methods: Retrospective case series of 200 patients hospitalized at 3 UK hospitals for severe-to-critical COVID-19 between March 2, 2020 and May 30, 2020. Patients were followed up for 4-7 months post-symptom onset with comprehensive clinical, imaging, lung function, laboratory, and quality of life assessments. Limitations: Excluded mild and moderate cases; no control group.
B. Late conditions diagnosed 1–4 months following an initial COVID-19 encounter: a matched cohort study using inpatient and outpatient administrative data — United States, March 1–June 30, 2020external icon. Chevinsky et al. Clinical Infectious Diseases. (April 28, 2021.)
Key findings:
- 7–8% of all case-patients were diagnosed with a new post-COVID medical condition.
- All case-patients were more likely than control-patients to develop nonspecific chest pain, respiratory, nervous, and circulatory system symptoms.
- Outpatient case-patients were also more likely than control-patients to develop a variety of symptoms affecting multiple organ systems, including acute pulmonary embolism (adjusted OR [aOR] 2.8, 95% CI 1.3-6.0).
- Child case-patients were not more likely to have a post-COVID diagnosis than child control-patients.
Methods: A matched-cohort study derived from an all-payer database was conducted between March 2020 and June 2020. Patients diagnosed with COVID-19 (27,589 inpatients and 46,857 outpatients; “case-patients”) were matched 1:1 with patients without COVID-19 (“control-patients”) and assessed for diagnosis of new medical conditions for 1 to 4 months. Limitations: Database may not accurately capture time of symptom onset; patients with minor symptoms who do not seek hospital care are not captured; database may be subject to information and misclassification errors.
Implications for both studies (Gautam et al. and Chevinsky et al.): Patients with a history of COVID-19 may have persistent symptoms, in addition to general post-viral fatigue, that interfere with daily activities and negatively impact quality of life for months.
SARS-CoV-2 seroprevalence, and IgG concentration and pseudovirus neutralising antibody titres after infection, compared by HIV status: a matched case-control observational studyexternal icon. Spinelli et al. The Lancet HIV (April 29, 2021).
Key findings:
- Among people living with HIV, the adjusted seroprevalence for SARS-CoV-2 IgG was 3.7% (95% CI 2.4-5.0%) compared with 7.4% (5.7-9.2%) in people without HIV (adjusted OR [aOR] 0.50, 95% CI 0.30-0.83).
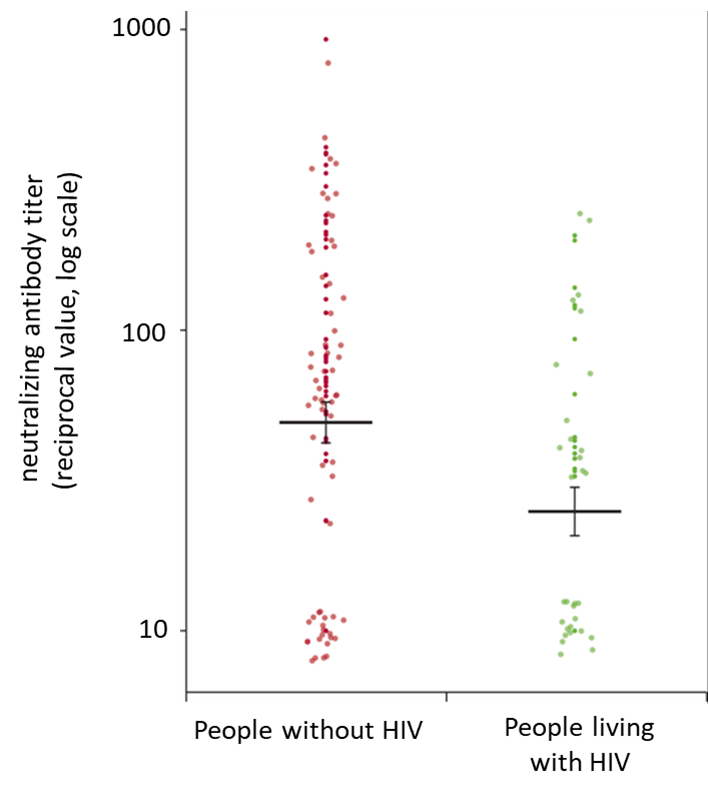
- People living with HIV had lower IgG pseudovirus neutralizing antibody titers than those without HIV (percentage difference −53%, 95% CI −1 to −78%) (Figure).
- Among people with a positive SARS-CoV-2 IgG test, the odds of severe COVID-19 were 5.52 (95% CI 1.01-64.48) times higher for people with HIV compared with those without HIV.
Methods: Matched case-control observational study of 955 participants with HIV and 1062 participants without HIV conducted between August 1 and October 31, 2020. Remnant serum samples were tested for SARS-CoV-2 antibody concentrations and virus neutralization titer using a “pseudovirus” neutralization. Severe COVID-19 was assessed via chart review. Limitation: The SARS-CoV-2 IgG used in this study showed low sensitivity (89%); study did not report testing rates or test positivity, thus, data regarding current infections is limited.
Implications: People living with HIV were not at higher risk of SARS-CoV-2 infection than are those without HIV, however, the risk of severe COVID-19 after SARS-CoV-2 infection might be higher among people living with HIV. People living with HIV should be followed up after vaccination, to ensure they mount a sufficient immune response to prevent severe COVID-19.
Figure:
Note: Adapted from Spinelli et al. SARS-CoV-2 IgG pseudovirus neutralizing antibody titers for people living with HIV (n = 31) and people without HIV (n = 70). The thick bars indicate the mean, and error bars indicate the SE. Data are presented as 1/dilution resulting in 50% neutralization (reciprocal titer). Reprinted from The Lancet HIV, Spinelli et al., SARS-CoV-2 seroprevalence, and IgG concentration and pseudovirus neutralising antibody titres after infection, compared by HIV status: a matched case-control observational study, Copyright 2021, with permission from Elsevier.
PEER-REVIEWED
Physical inactivity is associated with a higher risk for severe COVID-19 outcomes: a study in 48,440 adult patientsexternal icon. Sallis et al. British Journal of Sports Medicine (April 13, 2021).
Key findings:
- Consistent prior physical inactivity was associated with higher odds for hospitalization (adjusted OR [aOR] 2.26; 95% CI 1.81 to 2.83), ICU admission (aOR 1.73; 95% CI 1.18 to 2.55), and death (aOR 2.49; 95% CI 1.33 to 4.67) compared with COVID-19 patients who were consistently active (met aerobic physical activity guidelinesexternal icon).
- 6.4% of COVID-19 patients met aerobic physical activity guidelines and 14.4% were consistently inactive.
- 8.7% of COVID-19 patients were hospitalized, 2.5% were admitted to the ICU and 1.6% died.
Methods: Observational study using electronic health records from 48,440 adult COVID-19 Kaiser Permanente, Southern California patients (January and October 2020). Prior physical activity was categorized as consistently active/meeting physical activity guidelines (>150 min/week), some activity (11–149 min/week) and consistently inactive (0–10 min/week). Multivariable logistic regression model controlled for demographics and known risk factors. Limitations: Physical activity was self-reported; sparse data for adults who met the physical activity guidelines.
Implications: Regular physical activity may reduce the risk for severe COVID-19 outcomes among infected adults. Physical activity should be encouraged for many reasons, including to potentially reduce adverse COVID-19 outcomes.
PREPRINTS (NOT PEER-REVIEWED)
Efficacy of universal masking for source control and personal protection from simulated cough and exhaled aerosols in a roomexternal icon. Lindsley et al. medRxiv (April 25, 2021). Published in Journal of Occupational and Environmental Hygieneexternal icon (July 21, 2021).
Key findings:
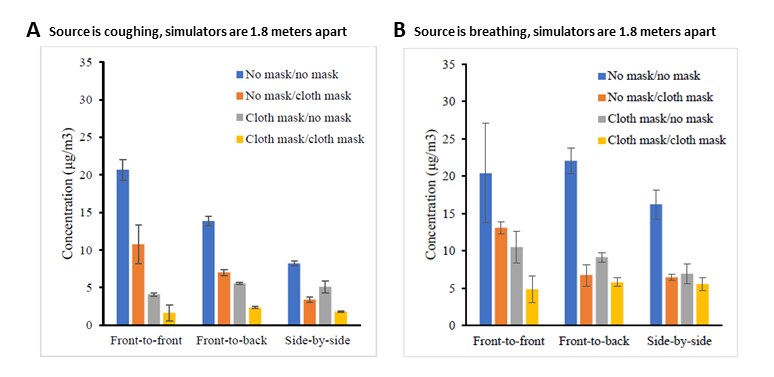
- Recipient aerosol exposure was reduced when source and recipient were both masked, separated up to 1.8 meters (~6 feet), and oriented front-to-front (92% decreased exposure when source was coughing, ≥66% during breathing) or side-to-side (≥78% when coughing and ≥76% during breathing) (Figure 1).
- Changing source and recipient orientation from front-to-front to side-by-side reduced cough aerosol exposure by ≥59% when both were unmasked and separated up to 1.8 meters (Figure 1).
- Increasing distance between unmasked source and recipients from 0.9 to 1.8 meters reduced recipient aerosol exposure by 25% when source was coughing.
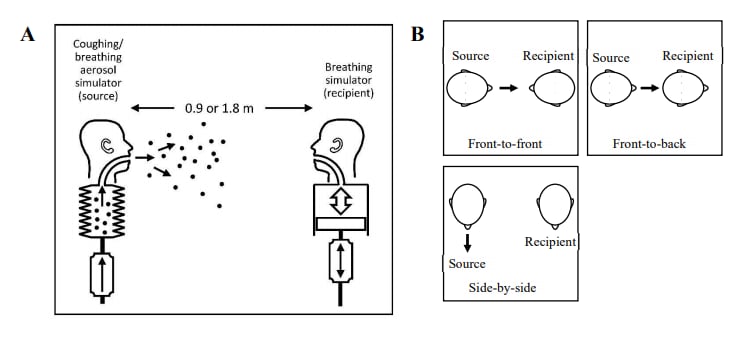
Methods: A respiratory aerosol simulator (“source”) and breathing simulator (“recipient”) were used to determine how different combinations of masking, simulator orientations, and separation distance affected the aerosol exposure of the recipient (Figure 2). Limitations: Aerosol particles measured were from 0.3 to 3 μm, but humans produce particles across a broader size range.
Implications: Universal masking reduces exposure to respiratory aerosol particles regardless of the orientation and separation distance between the source and recipient. When both the source and recipient are unmasked, changes in orientation and separation distance can reduce recipient exposure.
Figure 1:
Note: Adapted from Lindsley et al. Mean aerosol concentration measured at recipient simulators’ mouth, with and without masks (source no mask/recipient no mask, source no mask/recipient cloth mask, source cloth mask/recipient no mask, source cloth mask/recipient cloth mask) and with simulators in different orientations. (A) Source is coughing and (B) source is breathing. Each bar is the mean of 3 experiments. Error bars show the standard deviation. U.S. Government work not subject to copyright.
Figure 2:
Note: Adapted from Lindsley et al. Schematic of source and recipient simulators in environmental chamber (not to scale). (A) Side view. (B) Top view showing 3 simulator orientations. U.S. Government work not subject to copyright.
Detection, Burden, and Impact
- McKay et al. Performance evaluation of serial SARS-CoV-2 rapid antigen testing during a nursing home outbreakexternal icon. Annals of Internal Medicine (April 27, 2021). In 532 specimens, the BinaxNOW SARS-CoV-2 antigen test showed 95% positive percent agreement (PPA) with virus culture but only 69% PPA with RT-PCR. Higher PPA (86%) with RT-PCR was seen in “early infection” where higher viral load is seen. Percent negative agreement was 98%.
- Osmanodja et al. Diagnostic accuracy of a novel SARS-CoV-2 antigen-detecting rapid diagnostic test from standardized self-collected anterior nasal swabs.external icon medRxiv (Preprint, April 23, 2021). Published in Journal of Clinical Medicine as Accuracy of a novel SARS-CoV-2 antigen-detecting rapid diagnostic test from standardized self-collected anterior nasal swabsexternal icon (May 13, 2021). The sensitivity of an antigen rapid diagnostic test using self-collected NP swabs was 88.6% (95% CI 78.7-94.9%) and specificity was 99.7% (95% CI 98.2-100%) in specimens from 379 participants.
- Renoud et al. Association of facial paralysis with mRNA COVID-19 vaccines: A disproportionality analysis using the World Health Organization pharmacovigilance databaseexternal icon. JAMA Internal Medicine (April 27, 2021). Risk for facial paralysis associated with COVID-19 mRNA vaccines is likely very low and was not found to be higher than the risk with influenza or other viral vaccines.
- Osmanov et al. Risk factors for long COVID in previously hospitalised children using the ISARIC Global follow-up protocol: A prospective cohort study.external icon medRxiv (Preprint, April 26, 2021). Published in European Respiratory Journal as Risk factors for post-COVID-19 condition in previously hospitalised children using the ISARIC Global follow-up protocol: a prospective cohort studyexternal icon (February 3, 2022). Of 518 hospitalized children ≤18 years of age in Russia, 24.3% reported persistent symptoms such as fatigue, sleep disturbance and sensory problems 6–7 months after hospitalization with COVID-19; persistent symptoms were associated with age >5 years.
Natural History of SARS-CoV-2 Infection
- Truong et al. Increased viral variants in children and young adults with impaired humoral immunity and persistent SARS-CoV-2 infection: A consecutive case series. external iconEbioMedicine (May 2021). Genomic sequencing of SARS-CoV-2 strains in 3 patients with lymphoblastic leukemia had evidence of persistent SARS-CoV-2 infection; 2 patients with weak anti-SARS-CoV-2 antibody responses were infection positive for >100 days and showed evidence of escape variants.
- Funk et al. Characteristics of SARS-CoV-2 variants of concern B.1.1.7, B.1.351 or P.1: data from seven EU/EEA countries, weeks 38/2020 to 10/2021external icon. Euro Surveillance (April 21, 2021). Weekly case reporting from 7 European countries showed increased hospitalizations associated with the SARS-CoV-2 variants B.1.1.7/SGTF, B.1.351 and P.1 and increased ICU admissions associated B.1.1.7/SGTF and P.1. This underscores the need for high vaccine coverage and adherence to public health measures to reduce SARS-CoV-2 incidence and prevent severe cases.
Prevention, Mitigation, and Intervention Strategies
- See et al. US case reports of cerebral venous sinus thrombosis with thrombocytopenia after Ad26.COV2.S vaccination, March 2 to April 21, 2021.external icon JAMA (April 30, 2021). Outcomes of 12 cases of cerebral venous sinus thrombosis (CVST) with thrombocytopenia after receipt of the Ad26.COV2.S (Janssen/Johnson & Johnson) vaccine were death (n = 3), continued ICU care (n = 3), continued non-ICU hospitalization (n = 2), and discharged home (n = 4); all cases were in White women <60 years of age in 11 different states.
- Reynolds et al. Prior SARS-CoV-2 infection rescues B and T cell responses to variants after first vaccine doseexternal icon. Science (April 30, 2021). In a subsample (n = 51) of a cohort of UK health care workers (HCWs), a single dose of the Pfizer/BioNTech mRNA vaccine increased SARS-CoV-2 specific antibody and T cell responses in HCWs previously infected with SARS-CoV-2 compared with uninfected HCWs. Previously infected and vaccinated HCWs had antibodies that neutralized the SARS-CoV-2 variants B.1.1.7 and B.1.351.
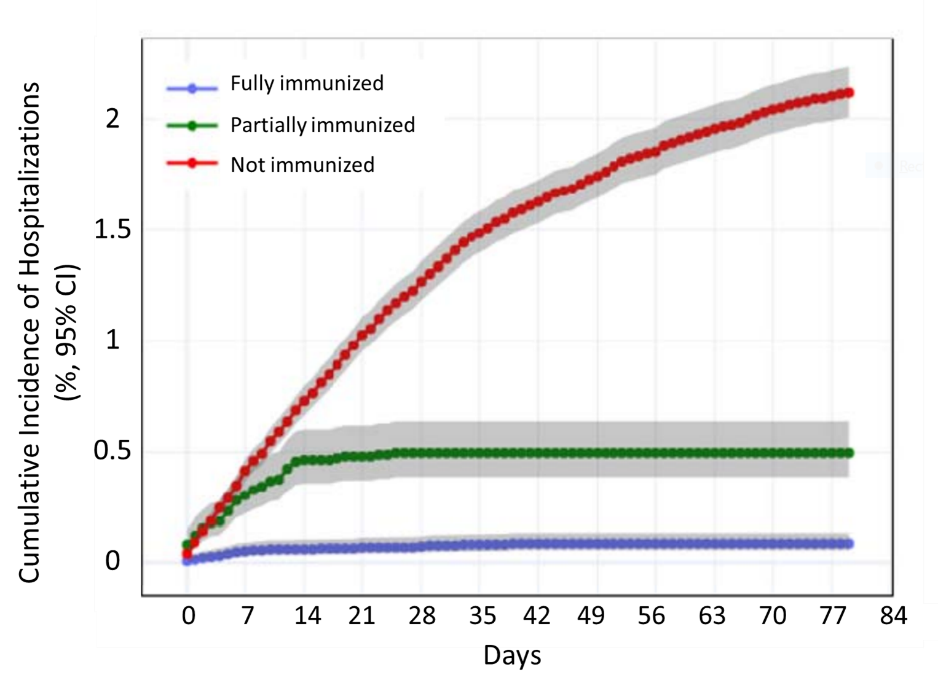
- Vahidy et al. Real world effectiveness of COVID-19 mRNA vaccines against hospitalizations and deaths in the United Statesexternal icon. medRxiv (Preprint, April 23, 2021). In a cohort of 91,134 patients in the Houston Methodist healthcare system, hospitalization with COVID-19 occurred in 0.7% of fully immunized, 3.4% of partially immunized, and 2.7% of non-immunized patients. Only one of the 225 deaths among COVID-19 hospitalizations was a fully immunized patient.
Figure:
Note: Adapted from Vahidy et al. Cumulative incidence of COVID-19 hospitalization among fully immunized, partially immunized, and unimmunized individuals. Gray shaded areas show 95% confidence intervals. Used by permission of authors.
- Swift et al. Effectiveness of mRNA COVID-19 vaccines against SARS-CoV-2 infection in a cohort of healthcare personnelexternal icon. Clinical Infectious Diseases (April 26, 2021). Healthcare personnel (HCP) at Mayo Clinic campuses in Minnesota, Florida, and western Wisconsin (n = 71,152) who received 2 doses of an mRNA COVID-19 vaccine had lower rates of infection (0.1%) compared with partially vaccinated (3.1%) or non-vaccinated (4.2%) HCPs, for an estimated vaccine effectiveness of >96%.
Disclaimer: The purpose of the CDC COVID-19 Science Update is to share public health articles with public health agencies and departments for informational and educational purposes. Materials listed in this Science Update are selected to provide awareness of relevant public health literature. A material’s inclusion and the material itself provided here in full or in part, does not necessarily represent the views of the U.S. Department of Health and Human Services or the CDC, nor does it necessarily imply endorsement of methods or findings. While much of the COVID-19 literature is open access or otherwise freely available, it is the responsibility of the third-party user to determine whether any intellectual property rights govern the use of materials in this Science Update prior to use or distribution. Findings are based on research available at the time of this publication and may be subject to change.

