Diagnoses of HIV Infection in the United States and Dependent Areas 2019: Figures


Note: See section D2.2 in the Technical Notes for more information on gender.


Note: See section D3 in the Technical Notes for more information on race/ethnicity. aHispanic/Latino persons can be of any race.

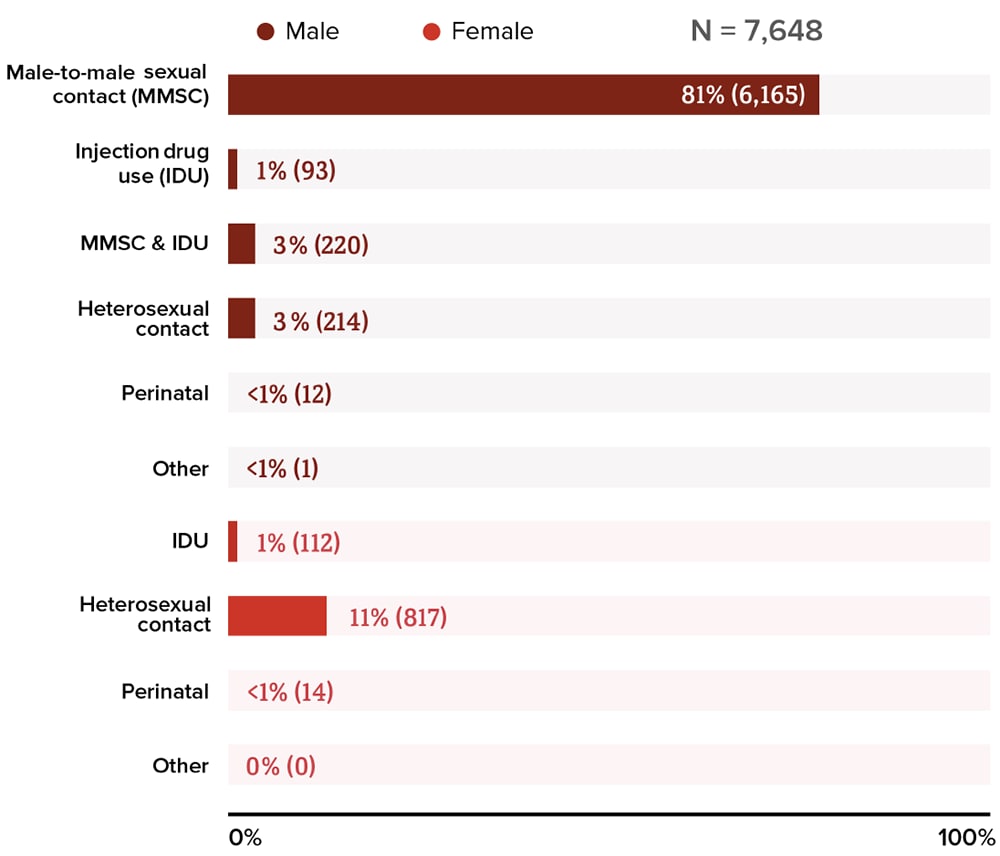
Note: Data have been statistically adjusted to account for missing transmission category. See section D4 in the Technical Notes for more information on transmission categories.

Note: Data have been statistically adjusted to account for missing transmission category. See section D4 in the Technical Notes for more information on transmission categories.

Note: Data for the year 2019 are preliminary and based on deaths reported to CDC as of December 2020. Data are based on address of residence as of December 31, 2019 (i.e., most recent known address). Asterisk (*) indicates incomplete reporting. See section C1.2 in Technical Notes for more information on deaths

Note: See sections C1.2 and D3 in Technical Notes for more information on deaths and race/ethnicity.
aIncludes Asian/Pacific Islander legacy cases.
bHispanic/Latino persons can be of any race.

Note: Data for the year 2019 are preliminary and based on deaths reported to CDC as of December 2020. Data are based on address of residence as of December 31, 2019 (i.e., most recent known address). Asterisk (*) indicates incomplete reporting. See section C1.3 in Technical Notes for more information on prevalence.

Note: Data for the year 2019 are preliminary and based on deaths reported to CDC as of December 2020. See section D3 in Technical Notes for more information on race/ethnicity.
aIncludes Asian/Pacific Islander legacy cases.
bHispanic/Latino persons can be of any race.

Note: Data have been statistically adjusted to account for missing transmission category. See section D4 in the Technical Notes for more information on transmission categories.

Note: Data have been statistically adjusted to account for missing transmission category. See sections D3 and D4 in the Technical Notes for more information on race/ethnicity and transmission categories.
aHispanic/Latino persons can be of any race.

Note: Data have been statistically adjusted to account for missing transmission category. See sections D3 and D4 in the Technical Notes for more information on race/ethnicity and transmission categories.
aHispanic/Latino persons can be of any race.


Note: Data have been statistically adjusted to account for missing transmission category. See sections D3 and D4 in the Technical Notes for more information on race/ethnicity and transmission categories.
aHispanic/Latino persons can be of any race.

Note: Data have been statistically adjusted to account for missing transmission category. See sections C, D3, D4, and E1 in the Technical Notes for more information on interpreting numbers, race/ethnicity, transmission categories and U.S. Census Regions.
aHispanic/Latino persons can be of any race.

Note: See section D2.2 in the Technical Notes for more information on gender.

Note: See sections D2.2 and D3 in the Technical Notes for more information on gender and race/ethnicity.

Note: See sections D2.2 and D3 in the Technical Notes for more information on gender and race/ethnicity.
aHispanic/Latino persons can be of any race.


Note: See section D3 in the Technical Notes for more information on race/ethnicity.
aHispanic/Latino persons can be of any race.

Note: See section D3 in the Technical Notes for more information on race/ethnicity.
aHispanic/Latino persons can be of any race.

Note: Data have been statistically adjusted to account for missing transmission category. See sections D3 and D4 in the Technical Notes for more information on race/ethnicity and transmission categories.
aHispanic/Latino persons can be of any race.

Note: See sections D3 and E1 in the Technical Notes for more information on race/ethnicity and U.S. Census Regions.
aHispanic/Latino persons can be of any race.

Note: See section D2.2 in the Technical Notes for more information on gender.


Note: See section D3 in the Technical Notes for more information on race/ethnicity.
aHispanic/Latino persons can be of any race.

Note: See section D3 in the Technical Notes for more information on race/ethnicity.
aHispanic/Latino persons can be of any race.

Data have been statistically adjusted to account for missing transmission category. See section D4 in the Technical Notes for more information on transmission categories.
Note: Data have been statistically adjusted to account for missing transmission category. See section D4 in the Technical Notes for more information on transmission categories.


Note: See section D3 in the Technical Notes for more information on race/ethnicity.
aHispanic/Latino persons can be of any race.

Note: See section D3 in the Technical Notes for more information on race/ethnicity.
aHispanic/Latino persons can be of any race.

Note: Data for the year 2019 are preliminary and based on deaths reported to CDC as of December 2020. Data are based on address of residence as of December 31, 2019 (i.e., most recent known address). Asterisk (*) indicates incomplete reporting. See section C1.3 in Technical Notes for more information on prevalence.

Note: Data for the year 2019 are preliminary and based on deaths reported to CDC as of December 2020. Data are based on address of residence as of December 31, 2019 (i.e., most recent known address). Asterisk (*) indicates incomplete reporting. See section C1.3 in Technical Notes for more information on prevalence.