Monitoring Selected National HIV Prevention and Care Objectives by Using HIV Surveillance Data—United States and 6 Dependent Areas, 2021: Special Focus Profiles


The Special Focus Profiles highlight the distribution of HIV care outcomes among persons aged ≥ 13 years with diagnosed HIV (except perinatally acquired infection) and identify potential gaps in these outcomes among 6 populations of interest to HIV prevention programs in state and local health departments: (1) Gay, Bisexual, and Other Men Who Have Sex With Men; (2) Persons Who Inject Drugs (PWID); (3) Transgender and Additional Gender Identity Persons; (4) Women; (5) Persons with Perinatally Acquired HIV Infection; and (6) Young Persons aged 13–24 years. Data by transmission category have been statistically adjusted and the percentages are presented as reported in the tables for each population. The statements in this section, unless otherwise indicated, are based on numbers of 12 or more. See suggested readings from the 2021 HIV Surveillance Report [5] for references and additional information including HIV risk behaviors, barriers to care, and prevention challenges for each population of particular interest.

Gay, bisexual, and other men who report male-to-male sexual contact (MSM), based on male assigned sex at birth, are disproportionately affected by HIV in the United States. Stigma, homophobia, and discrimination make MSM of all races/ethnicities susceptible to multiple physical and mental health problems and can affect whether they seek and receive high-quality health services, including HIV testing, treatment, and other prevention services [5].
In 2021 in the United States, infection attributed to MMSC accounted for 66.8% (23,855 MMSC, excluding MMSC and IDU) of the 35,716 new HIV diagnoses. Many Black/African American and Hispanic/Latino MSM with HIV, particularly young MSM (aged 13‒24 years), are unaware of their HIV infection. Lack of awareness of HIV status among young MSM may be due to recent infection, not getting tested due to underestimation of personal risk, or fewer opportunities to get tested. Persons who do not know they have HIV do not get medical care or receive treatment and can unknowingly transmit infection through sex or sharing needles, syringes, or other drug injection equipment [5].
Stage of disease at time of diagnosis among MSM
In 2021, of 22,659 males with infection attributed to MMSC, 32.4% of infections were diagnosed at an earlier stage (stage 0 or 1) and 20.0% were classified as stage 3 (AIDS) at the time of diagnosis (Table 1a). By race/ethnicity, HIV infections attributed to MMSC were diagnosed at an earlier stage (0 or 1) compared to percentages diagnosed at Stage 3 (AIDS). However, diagnoses of infection attributed to MMSC among males of all races/ethnicities (except for Black/African American MSM) had ≥ 20% of infections classified as stage 3 (AIDS) at the time of diagnosis (Table 1d).
Percentages of MSM with HIV diagnosed at an earlier stage (0 or 1) compared to the percentages with a late-stage diagnosis by race/ethnicity were as follows (Table 1d):
- American Indian/Alaska Native―28.9% vs 20.0%
- Asian―26.8% vs 22.7%
- Black/African American―31.0% vs 17.2%
- Hispanic/Latino―33.2% vs 21.0%
- Native Hawaiian/other Pacific Islander―35.6% vs 23.9%
- White―34.5% vs 22.5%
- multiracial―30.6% vs 21.3%
Linkage to HIV medical care within 1 month of diagnosis and viral suppression within 6 months of diagnosis among MSM
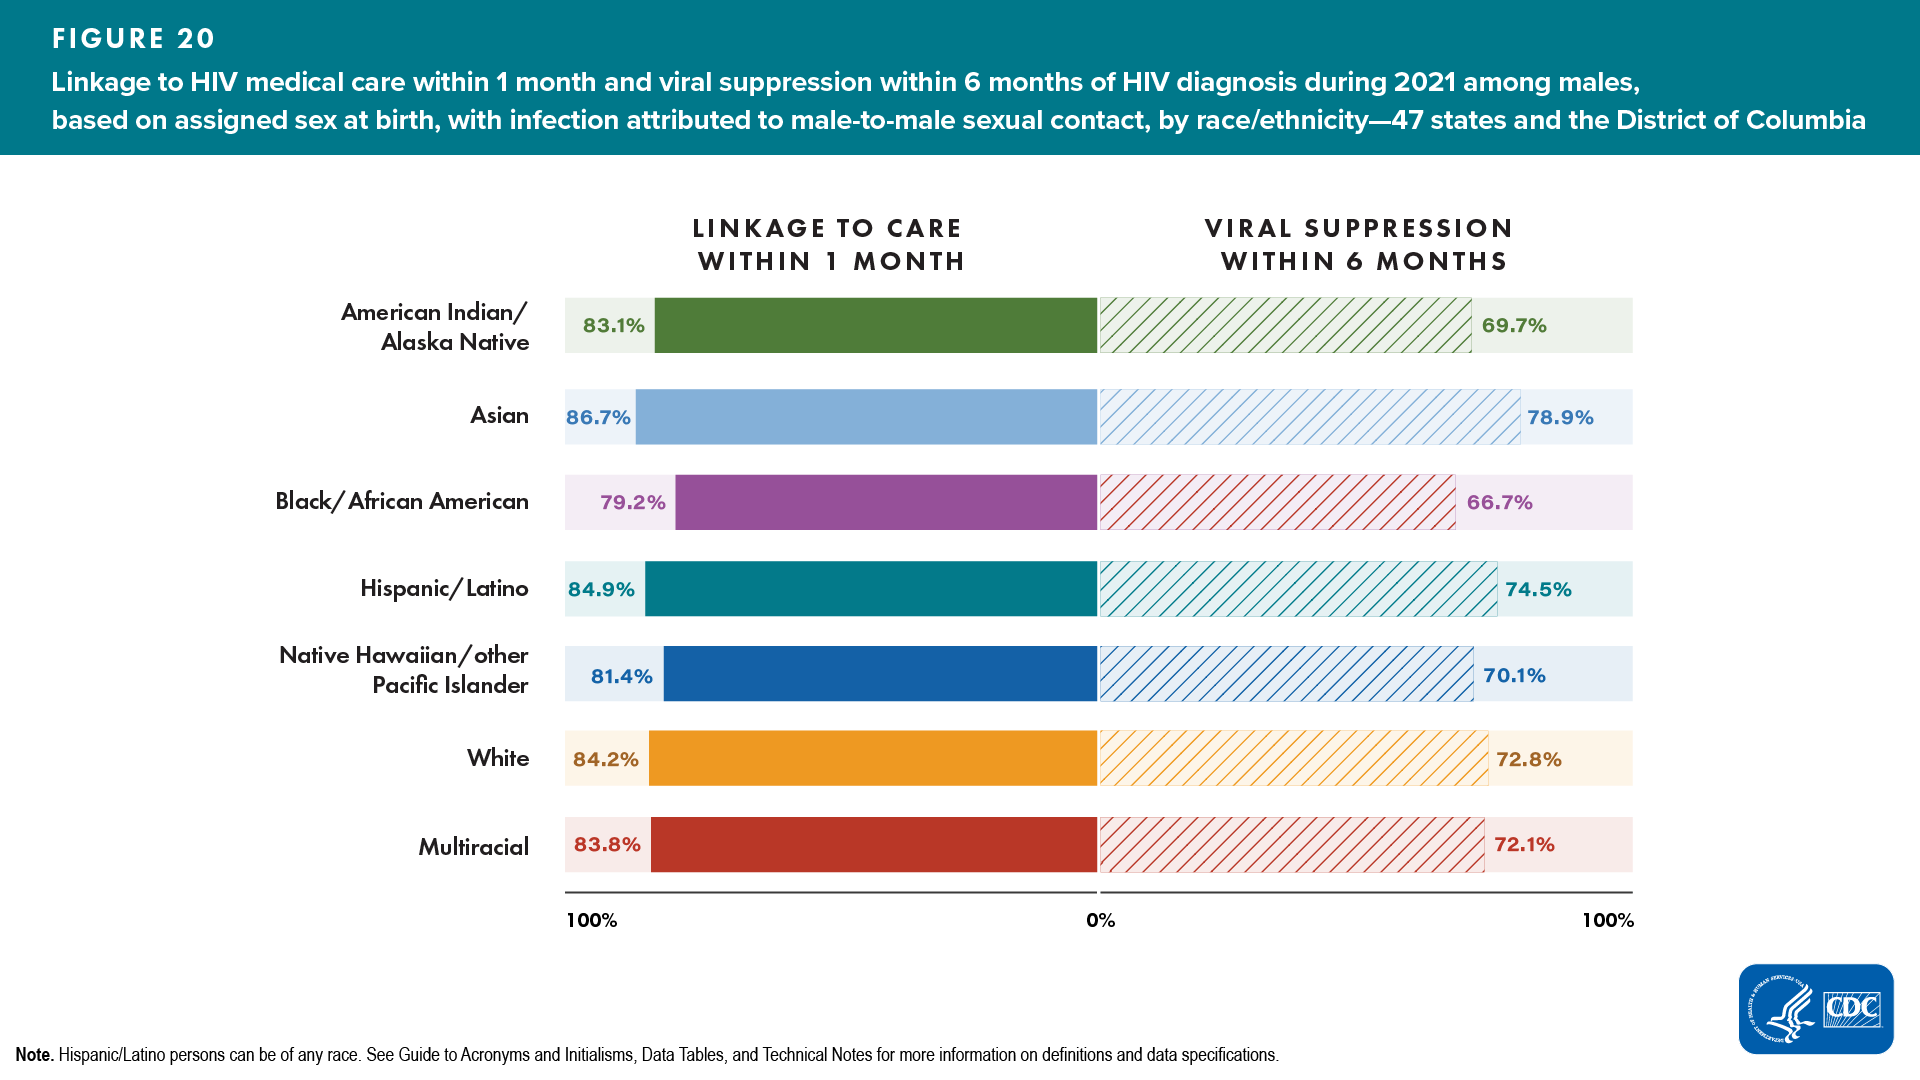
In 2021, of 22,659 males with infection attributed to MMSC, 82.6% were linked to HIV medical care within 1 month of diagnosis and 71.2% had viral suppression within 6 months of diagnosis (Table 2a).
Lowest percentages of linkage to HIV medical care and viral suppression for males with infection attributed to MMSC were as follows (Figure 20, Table 2d): ![]()
Race/ethnicity
- Linkage to HIV medical care―Black/African American (79.2%)
- Viral suppression―Black/African American (66.7%)
Race/ethnicity and Age group
- Linkage to HIV medical care―Black/African American MSM aged 35–44 years (77.7%)
- Viral suppression―Black/African American MSM aged 35–44 years (63.5%)
Receipt of HIV medical care and viral suppression among MSM
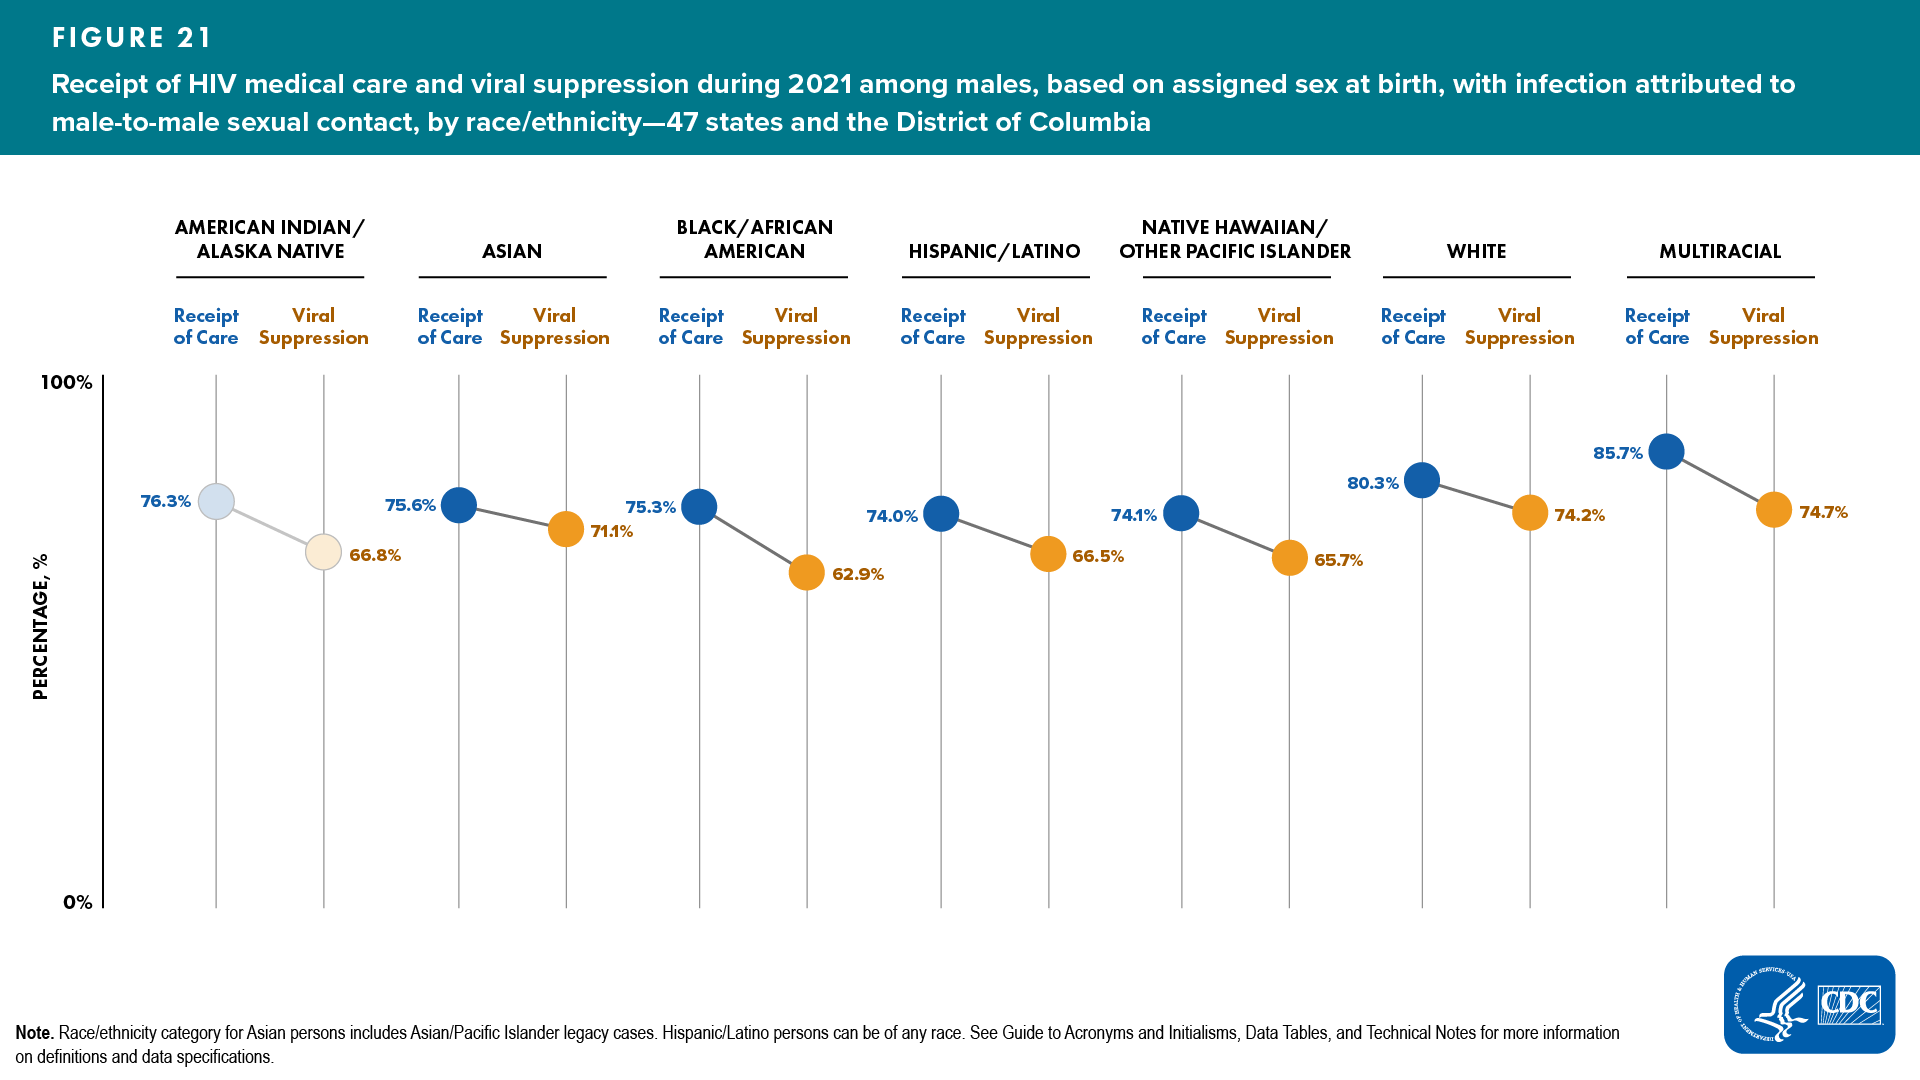
Of 561,493 males with infection attributed to MMSC living with diagnosed HIV at year-end 2021, 77.2% received HIV medical care and 68.6% had viral suppression at the most recent viral load test (Tables 3a and 4a).
Lowest percentages of receipt of any HIV medical care and viral suppression for males with infection attributed to MMSC were as follows (Figure 21, Table 3d): ![]()
Race/ethnicity
- Receipt of HIV medical care―Hispanic/Latino and Native Hawaiian/other Pacific Islander (74.0% and 74.1%, respectively)
- Viral suppression―Black/African American (62.9%)
Race/ethnicity and Age group
- Receipt of HIV medical care
- Hispanic/Latino MSM aged ≥ 45 years―71.7%
- Native Hawaiian/other Pacific Islander MSM aged 13–24 years―63.0%
- Viral suppression
- Black/African American MSM aged 25–34―61.1%
- Hispanic/Latino MSM aged ≥ 45 years―71.4%
PERSONS WHO INJECT DRUGS
Persons who inject drugs (PWID) can get HIV if they use and share needles, syringes, or other drug injection equipment (e.g., cookers) that someone with HIV has used. In 2021, infections attributed to injection drug use (IDU) accounted for about 1 in 15 HIV diagnoses in the United States. In recent years, the opioid (including prescription and synthetic opioids) and heroin crisis has led to increased numbers of PWID. HIV diagnoses among PWID have increased in the 50 states and District of Columbia. IDU in nonurban areas has created prevention challenges and brought attention to populations who would benefit from HIV prevention efforts [5].
In 2021 in the United States, 7.0% of the 35,716 reported HIV diagnoses were attributed to IDU (1,415 among male and 1,075 among female PWID) [5].
Stage of disease at time of diagnosis of HIV infection attributed to IDU
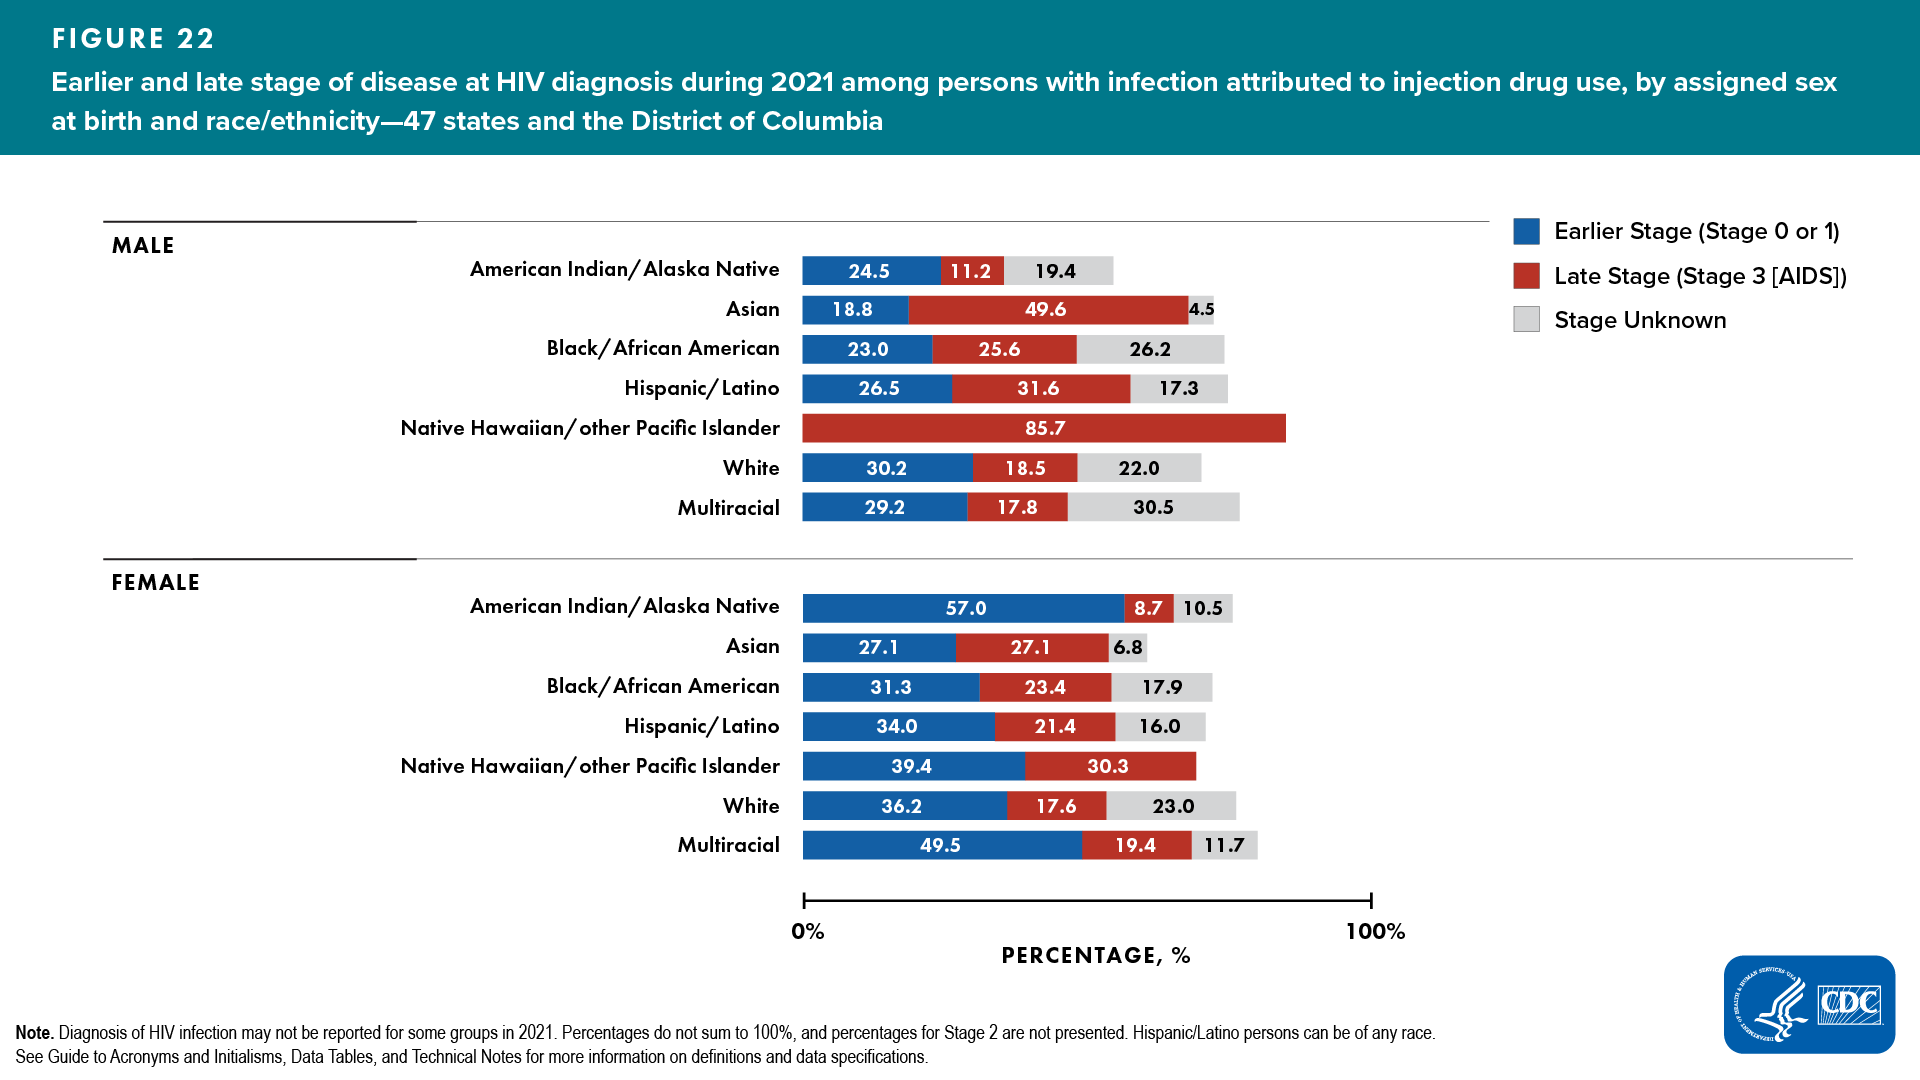
In 2021, of 2,326 persons with infection attributed to IDU, 30.8% of infections were diagnosed at an earlier stage (stage 0 or 1) and 21.8% were classified as stage 3 (AIDS) at the time of diagnosis (Table 1a).
Percentages of HIV infections attributed to IDU diagnosed at an earlier stage (0 or 1) compared to percentages diagnosed at stage 3 (AIDS), respectively, by ASAB and race/ethnicity, were as follows (Figure 22, Table 1c):
- Among males
- American Indian/Alaska Native—24.5% vs 11.2%
- Asian—18.8% vs 49.6%

- Black/African American—23.0% vs 25.6%
- Hispanic/Latino—26.5% vs 31.6%
- Native Hawaiian/other Pacific Islander—0.0% vs 85.7%
- White—30.2% vs 18.5%
- multiracial—29.2% vs 17.8%
- Among females
- American Indian/Alaska Native—57.0% vs 8.7%
- Asian—27.1% vs 27.1%
- Black/African American—31.3% vs 23.4%
- Hispanic/Latino—34.0% vs 21.4%
- White—36.2% vs 17.6%
- multiracial—49.5% vs 19.4%
Linkage to HIV medical care within 1 month of diagnosis and viral suppression within 6 months of diagnosis among persons with infection attributed to IDU
In 2021, of 2,326 persons with infection attributed to IDU, 75.5% were linked to HIV medical care within 1 month of diagnosis and 52.3% had viral suppression within 6 months of diagnosis (Table 2a):
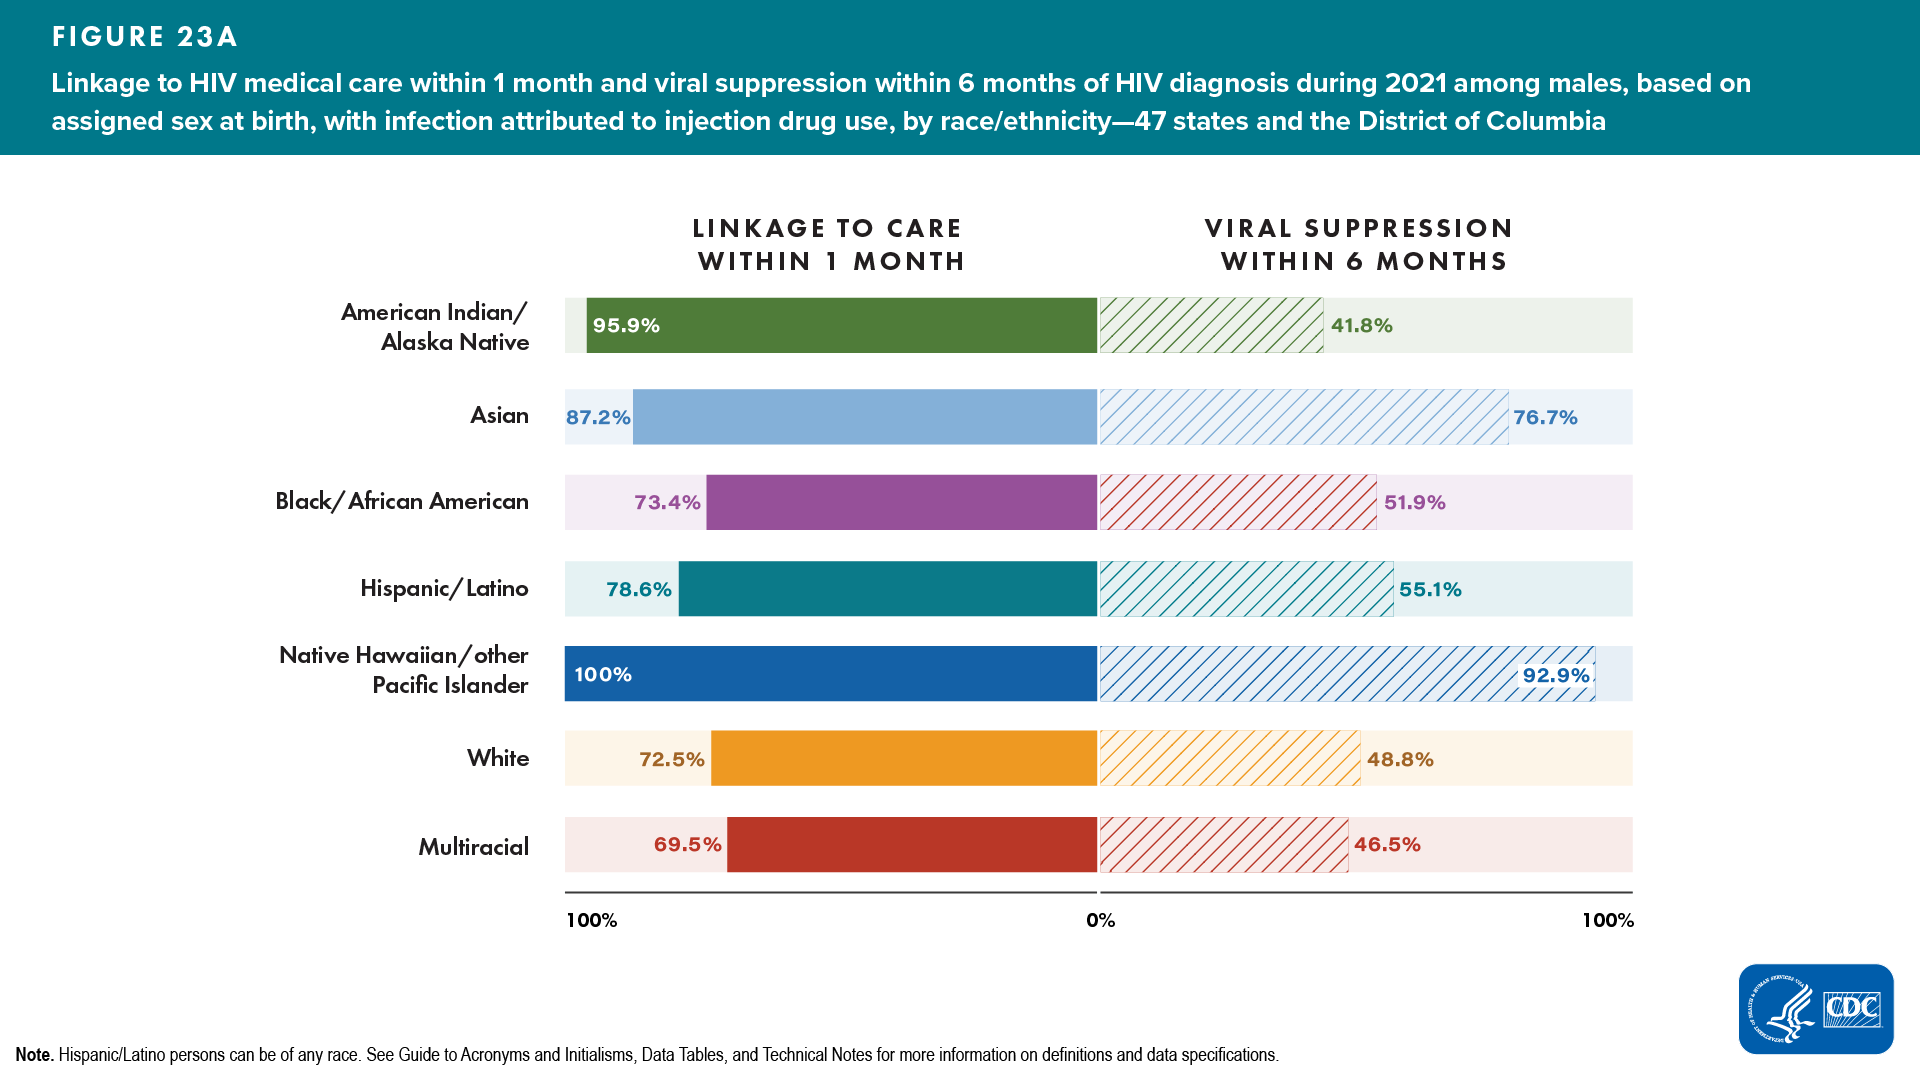
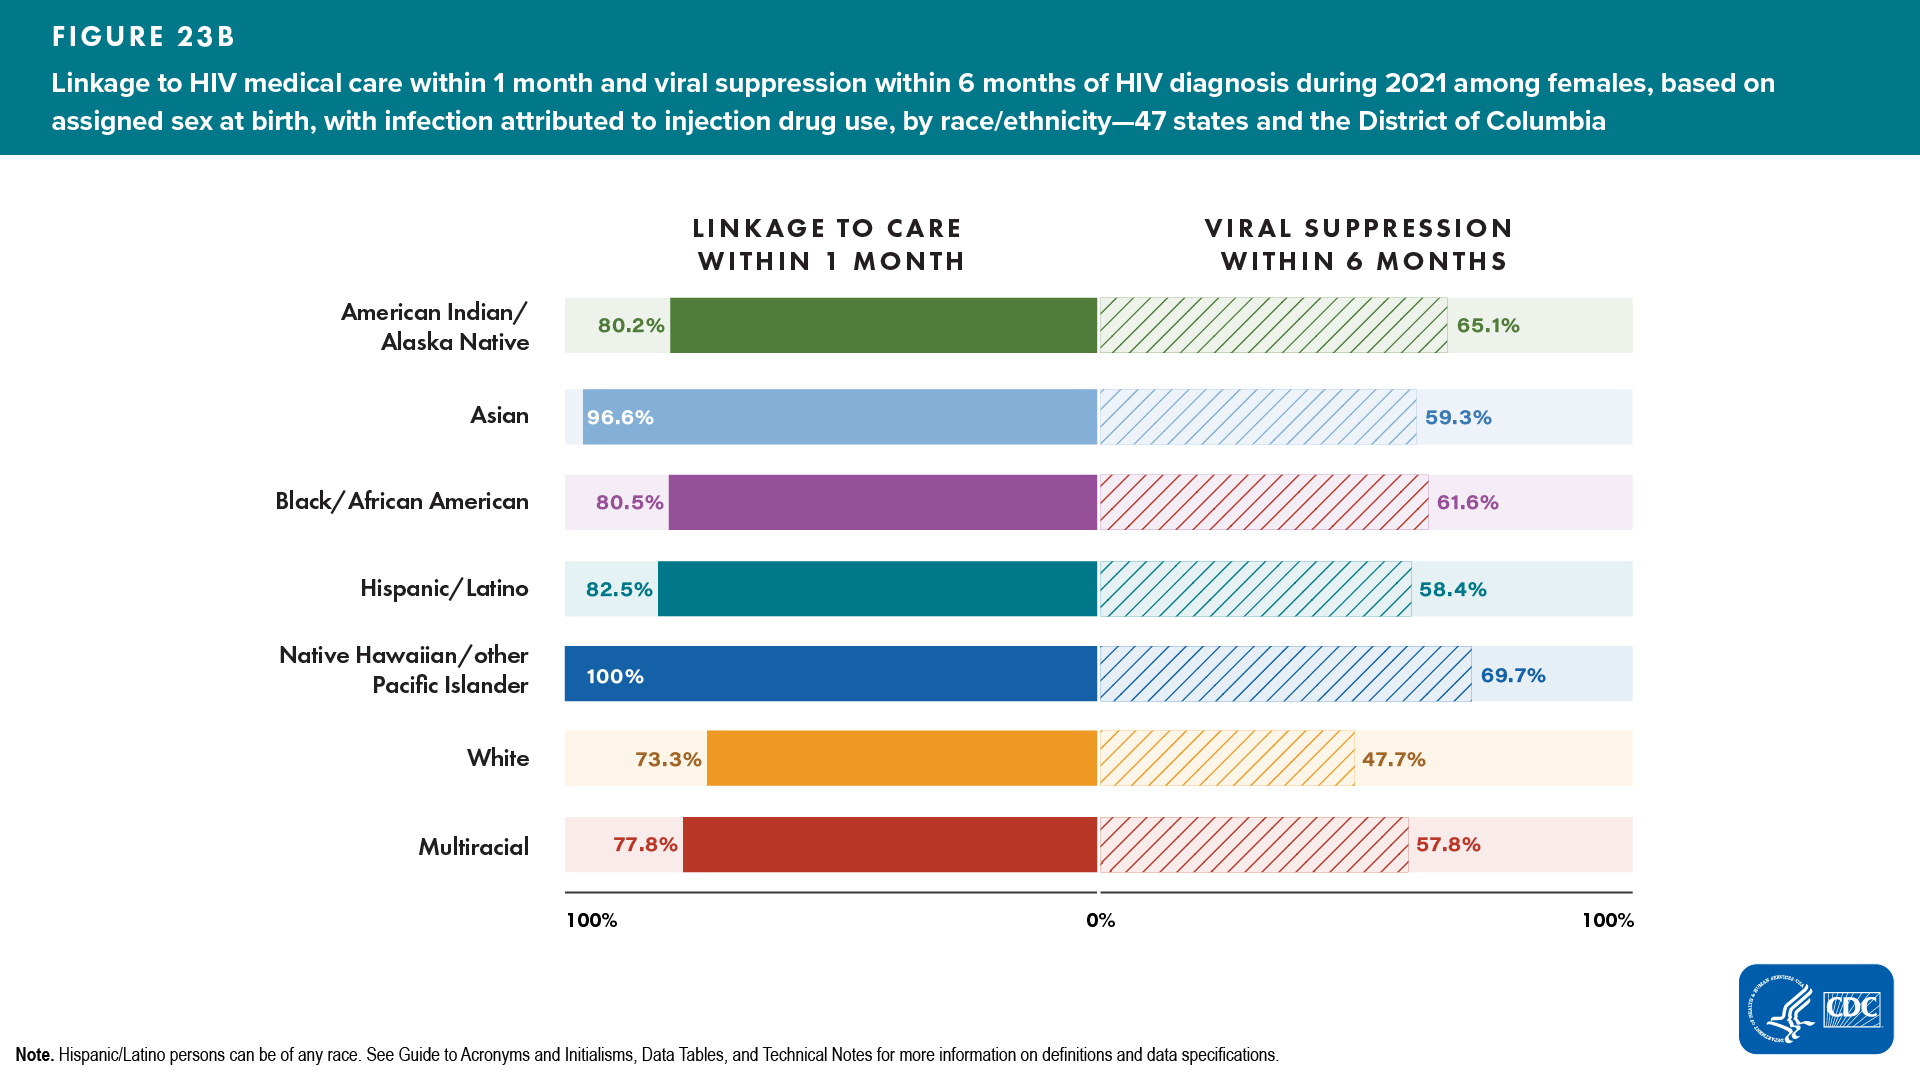
Lowest percentages of linkage to HIV medical care within 1 month of diagnosis and viral suppression within 6 months for persons with infection attributed to IDU, by ASAB and race/ethnicity, were as follows (Figure 23, Table 2c):
- Male PWID
- Linkage to HIV medical care—multiracial (69.5%)
- Viral suppression—multiracial (46.5%)
- Female PWID
- Linkage to HIV medical care—White (73.3%)
- Viral suppression—White (47.7%)
Receipt of HIV medical care and viral suppression among persons with infection attributed to IDU
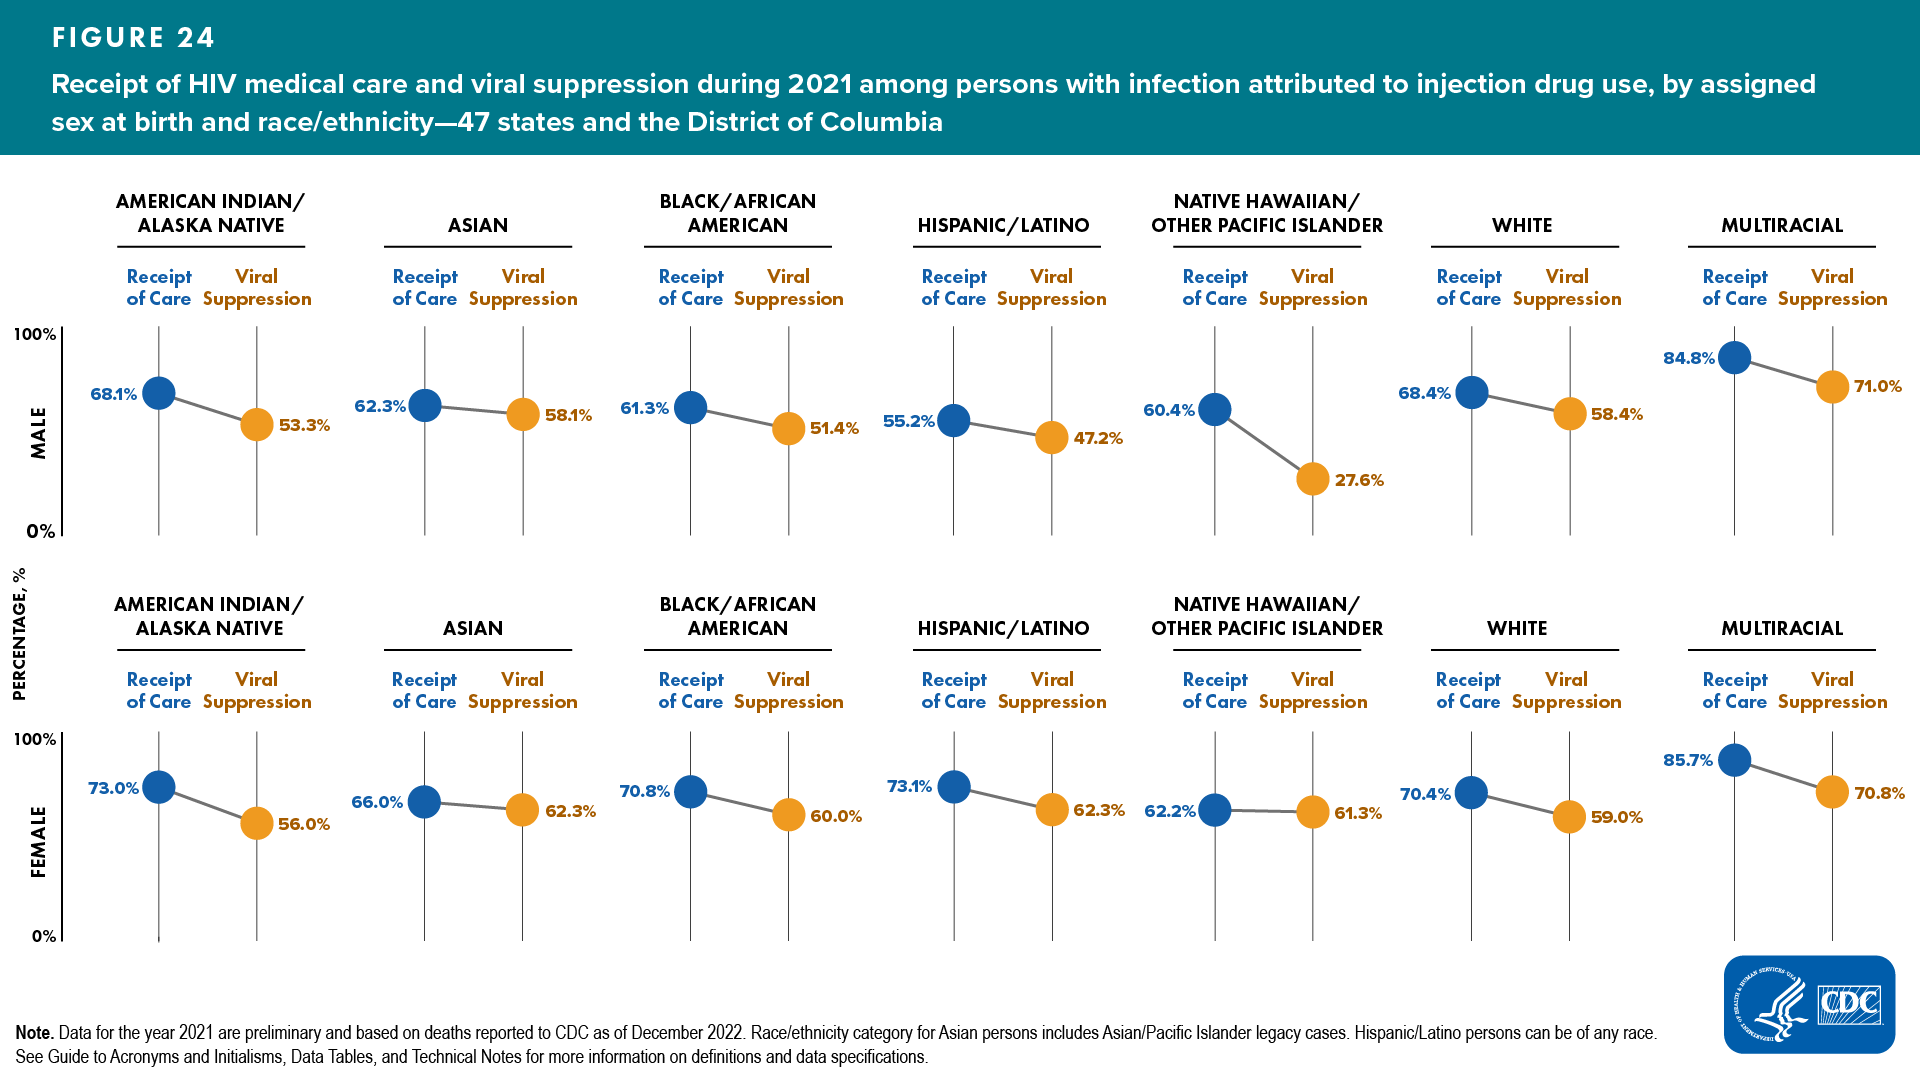
Of 96,246 persons with infection attributed to IDU and living with diagnosed HIV at year-end 2021, 66.3% received HIV medical care and 56.0% had viral suppression at the most recent viral load test (Tables 3a and 4a).
Lowest percentages of receipt of any HIV medical care and viral suppression for persons with infection attributed to IDU, by ASAB and race/ethnicity, were as follows (Figure 24, Table 3c): ![]()
- Male PWID
- Receipt of care—Hispanic/Latino (55.2%)
- Viral suppression—Hispanic/Latino (47.2%)
- Female PWID
- Receipt of care—Native Hawaiian/other Pacific Islander (62.2%)
- Viral suppression—American Indian/Alaska Native (56.0%)
TRANSGENDER AND ADDITIONAL GENDER IDENTITY PERSONS

Transgender is an umbrella term that is used to identify persons whose assigned sex at birth does not match their current gender identity or expression. Gender identity refers to one’s internal understanding of one’s own gender, or the gender with which a person identifies. Additional gender identity (AGI) is a term used to identify persons assigned “male” or “female” sex at birth who do not identify as male, female, transgender woman, or transgender man (e.g., those identifying as “bigender,” “gender queer,” and “two-spirit”). Gender expression is a term used to describe people’s outward presentation of their gender. Gender identity and sexual orientation are different facets of identity. Transgender and AGI persons are understudied in HIV prevention (e.g., PrEP) and treatment interventions and face numerous prevention challenges, including social rejection and exclusion and lack of public/provider knowledge about transgender and AGI issues [5].
In 2021, infections among transgender and AGI persons accounted for 2.6% (911) of 35,716 reported HIV diagnoses in the United States [5].
Stage of disease at time of diagnosis of HIV infection among transgender and AGI persons
In 2021, of 883 transgender and AGI persons with HIV, 42.0% of infections were diagnosed at an earlier stage (stage 0 or 1) compared to 11.6% classified as stage 3 (AIDS) at the time of diagnosis (Table 1e). HIV infections among transgender and AGI persons were diagnosed at an earlier stage (0 or 1) compared to percentages diagnosed at Stage 3 (AIDS) (Table 1e).
Percentages of infections diagnosed at an earlier stage (0 or 1) compared to percentages diagnosed at stage 3 (AIDS), respectively, by gender identity and exposure category, were as follows (Table 1e):
- Among transgender women―41.4% vs 12.0%
- Sexual contact―41.9% vs 11.8%
- Sexual contact and IDU―40.7% vs 11.1%
- Among transgender men―61.8% vs 3.6%
- Sexual contact―63.1% vs 4.3%
- Among AGI persons―27.9% vs 14.0%
- Sexual contact―29.7% vs 13.5%
Linkage to HIV medical care within 1 month and viral suppression within 6 months of diagnosis among transgender and AGI persons
In 2021, of 883 transgender and AGI persons with HIV, 83.9% were linked to HIV medical care and 72.0% had viral suppression within 6 months of diagnosis. Among transgender and AGI persons by gender identity, at least 83% were linked to HIV medical care and 67% had viral suppression within 6 months (Table 2e).
Percentages of linkage to care and viral suppression within 6 months of diagnosis, respectively, among transgender and AGI persons by gender and exposure category were as follows (Table 2e):
- Among transgender women―83.3%, 71.0%
- Sexual contact―84.1%, 73.4%
- Sexual contact and IDU―75.9%, 51.9%
- Among transgender men―92.7%, 90.9%
- Sexual contact―95.7%, 95.7%
- Among AGI persons―83.7%, 67.4%
- Sexual contact―86.5%, 73.0%
Receipt of HIV medical care and viral suppression among transgender and AGI persons
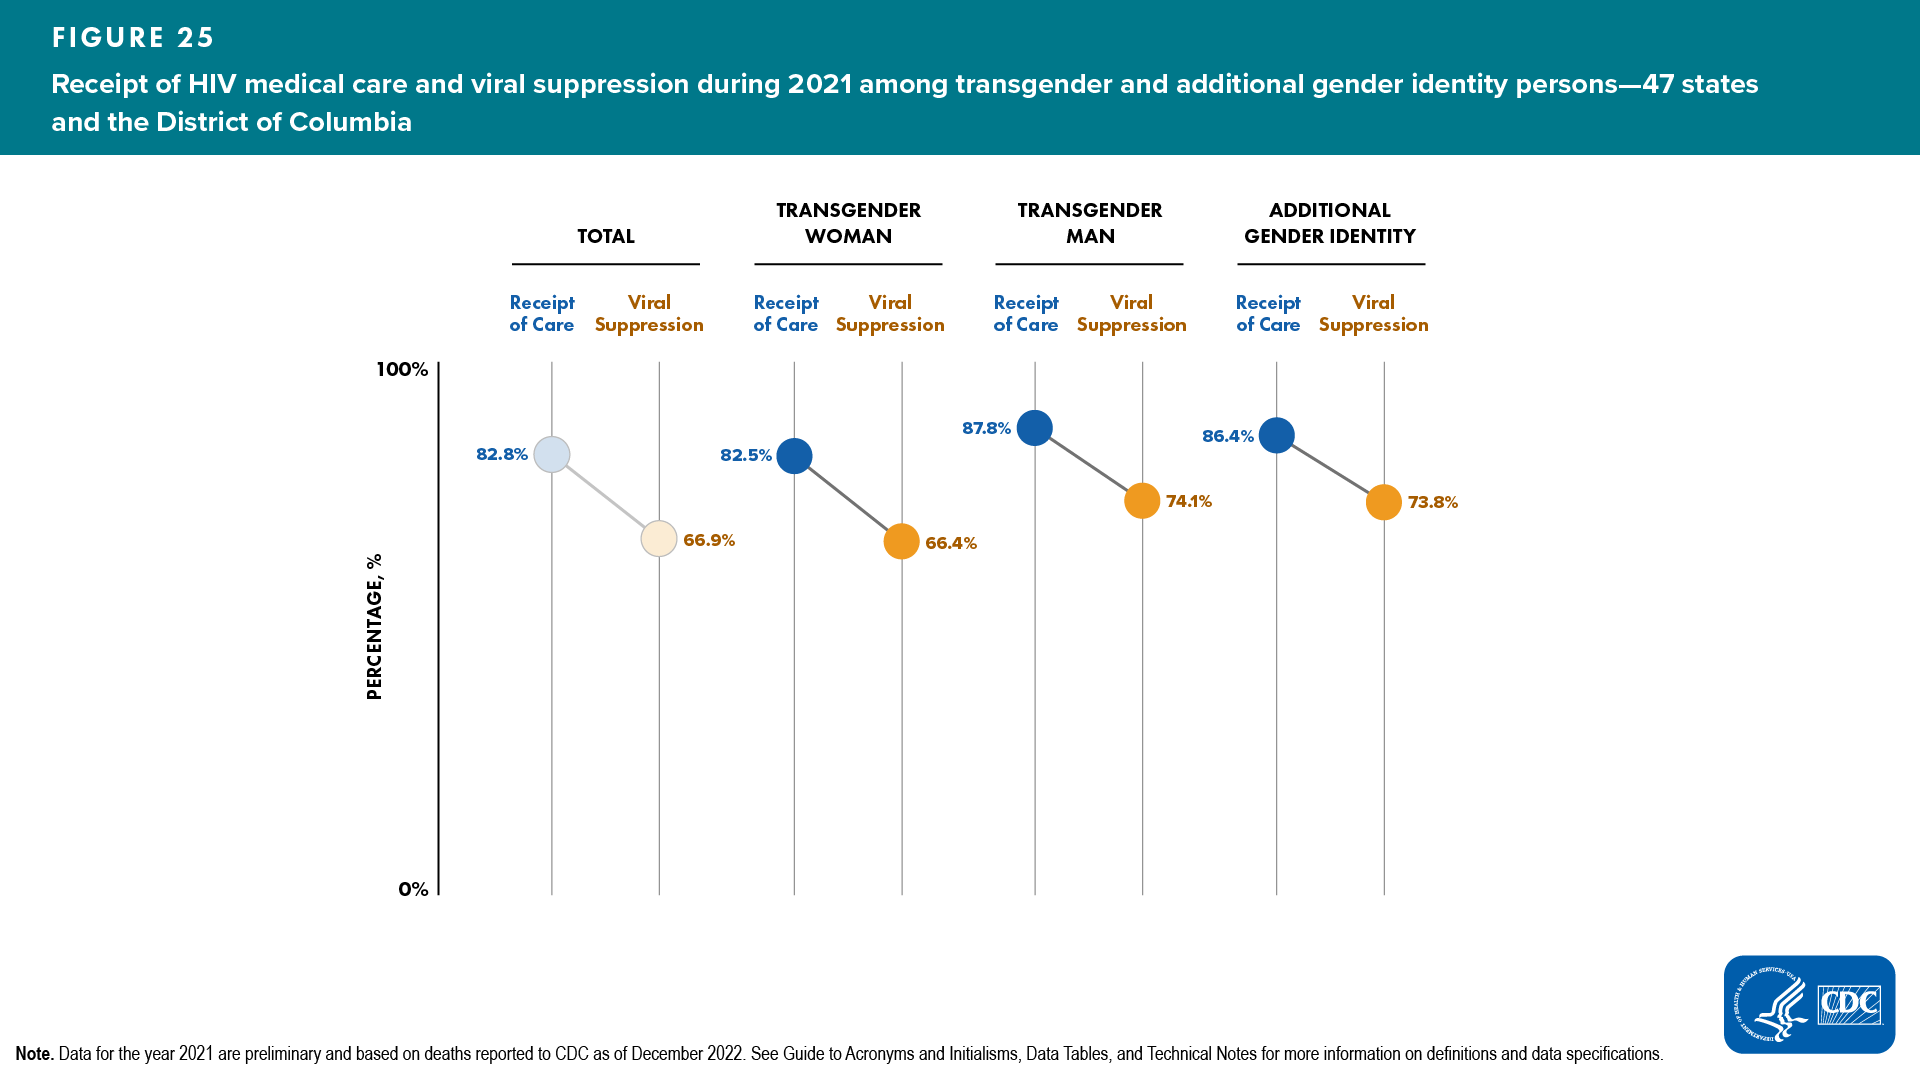
Of 12,475 transgender and AGI persons living with diagnosed HIV at year-end 2021, 82.8% received HIV medical care and 66.9% had viral suppression at their most recent viral load test (Figure 25, Table 3e). Among transgender and AGI persons by gender, at least 82% received HIV medical care and 66% had viral suppression.
Percentages of receipt of any HIV medical care and viral suppression among transgender and AGI persons, by gender identity and exposure category, were as follows (Figure 25, Table 3e):
- Among transgender women―82.5%, 66.4%
- Sexual contact―82.5%, 67.1%
- IDU―76.0%, 48.0%
- Sexual contact and IDU―84.9%, 65.1%
- Among transgender men―87.8%, 74.1%
- Sexual contact―88.0%, 76.8%
- Sexual contact and IDU―90.2%, 57.4%
- Among AGI persons― 86.4%, 73.8%
- Sexual contact―86.8%, 74.0%
- Sexual contact and IDU―92.0%, 76.0%
WOMEN

More than 6,500 women (based on female assigned sex at birth) received an HIV diagnosis in the United States in 2021. One in ten women with HIV are unaware that they have it. Because some women may be unaware of their male partner’s risk factors for HIV (such as injection drug use or having sex with men), they may not use condoms or medicines to prevent HIV. Additionally, PrEP is highly effective for preventing HIV, yet PrEP use among women is very low. Additionally, HIV testing rates within the past year were low among women with sexual behaviors that increase their risk of acquiring HIV, especially among those who reported anal sex [5].
Despite prevention efforts to reduce HIV diagnoses and HIV-related disparities, longstanding health disparities in HIV infection and care outcomes persist among women, especially for women of color, due to social and structural determinants of health. These determinants include systemic racism, poverty, educational attainment, employment, housing insecurity, stigma, discrimination, disadvantaged communities, and disproportionate community levels of sexually transmitted infections (STIs) (including HIV). Unequal access to care and treatment must be addressed to reduce racial/ethnic disparities [5].
In 2021, infection among females accounted for 18.4% of 35,716 reported HIV diagnoses in the United States [5].
Stage of disease at time of diagnosis of HIV infection among females
In 2021, of 6,069 females with HIV, 35.5% of infections were diagnosed at an earlier stage (stage 0 or 1) and 21.1% were classified as stage 3 (AIDS) at the time of diagnosis (Table 1a).
- A higher percentage (33.0%) of Asian females received a late-stage diagnosis compared to the percentage (26.1%) that received an earlier-stage diagnosis (Figure 26, Table 1c)
- Asian, Black/African American, Hispanic/Latino, and multiracial females each had ≥ 20% of infections classified as late stage (stage 3, AIDS) at time of diagnosis (Figure 26, Table 1c)
- Asian: 33.0%, Black/African American: 21.2%, Hispanic/Latino: 21.2%, and multiracial: 24.0%

Linkage to HIV medical care within 1 month and viral suppression within 6 months of diagnosis among females
In 2021, of 6,069 females with HIV, 81.7% were linked to HIV medical care within 1 month and 68.0% had viral suppression within 6 months of diagnosis (Table 2a).
Lowest percentages of linkage to HIV medical care and viral suppression for females, by race/ethnicity, were as follows (Table 2c):
- Linkage to HIV medical care―American Indian/Alaska Native (76.1%)
- Viral suppression―White (61.3%)
Receipt of HIV medical care and viral suppression among females
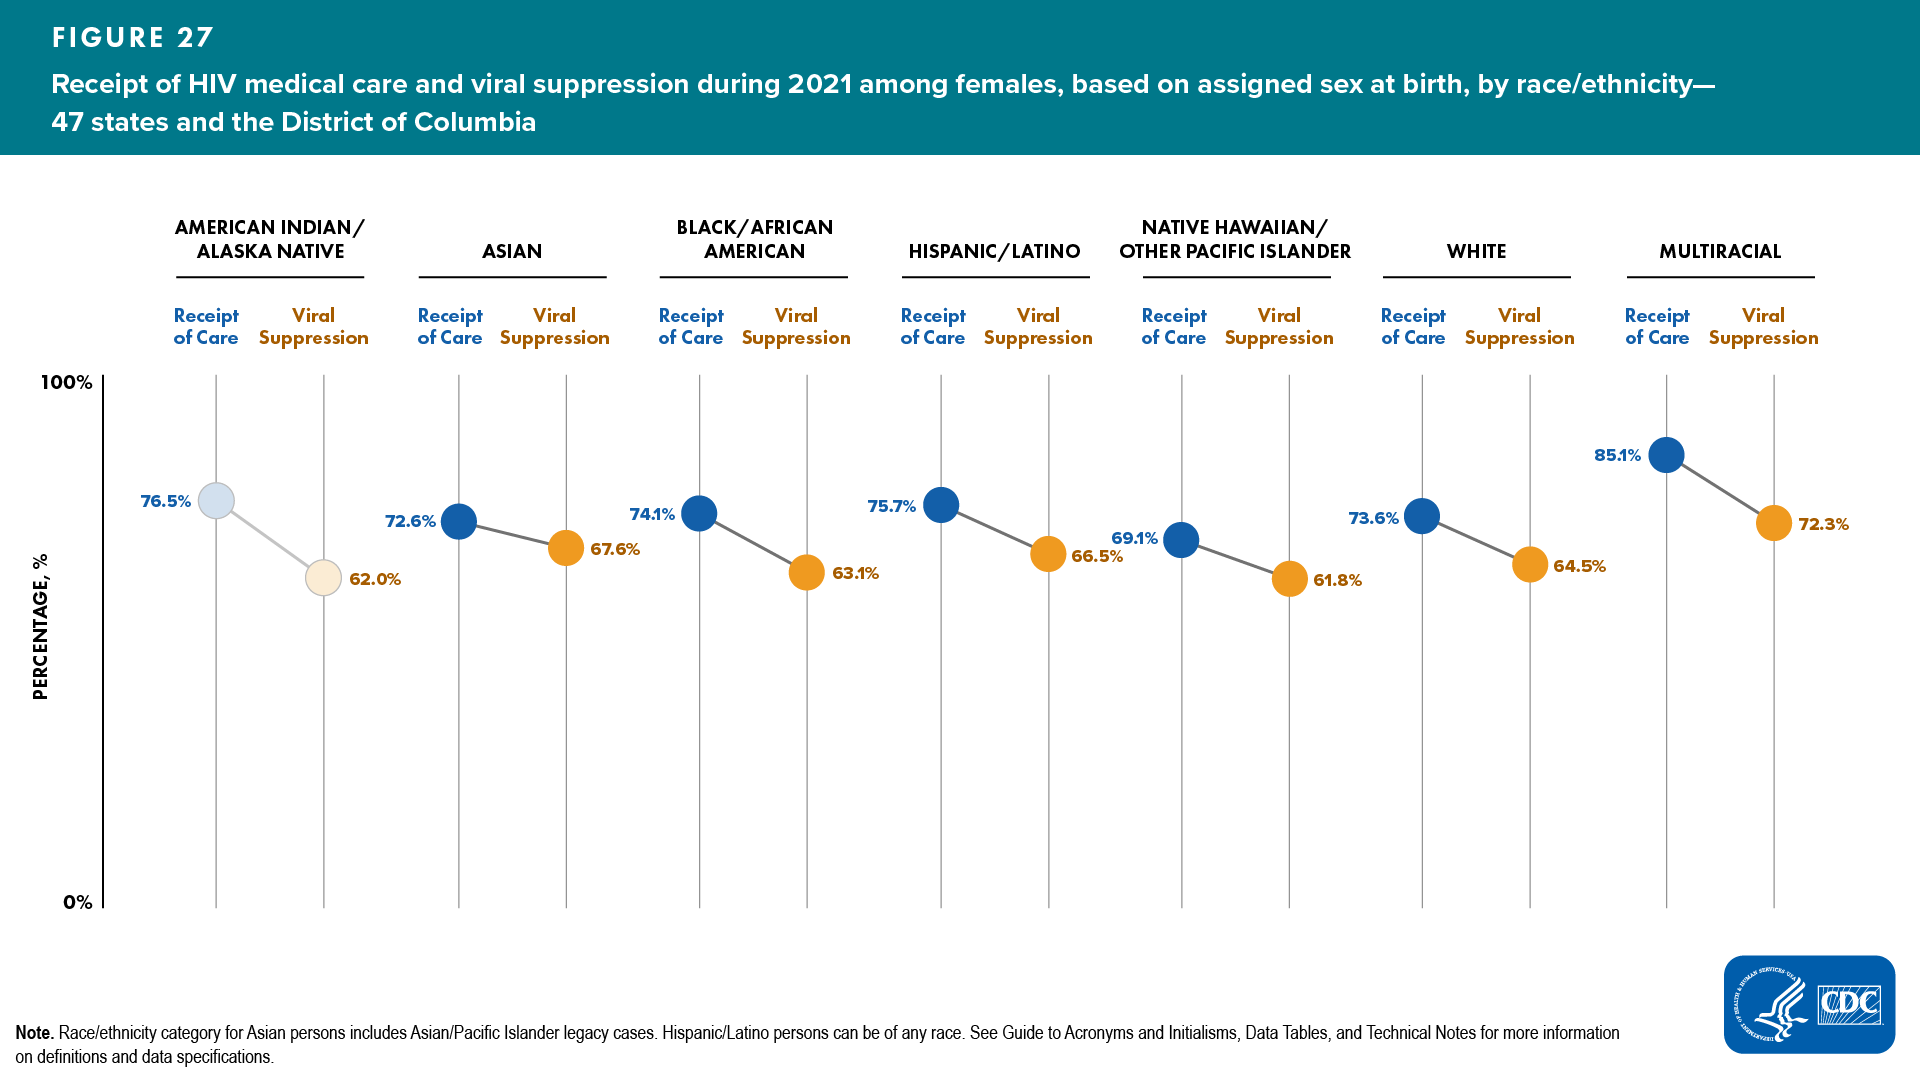
Of 217,656 females living with diagnosed HIV at year-end 2021, 74.8% received HIV medical care and 64.4% had viral suppression at the most recent viral load test (Tables 3a and 4a).
Lowest percentages of receipt of any HIV medical care and viral suppression for females were as follows (Figure 27, Table 3c): ![]()
Race/ethnicity
- Native Hawaiian/other Pacific Islander―69.1% and 61.8%, respectively
Race/ethnicity and age group
- Receipt of care―Native Hawaiian/other Pacific Islander females aged 45–54 years (66.7%)
- Viral suppression―Native Hawaiian/other Pacific Islander females aged 45–54 (60.0%)
PERSONS WITH PERINATALLY ACQUIRED HIV INFECTION

To make informed decisions about antiretroviral therapy to reduce perinatal transmission of HIV to infants, pregnant women should know their HIV infection status. In 1995, the first recommendations for HIV counseling and voluntary testing for pregnant women were published. In 2006, CDC released revised recommendations for HIV testing which specified that opt-out HIV screening should be included in the routine panel of prenatal screening tests for all pregnant women. Because of delays in the reporting to NHSS of births and diagnoses of HIV infection attributed to perinatal exposure, as well as the dynamic nature of surveillance case reporting and investigation, these numbers may be subject to change. Please use caution when interpreting perinatally acquired HIV infection numbers. Additionally, numbers less than 12, and rates based on these numbers, should be interpreted with caution.
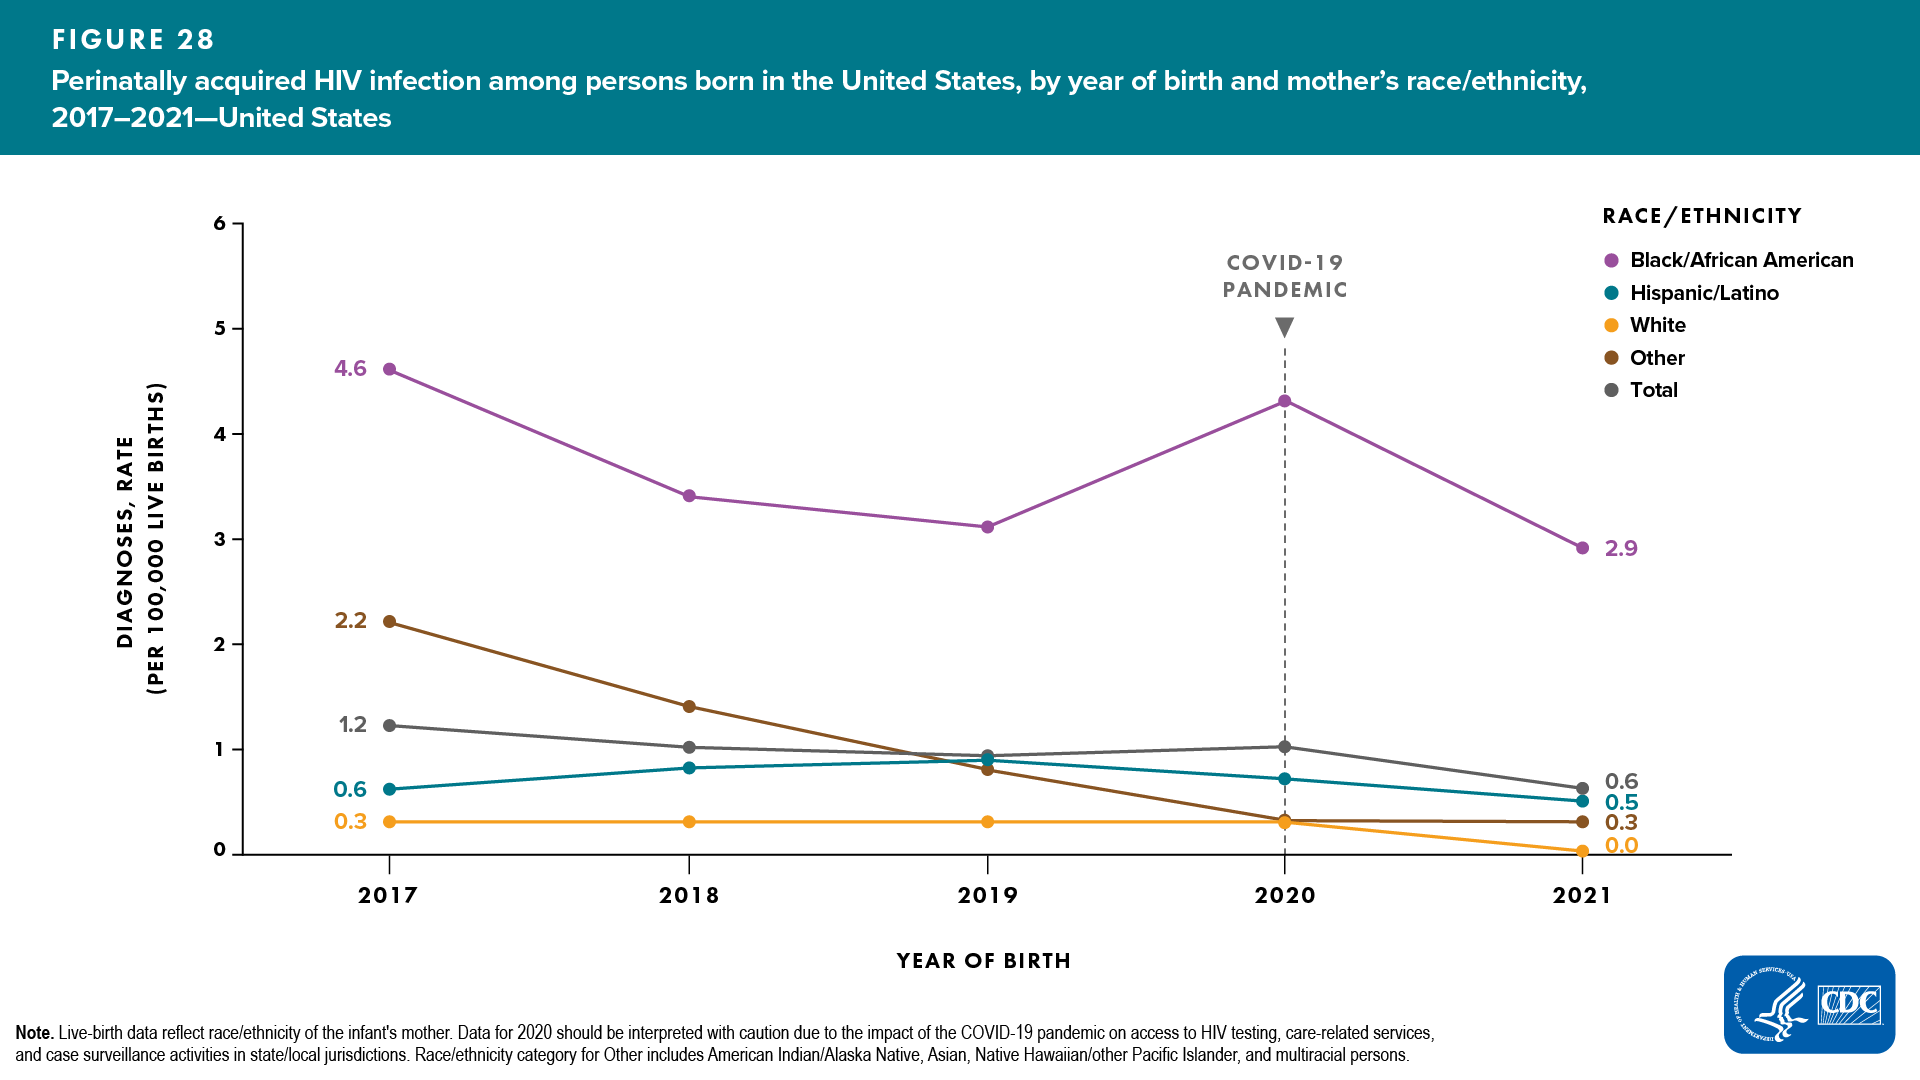
In 2021, the overall annual rate of perinatally acquired HIV infections in the United States was 0.6 per 100,000 live births (regardless of place of birth). The rate among Black/African American persons (3.1) was 5.2 times the annual rate (Table 10a).
Among infants born in 2021, the overall annual rate of perinatally acquired HIV infections in the United States was 0.6. The rate among Black/African American persons (2.9) was 4.8 times the annual rate (Figure 28, Table 10b).
PERSONS AGED 13–24 YEARS

HIV infections among persons aged 13–24 years accounted for 19.4% of reported 35,716 diagnoses of HIV in 2021 in the United States. They are the least likely of any age group to be aware of their HIV infection, be retained in care, or have a suppressed viral load. Lack of awareness of HIV status may be due to recent infection or low rates of HIV testing. Persons who do not know they have HIV do not get medical care or receive treatment and can unknowingly transmit infection to others through sex or any sharing of needle/non-needle injecting equipment. In addition, persons aged 13–24 years have high rates of STIs and low rates of condom use, greatly increasing the chance of getting or transmitting HIV. Addressing HIV among persons aged 13–24 years requires that they have access to the information and tools they need to make healthy decisions, reduce their risk factors, get treatment, and stay in care [5].
Stage of disease at time of diagnosis of HIV infection among young persons aged 13–24 years
In 2021, 36.8% of infections diagnosed at an earlier stage (stage 0 or 1) and 9.9% classified as stage 3 (AIDS) at the time of diagnosis (Table 1a).
Linkage to HIV medical care within 1 month and viral suppression within 6 months of diagnosis among young persons aged 13–24 years
In 2021, 80.2% of young persons with an HIV diagnosis were linked to HIV medical care and 69.9% had viral suppression within 6 months of diagnosis (Table 2a).
Lowest percentages of linkage to HIV medical care and viral suppression among young persons aged 13–24 years by ASAB and race/ethnicity were as follows (Table 2c):
- Linkage to HIV medical care―American Indian/Alaska Native males (76.7%) and multiracial females (73.1%), respectively
- Viral suppression―Black/African American males (67.0%) and White females (64.2%), respectively
Receipt of HIV medical care and viral suppression among young persons aged 13–24 years
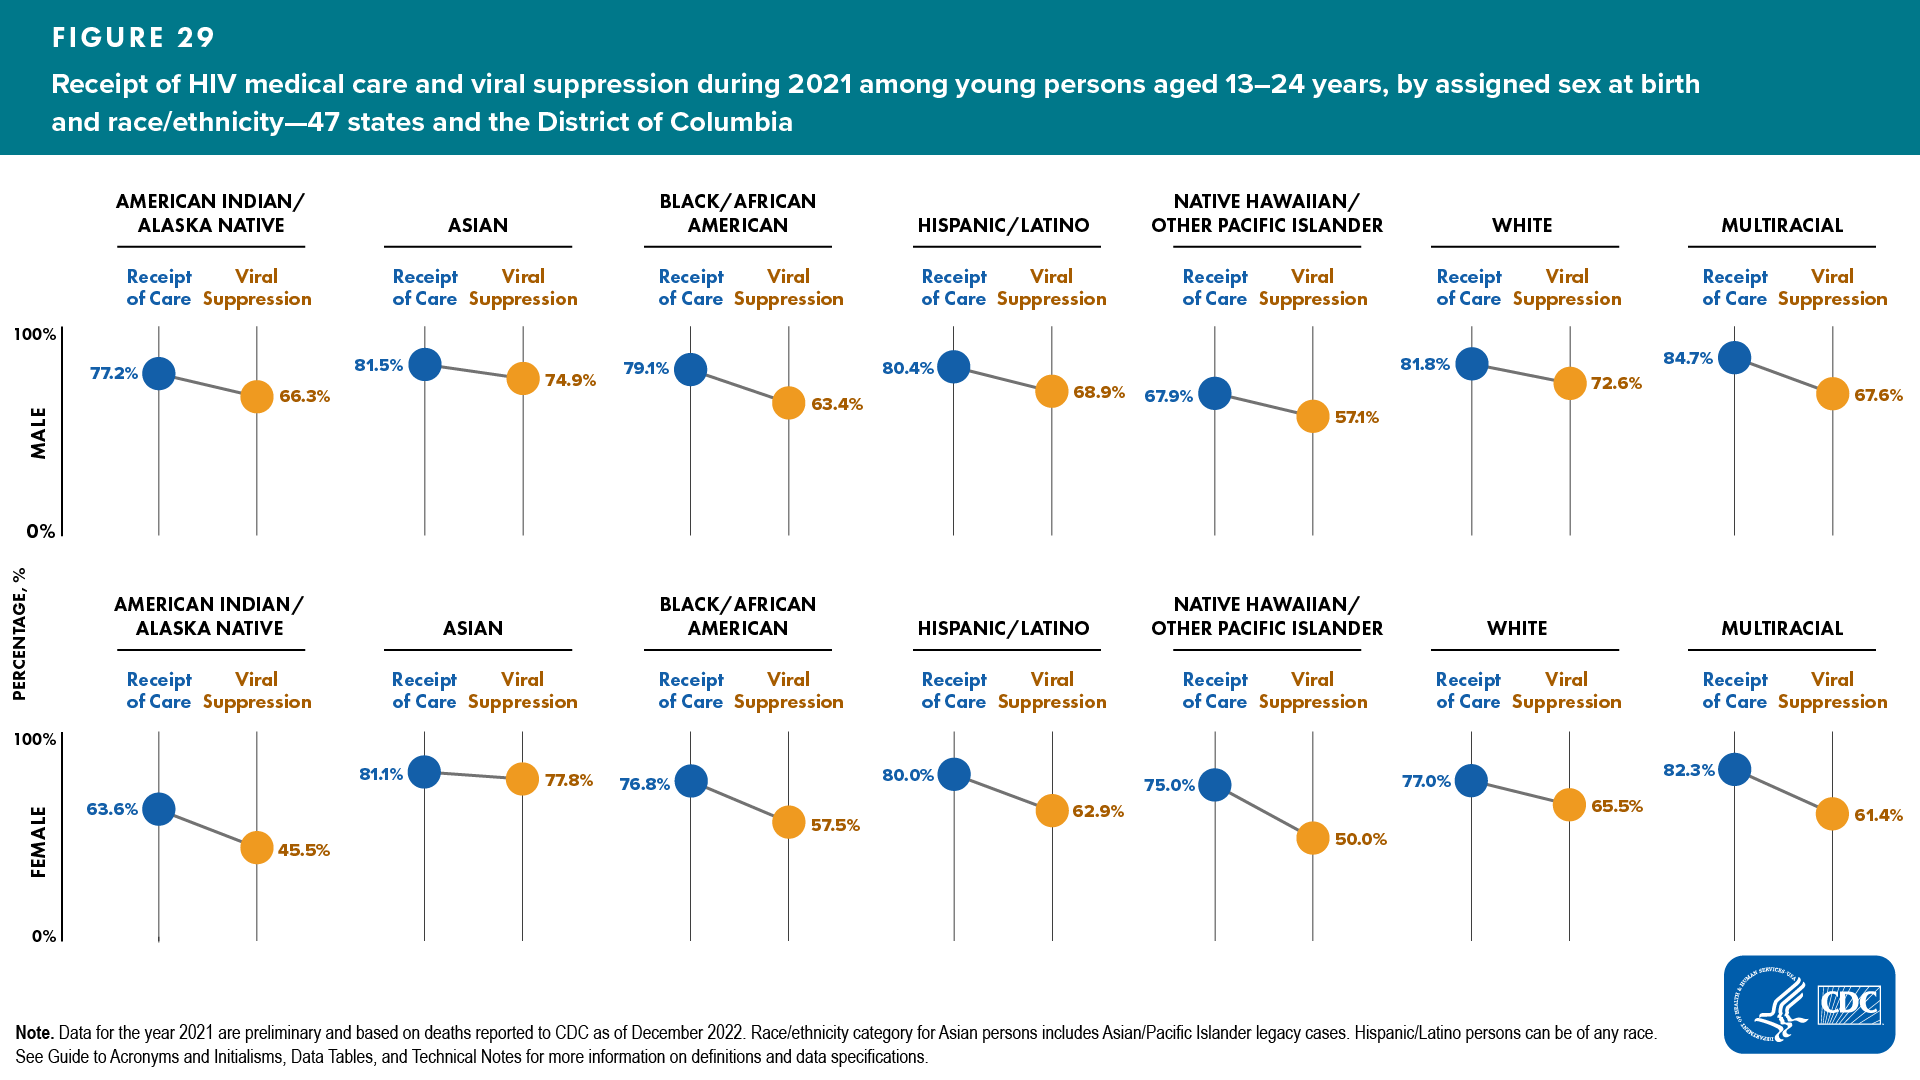
Of 27,140 young persons living with diagnosed HIV at year-end 2021, 79.6% received any HIV medical care and 65.1% had viral suppression at their most recent viral load test (Tables 3a and 4a).
Lowest percentages of receipt of any HIV medical care and viral suppression for young persons aged 13–24 years by assigned sex at birth and race/ethnicity were as follows (Figure 29, Table 3c): ![]()
- Receipt of care―Native Hawaiian/other Pacific males (67.9%) and Black/African American females (76.8%)
- Viral suppression―Native Hawaiian/other Pacific males (57.1%) and Black/African American females (57.5%)
2021 STATUS AND DISPARITIES IN LINKAGE TO CARE, VIRAL SUPPRESSION, AND PREP COVERAGE
Achieving equitable health in HIV-related outcomes can reduce new HIV infections and eliminate HIV-related disparities in the United States consistent with the goals of Healthy People 2030, NHAS, and the EHE initiative. This section presents the status and HIV-related disparities for 3 favorable care outcomes: (1) the percentage of persons with newly diagnosed HIV who were linked to care within 1 month of diagnosis during 2021; (2) the percentage of persons with diagnosed HIV who had viral suppression at the most recent test during 2021; and (3) the percentage of persons with indications for PrEP who were prescribed PrEP during 2021. For NHSS, data for other transmission category were excluded from disparity measure calculations. See Technical Notes for additional information on disparity measures.
2021 Status and Disparities in Linkage to HIV Medical Care Within 1 Month of HIV Diagnosis

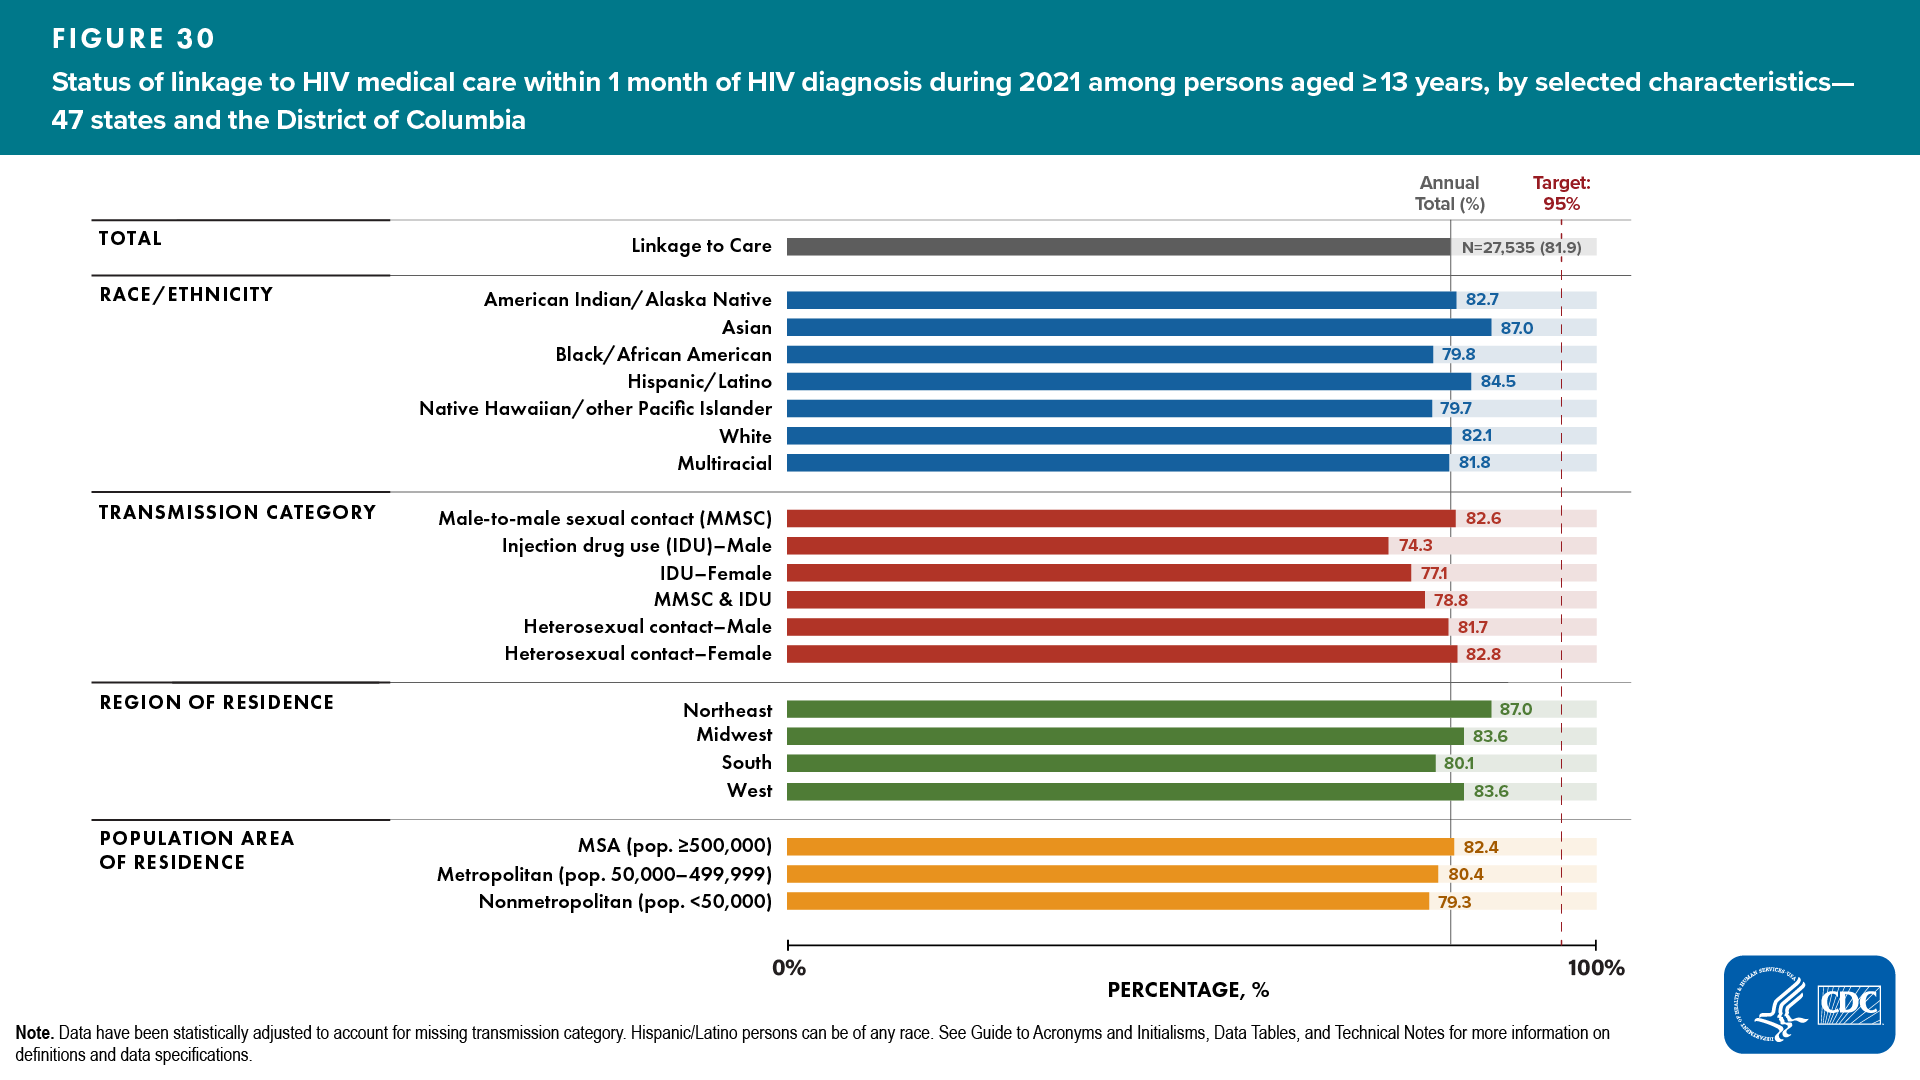
In 2021, 81.9% of persons with an HIV diagnosis were linked to HIV medical care within 1 month of diagnosis (Table 2a). For linkage to HIV medical care, the percentage difference was 13.1% from the 95% target and the percentage ratio was 0.862 times the 95% target. Percentages for linkage to care varied by race/ethnicity, transmission category (ASAB), region of residence, and population area of residence (Figure 30, Table 2a).
Disparities by race/ethnicity, transmission category, and geographic area were as follows:
Disparities by race/ethnicity: The highest linkage to care group percentage was for Asian persons (87.0%), and the lowest linkage to care group percentage was for Native Hawaiian/other Pacific Islander persons (79.7%) (Figure 30, Table 2a). The average of the percentages of all other racial/ethnic groups (excluding the percentage for Asian persons) was 81.8%.
-
Absolute disparities
- Absolute (maximal) percentage difference: Asian persons were the closest to the target (8.0%) and had a group percentage higher than the overall linkage to care outcome of 81.9%.
Native Hawaiian/other Pacific Islander persons were the farthest from the target (15.3%) and had a group percentage lower than the overall linkage to care outcome.The percentage difference between the percentage for Asian persons and Native Hawaiian/other Pacific Islander persons was 7.3%. The percentage difference between the percentage for Asian persons and the average of the percentages of all other racial/ethnic groups was 5.2%.
- Absolute (maximal) percentage difference: Asian persons were the closest to the target (8.0%) and had a group percentage higher than the overall linkage to care outcome of 81.9%.
-
Relative disparities
- Summary percentage ratio: The percentages for Asian and Native Hawaiian/other Pacific Islander persons were 0.916 and 0.839 times the 95% target, respectively. The average percentage of all other racial/ethnic groups was 0.940 times the percentage for Asian persons.
- Maximal percentage ratio: The percentage for Asian persons was 1.092 times the percentage for Native Hawaiian/other Pacific Islander persons.
Disparities by transmission category (ASAB): The highest linkage to care group percentage was for females with infection attributed to heterosexual contact (82.8%) and the lowest linkage to care group percentage was among males with infection attributed to IDU (74.3%) (Figure 30, Table 2a). The average of the percentages of all other transmission categories (excluding the percentage for females with infection attributed to heterosexual contact) was 78.9%.
-
Absolute disparities
- Absolute (maximal) percentage difference: Females with infection attributed to heterosexual contact were the closest to the target (12.2%) and had a group percentage higher than the overall linkage to care outcome of 81.9%.
Males with infection attributed to IDU were the farthest from the target (20.7%) and had a group percentage lower than the overall linkage to care outcome.The percentage difference between the percentage for females with infection attributed to heterosexual contact and for males with infection attributed to IDU was 8.5%. The percentage difference between the percentage for females with infection attributed to heterosexual contact and the average of the percentages of all other transmission categories was 3.9%.
- Absolute (maximal) percentage difference: Females with infection attributed to heterosexual contact were the closest to the target (12.2%) and had a group percentage higher than the overall linkage to care outcome of 81.9%.
-
Relative disparities
- Summary percentage ratio: The percentages for females with infection attributed to heterosexual contact and males with infection attributed to IDU were 0.872 and 0.782 times the 95% target, respectively. The average percentage for all other transmission categories was 0.952 times the percentage for females with infection attributed to heterosexual contact.
- Maximal percentage ratio: The percentage for females with infection attributed to heterosexual contact was 1.114 times the percentage for males with infection attributed to IDU.
Disparities by region of residence: The highest linkage to care group percentage was for persons who resided in the Northeast (87.0%) and the lowest linkage to care group percentage was for persons who resided in the South (80.1%) (Figure 30, Table 2b). The average of the percentages of all other regions (excluding the percentage for persons who resided in the Northeast) was 82.4%.
-
Absolute disparities
- Absolute (maximal) percentage difference: Persons who resided in the Northeast were the closest to the target (8.0%) and had a group percentage higher than the overall linkage to care outcome of 81.9%.
Persons who resided in the South were the farthest from the target (14.9%) and had a group percentage lower than the overall linkage to care outcome.
- Absolute (maximal) percentage difference: Persons who resided in the Northeast were the closest to the target (8.0%) and had a group percentage higher than the overall linkage to care outcome of 81.9%.
-
Relative disparities
- Summary percentage ratio: The percentages for persons who resided in the Northeast and in the South were 0.916 and 0.843 times the 95% target, respectively. The average percentage of all other geographic areas was 0.947 times the percentage for persons who resided in the Northeast.
- Maximal percentage ratio: The percentage for persons who resided in the Northeast was 1.086 times the percentage for persons who resided in the South.
Disparities by population area of residence: Although linkage to care was similar for all geographic areas, the highest linkage to care group percentage was for persons who resided in metropolitan statistical areas (MSA, 82.4%) and the lowest linkage to care group percentage was for persons who resided in nonmetropolitan areas (79.3%) (Figure 30, Table 2a). The average of the percentages of all other geographic areas (excluding the percentage for persons who resided in the MSAs) was 79.9%.
-
Absolute disparities
- Absolute (maximal) percentage difference: Persons who resided in MSAs were the closest to the target (12.6%) and had a group percentage higher than the overall linkage to care outcome of 81.9%.
Persons who resided in nonmetropolitan areas were the farthest from the target (15.7%) and had a group percentage lower than the overall linkage to care outcome.The percentage difference between the percentages for persons who resided in MSAs and for persons who resided in nonmetropolitan areas was 3.1%. The percentage difference between the percentage for persons who resided in the MSAs and the average of the percentages of all other geographic areas was 2.5%.
- Absolute (maximal) percentage difference: Persons who resided in MSAs were the closest to the target (12.6%) and had a group percentage higher than the overall linkage to care outcome of 81.9%.
-
Relative disparities
- Summary percentage ratio: The percentages for persons who resided in the MSAs and in nonmetropolitan areas were 0.867 and 0.835 times the 95% target, respectively. The average percentage of all other geographic areas was 0.970 times the percentage for persons who resided in MSAs.
- Maximal percentage ratio: The percentage for persons who resided in the MSAs was 1.039 times the percentage for persons who resided in nonmetropolitan areas.
2021 Status and Disparities in Viral Suppression

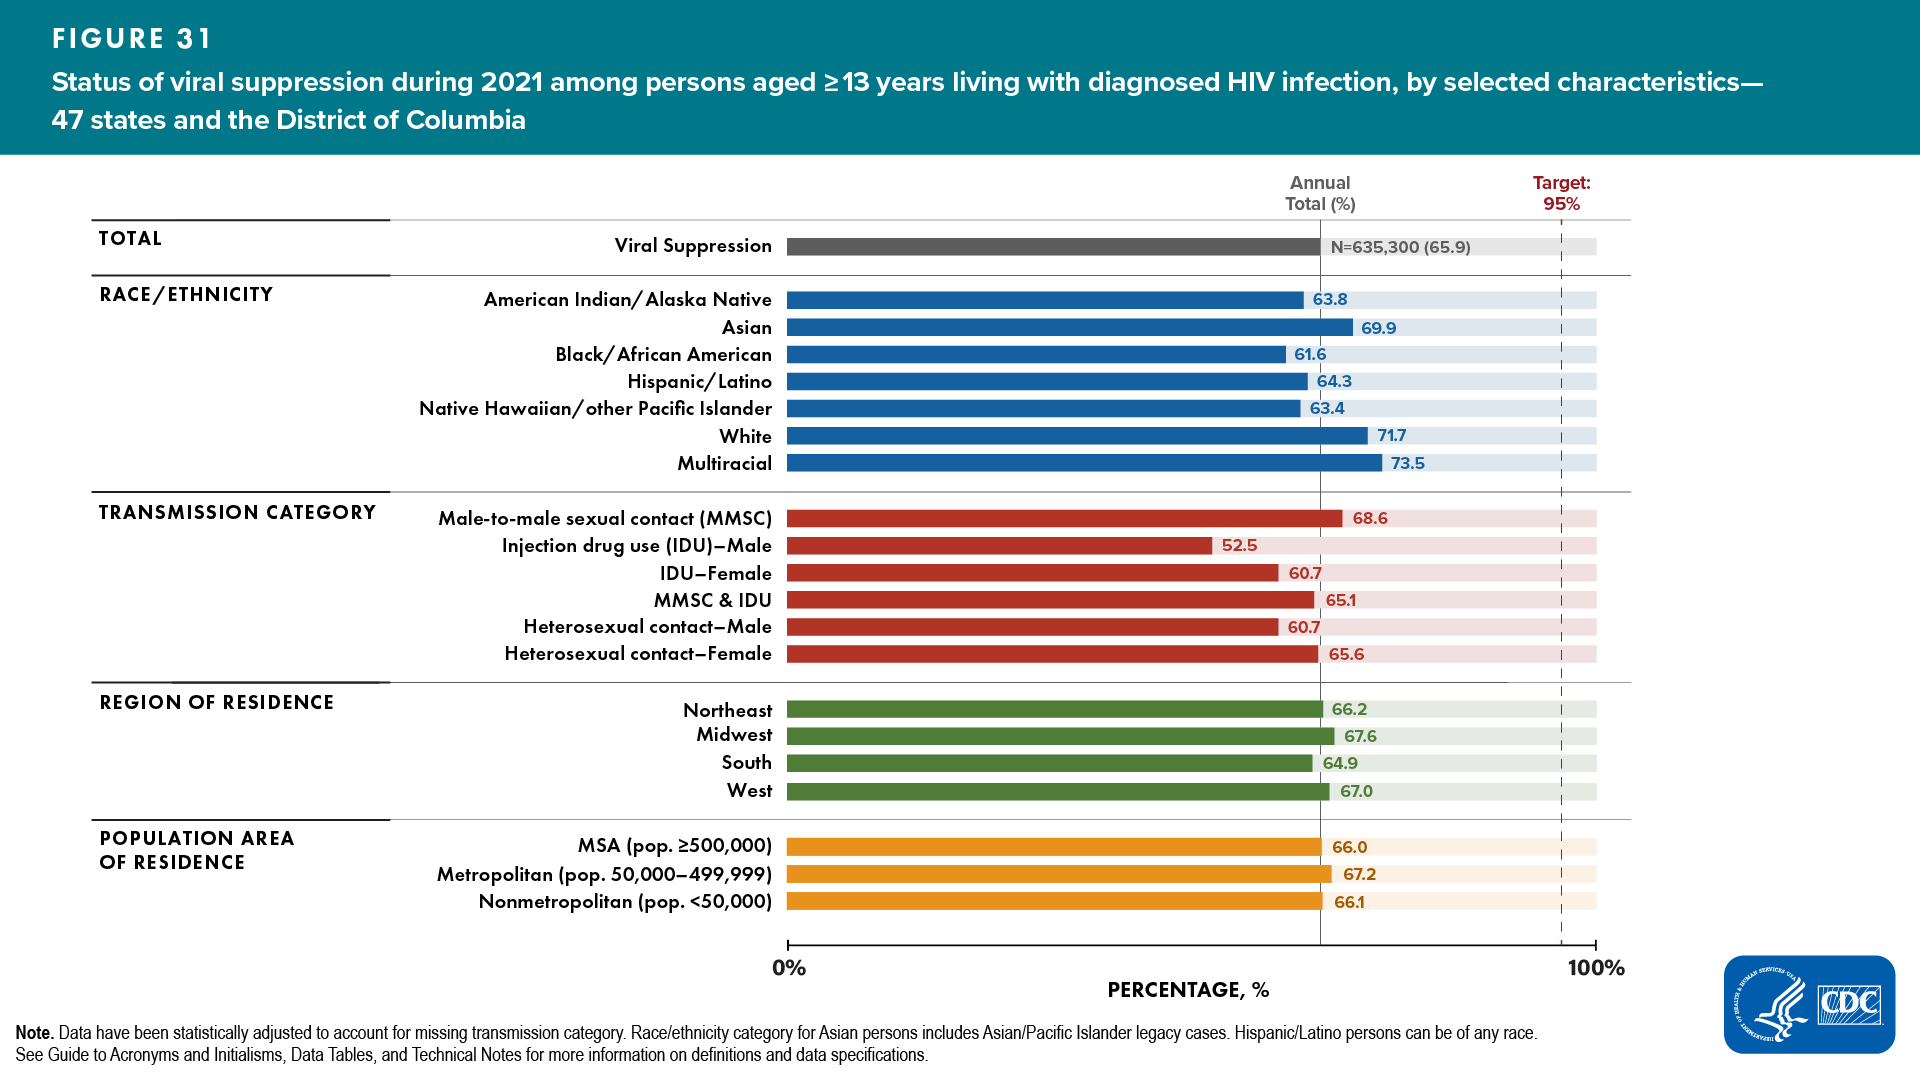
During 2021, 65.9% of persons living with diagnosed HIV infection at year-end had viral suppression at the most recent viral load test (Table 4a). For viral suppression, the percentage difference was 29.1% from the 95% target and the percentage ratio was 0.694 times the 95% target. Percentages for viral suppression varied by race/ethnicity, transmission category (ASAB), region of residence, and population area of residence (Figure 31, Table 4a).
Disparities by race/ethnicity, transmission category, and geographic area were as follows:
Disparities by race/ethnicity: The highest viral suppression group percentage was for multiracial persons (73.5%) and the lowest viral suppression group percentage was for Black/African American persons (61.6%) (Figure 31, Table 4a). The average of the percentage of all other racial/ethnic groups (excluding the percentage for multiracial persons) was 65.8%.
-
Absolute disparities
- Absolute (maximal) percentage difference: Multiracial persons were the closest to the target (21.5%) and had a group percentage higher than the overall viral suppression outcome of 65.9%.
Black/African American persons were the farthest from the target (33.4%) and had a group percentage lower than the overall viral suppression outcome.The percentage difference between the percentage for multiracial persons and for Black/African American persons was 11.9%. The percentage difference between the percentage for multiracial persons and the average of the percentage for all other racial/ethnic groups was 7.7%.
- Absolute (maximal) percentage difference: Multiracial persons were the closest to the target (21.5%) and had a group percentage higher than the overall viral suppression outcome of 65.9%.
-
Relative disparities
- Summary percentage ratio: The percentages for multiracial and Black/African American persons were 0.774 and 0.648 times the 95% target, respectively. The average percentage of all other racial/ethnic groups was 0.895 times the percentage for multiracial persons.
- Maximal percentage ratio: The percentage for multiracial persons was 1.193 times the percentage for Black/African American persons.
Disparities by transmission category (ASAB): The highest viral suppression group percentage was for males with infection attributed to MMSC (68.6%) and the lowest viral suppression group percentage was for males with infection attributed to IDU (52.5%) (Figure 31, Table 4a). The average of the percentages of all other transmission categories (excluding the percentage for males with infection attributed to MMSC) was 60.9%.
-
Absolute disparities
- Absolute (maximal) percentage difference: Males with infection attributed to MMSC were the closest to the target (26.4%) and had a group percentage higher than the overall viral suppression outcome of 65.9%.
Males with infection attributed to IDU were the farthest from the target (42.5%) and had a group percentage lower than the overall viral suppression outcome.The percentage difference between the percentages for males with infection attributed to MMSC and for males with infection attributed to IDU was 16.1%. The percentage difference between the percentage for males with infection attributed to MMSC and the average of the percentages of all other transmission categories was 7.7%.
- Absolute (maximal) percentage difference: Males with infection attributed to MMSC were the closest to the target (26.4%) and had a group percentage higher than the overall viral suppression outcome of 65.9%.
-
Relative disparities
- Summary percentage ratio: The percentages for males with infection attributed to MMSC and males with infection attributed to IDU were 0.722 and 0.553 times the 95% target, respectively. The average percentage of all other transmission categories was 0.888 times the percentage for males with infection attributed to MMSC.
- Maximal percentage ratio: The percentage for males with infection attributed to MMSC was 1.307 times the percentage for males with infection attributed to IDU.
Disparities by region of residence: The highest viral suppression group percentage was for persons who resided in the Midwest (67.6%) and the lowest viral suppression group percentage was for persons who resided in the South (64.9%) (Figure 31, Table 4b). The average of the percentages of all other regions (excluding the percentage for persons who resided in the Midwest) was 66.0%.
-
Absolute disparities
- Absolute (maximal) percentage difference: Persons who resided in the Midwest were the closest to the target (27.4%) and had a group percentage higher than the overall viral suppression outcome of 65.9%.
Persons who resided in the South were the farthest from the target (30.1%) and had a group percentage lower than the overall viral suppression outcome.The percentage difference between the percentages for persons who resided in the Midwest and for persons who resided in the South was 2.7%. The percentage difference between the percentage for persons who resided in the Midwest and the average of the percentages of all other regions was 1.6%.
- Absolute (maximal) percentage difference: Persons who resided in the Midwest were the closest to the target (27.4%) and had a group percentage higher than the overall viral suppression outcome of 65.9%.
-
Relative disparities
- Summary percentage ratio: The percentages for persons who resided in the Midwest and in the South were 0.712 and 0.683 times the 95% target, respectively. The average percentage of all other geographic areas was 0.976 times the percentage for persons who resided in the Midwest.
- Maximal percentage ratio: The percentage for persons who resided in the Midwest was 1.042 times the percentage for persons who resided in the South.
Disparities by population area of residence: Although viral suppression was similar for all geographic areas, the highest viral suppression group percentage was for persons who resided in metropolitan areas (67.2%) and the lowest viral suppression group percentage was for persons who resided in the MSAs (66.0%) (Figure 31, Table 4a). The average of the percentages of all other geographic areas (excluding the percentage who resided in metropolitan areas) was 66.1%.
-
Absolute disparities
- Absolute (maximal) percentage difference: Persons who resided in metropolitan areas were the closest to the target (27.8%) and had a group percentage higher than the overall viral suppression outcome of 65.9%.
Persons who resided in the MSAs were the farthest from the target (29.0%) but had a group percentage higher than the overall viral suppression outcome.The percentage difference between the percentages for persons who resided in metropolitan and MSAs was 1.2%. The percentage difference between the percentages for persons who resided in metropolitan and in all other geographic areas was 1.1%.
- Absolute (maximal) percentage difference: Persons who resided in metropolitan areas were the closest to the target (27.8%) and had a group percentage higher than the overall viral suppression outcome of 65.9%.
-
Relative disparities
- Summary percentage ratio: The percentages for persons who resided in metropolitan areas and in the MSAs were 0.707 and 0.695 times the 95% target, respectively. The average percentage of all other geographic areas was 0.984 times the percentage for persons who resided in metropolitan areas.
- Maximal percentage ratio: The percentage for persons who resided in metropolitan areas was 1.018 times the percentage for persons who resided in the MSAs.
2021 Status and Disparities in PrEP Coverage

During 2021, 30.1% of an estimated 1,216,210 persons aged ≥ 16 years with indications, or eligible, for PrEP were prescribed PrEP (Figure 32, Table 9a). For overall PrEP coverage in 2021, the percentage difference was 19.9% from the 50% target and the percentage ratio was 0.602 times the 50% target.

Disparities by race/ethnicity and assigned sex at birth were as follows:
Disparities by race/ethnicity: The highest PrEP coverage group percentage was for White persons (77.9%), and the lowest PrEP coverage group percentage was for Black/African American persons (11.1%) (Figure 32, Table 9a). The average of the percentages of all other racial/ethnic groups (excluding the percentage for White persons) was 14.5%.
-
Absolute disparities
- Absolute (maximal) percentage difference: White persons had a group percentage that exceeded the overall PrEP coverage target of 50% (27.9%).
Black/African American persons were the farthest from the target (38.9%) and had a group percentage lower than the overall PrEP coverage outcome.The percentage difference between the percentage for White and for Black/African American persons was 66.8%. The percentage difference between the percentage for White persons and the average of the percentages of all other racial/ethnic groups was 63.4%.
- Absolute (maximal) percentage difference: White persons had a group percentage that exceeded the overall PrEP coverage target of 50% (27.9%).
-
Relative disparities
- Summary percentage ratio: The percentages for White and Black/African American persons were 1.558 and 0.222 times the 50% target, respectively. The average percentage of all other racial/ethnic groups was 0.186 times the percentage for White persons.
- Maximal percentage ratio: The percentage for White persons was 7.018 times the percentage for Black/African American persons.
Pairwise Disparities by ASAB: The highest PrEP coverage group percentage was for males (34.1%) and the lowest PrEP coverage group percentage was for females (12.3%) (Figure 32, Table 9a).
-
Absolute disparity
- Absolute (maximal) percentage difference: Males were the closest to the target (15.9%) and had a group percentage lower than the overall PrEP coverage outcome of 50.0%.
Females were the farthest from the target (37.7%) and had a group percentage lower than the overall PrEP coverage outcome.The absolute percentage difference between the percentages for males and for females was 21.8%.
- Absolute (maximal) percentage difference: Males were the closest to the target (15.9%) and had a group percentage lower than the overall PrEP coverage outcome of 50.0%.
-
Relative disparity
- Summary percentage ratio: The percentages for males and females were 0.682 and 0.246 times the 50% target, respectively.
- Maximal percentage ratio: The percentage for males was 2.77 times the percentage for females.