Monitoring Selected National HIV Prevention and Care Objectives By Using HIV Surveillance Data United States and 6 Dependent Areas, 2020: Figures

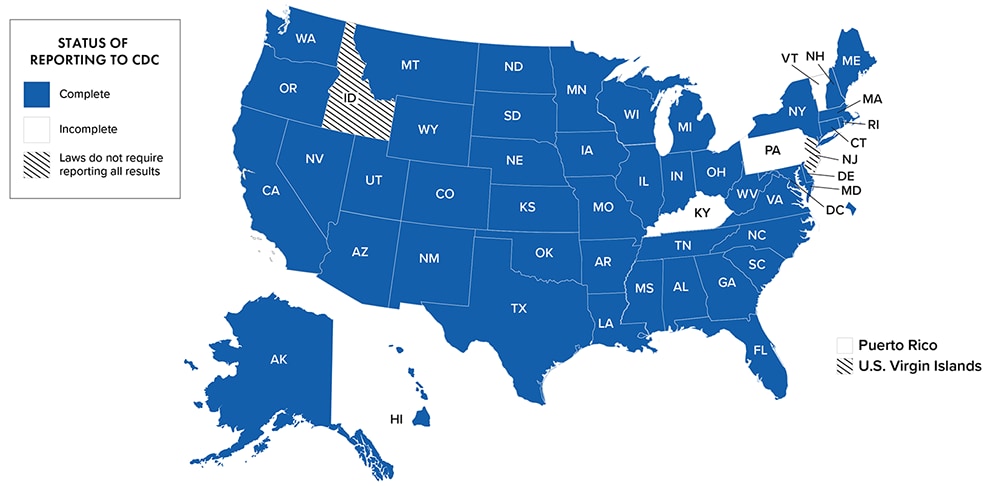
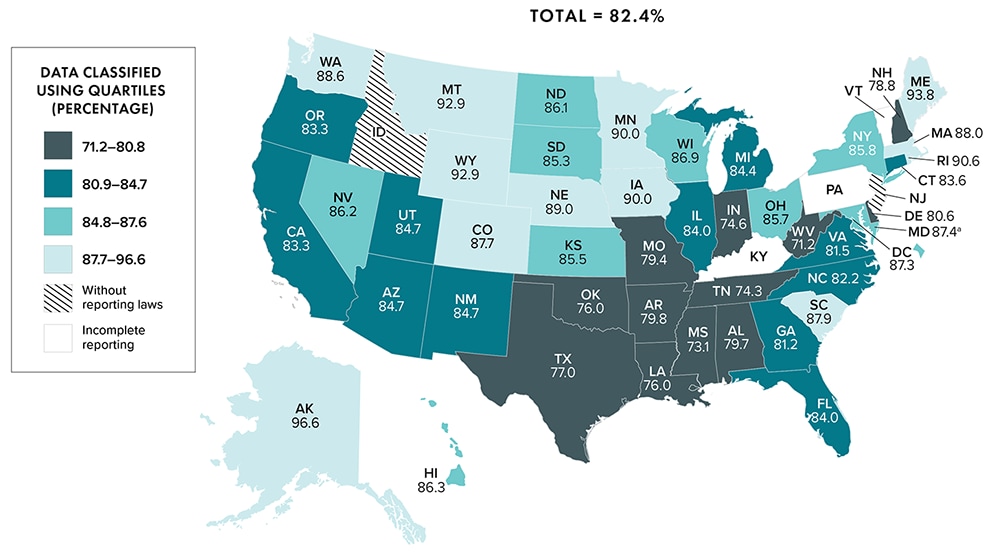
Note. Data for 2020 should be interpreted with caution due to the impact of the COVID-19 pandemic on access to HIV testing, care-related services, and case surveillance activities in state/local jurisdictions. See Technical Notes for more information on areas with complete laboratory reporting.
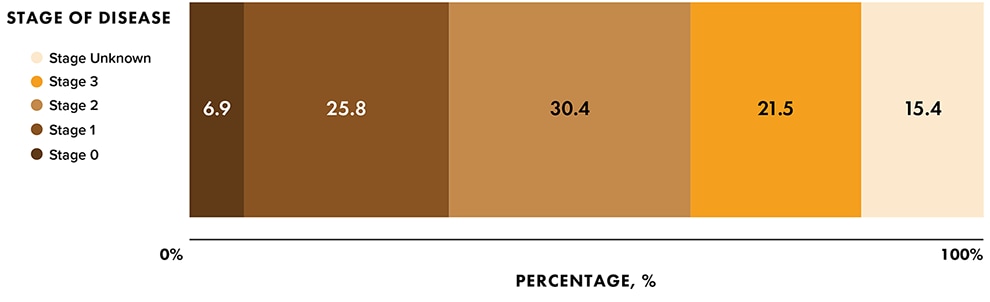
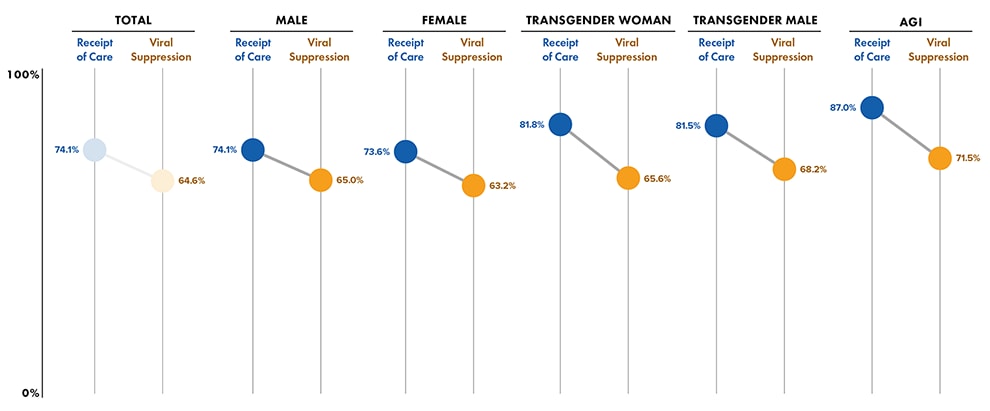
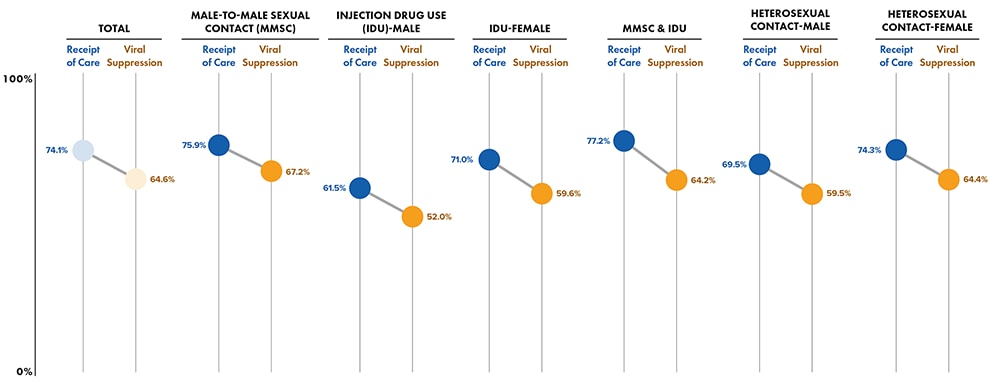
Note. Data for 2020 should be interpreted with caution due to the impact of the COVID-19 pandemic on access to HIV testing, care-related services, and case surveillance activities in state/local jurisdictions. See Guide to Acronyms and Initialisms, Data Tables, and Technical Notes for more information on definitions and data specifications.
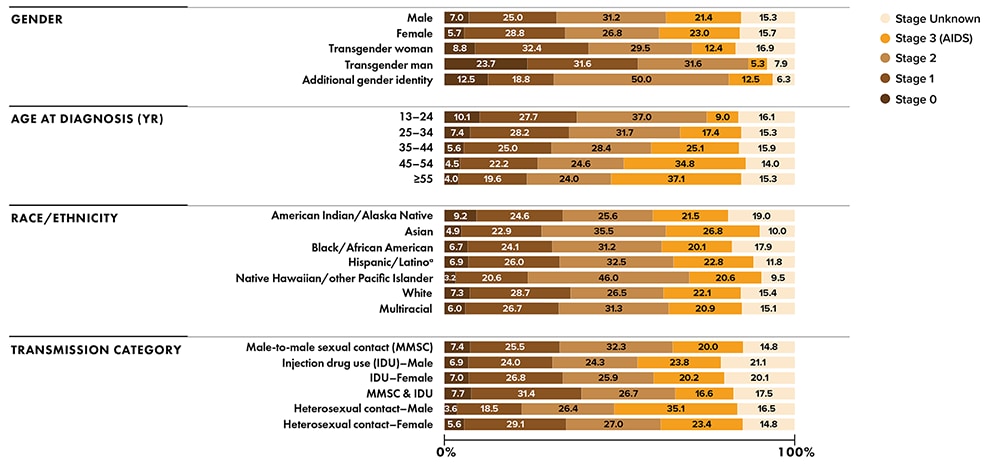
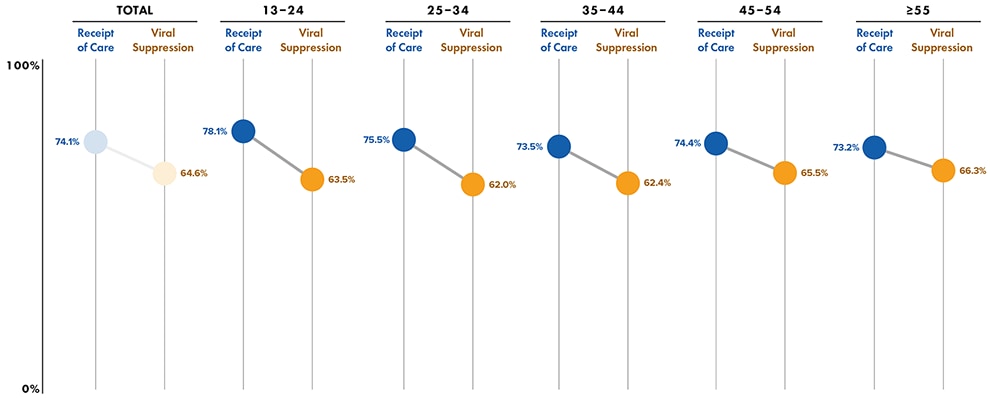
Note. Data for 2020 should be interpreted with caution due to the impact of the COVID-19 pandemic on access to HIV testing, care-related services, and case surveillance activities in state/local jurisdictions. See Guide to Acronyms and Initialisms, Data Tables, and Technical Notes for more information on definitions and data specifications.
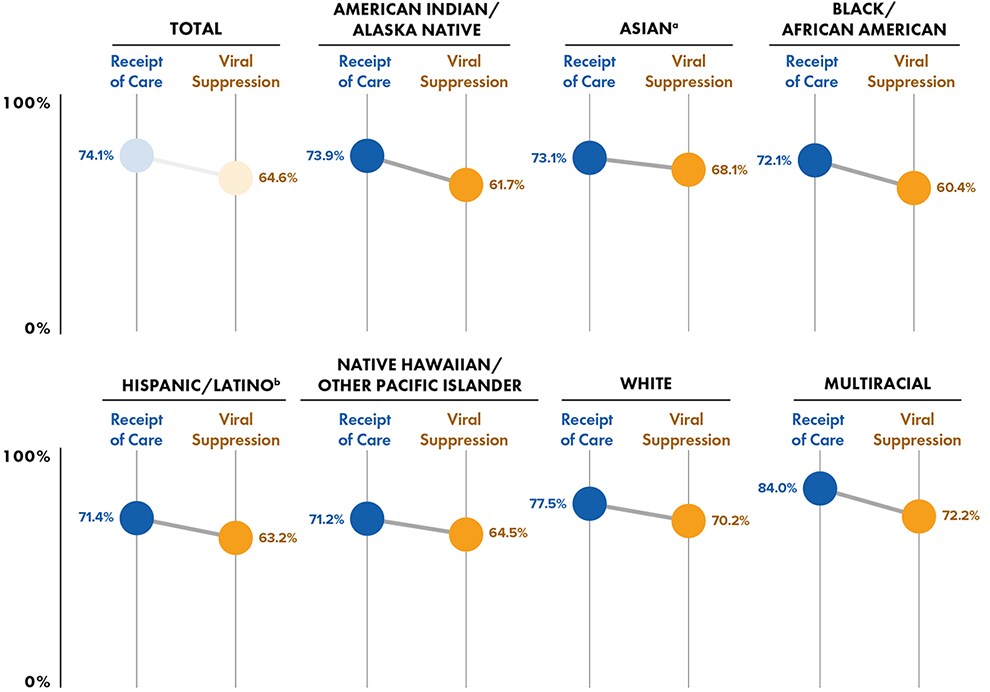
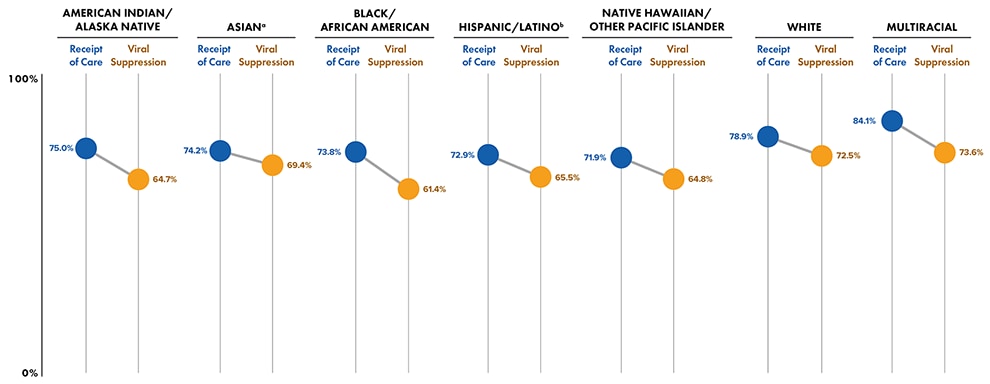
a Hispanic/Latino persons can be of any race.
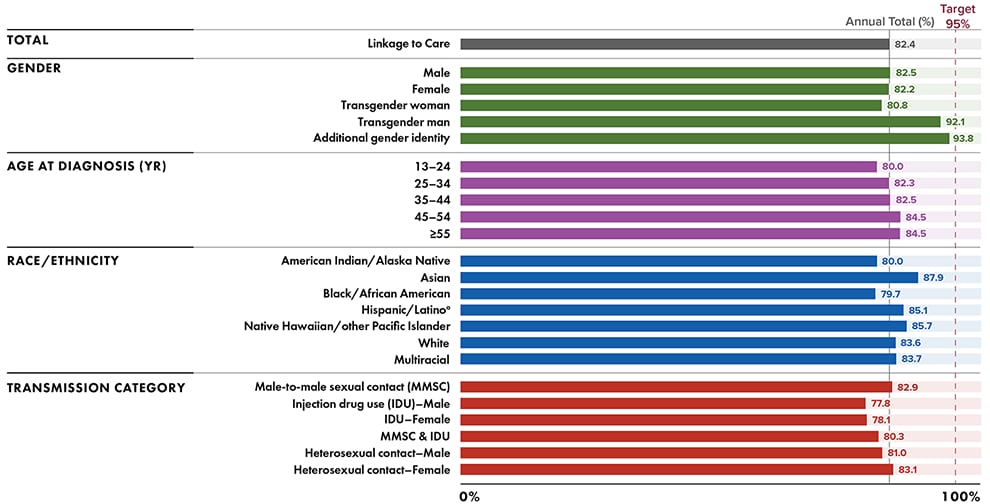
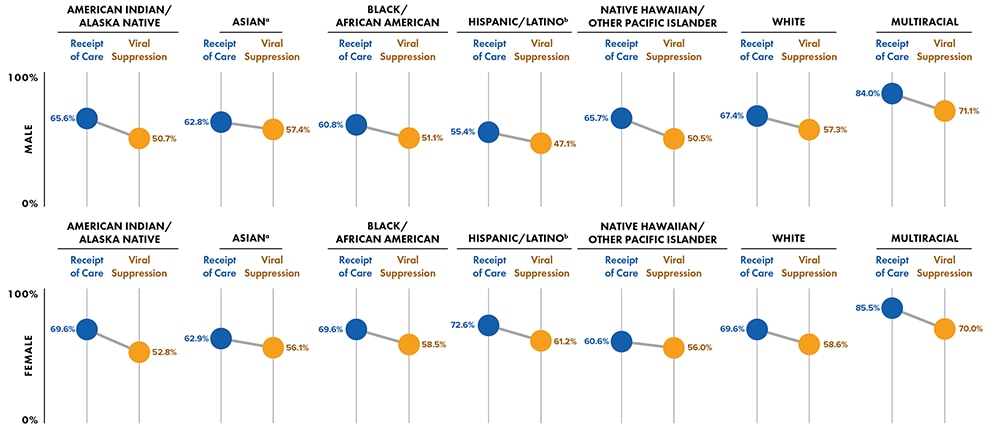
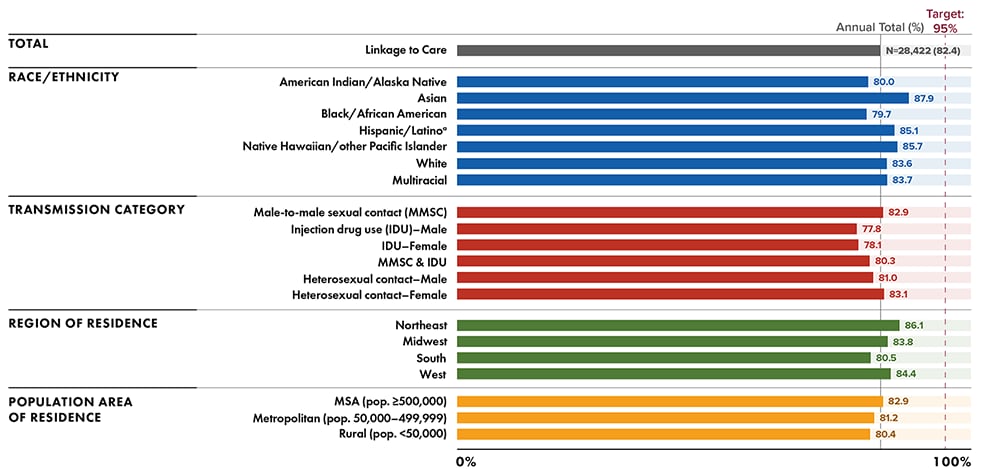
Note. Gray line indicates the overall percentage of persons linked to care within 1 month of diagnosis. Data for 2020 should be interpreted with caution due to the impact of the COVID-19 pandemic on access to HIV testing, care-related services, and case surveillance activities in state/local jurisdictions. See Guide to Acronyms and Initialisms, Data Tables, and Technical Notes for more information on definitions and data specifications.
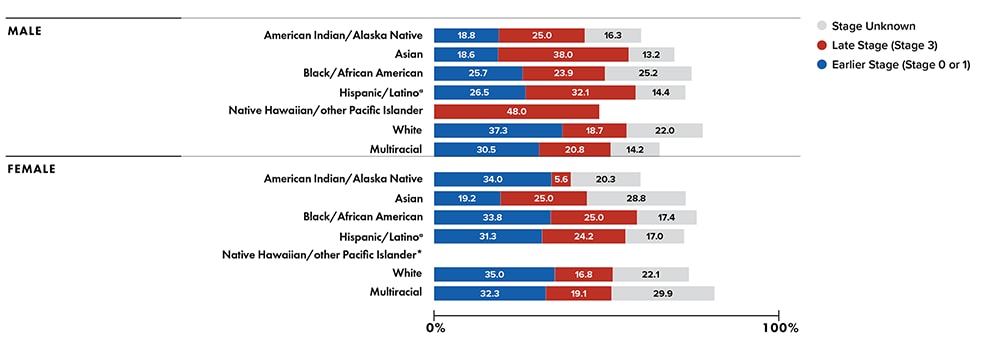
a Hispanic/Latino persons can be of any race.
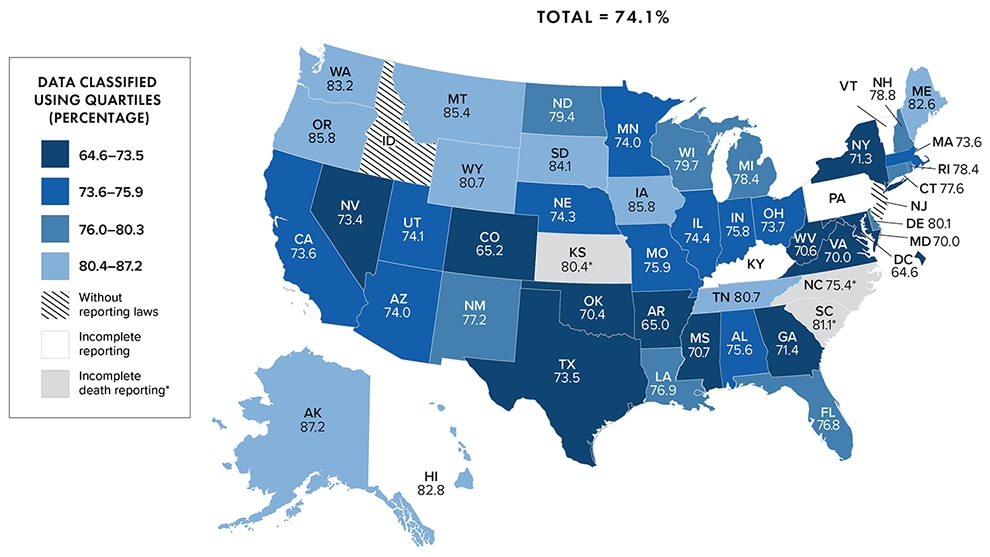
Note. Data for 2020 should be interpreted with caution due to the impact of the COVID-19 pandemic on access to HIV testing, care-related services, and case surveillance activities in state/local jurisdictions. See Guide to Acronyms and Initialisms, Data Tables, and Technical Notes for more information on definitions and data specifications.
a Data for Maryland should be interpreted with caution due to incomplete reporting of case information to CDC during December 2021.
Note. Data for the year 2020 are preliminary and based on deaths reported to CDC as of December 2021. Data for 2020 should also be interpreted with caution due to the impact of the COVID-19 pandemic on access to HIV testing, care-related services, and case surveillance activities in state/local jurisdictions. See Guide to Acronyms and Initialisms, Data Tables, and Technical Notes for more information on definitions and data specifications.
Note. Data for the year 2020 are preliminary and based on deaths reported to CDC as of December 2021. Data for Maryland should be interpreted with caution due to incomplete reporting of case information to CDC during December 2021. Data for 2020 should also be interpreted with caution due to the impact of the COVID-19 pandemic on access to HIV testing, care-related services, and case surveillance activities in state/local jurisdictions. See Guide to Acronyms and Initialisms, Data Tables, and Technical Notes for more information on definitions and data specifications.
Note. Data for the year 2020 are preliminary and based on deaths reported to CDC as of December 2021. Data for 2020 should also be interpreted with caution due to the impact of the COVID-19 pandemic on access to HIV testing, care-related services, and case surveillance activities in state/local jurisdictions. See Guide to Acronyms and Initialisms, Data Tables, and Technical Notes for more information on definitions and data specifications.
a Includes Asian/Pacific Islander legacy cases.
b Hispanic/Latino persons can be of any race.
Note. Data for the year 2020 are preliminary and based on deaths reported to CDC as of December 2021. Data for 2020 should also be interpreted with caution due to the impact of the COVID-19 pandemic on access to HIV testing, care-related services, and case surveillance activities in state/local jurisdictions. See Guide to Acronyms and Initialisms, Data Tables, and Technical Notes for more information on definitions and data specifications.
Note. Data for the year 2020 are preliminary and based on deaths reported to CDC as of December 2021. Data for 2020 should also be interpreted with caution due to the impact of the COVID-19 pandemic on access to HIV testing, care-related services, and case surveillance activities in state/local jurisdictions. Data for Maryland should be interpreted with caution due to incomplete reporting of case information to CDC during December See Guide to Acronyms and Initialisms, Data Tables, and Technical Notes for more information on definitions and data specifications.
Note. Data for the year 2020 are preliminary and based on deaths reported to CDC as of December 2021. Data for Maryland should be interpreted with caution due to incomplete reporting of case information to CDC during December 2021. Data for 2020 should also be interpreted with caution due to the impact of the COVID-19 pandemic on access to HIV testing, care-related services, and case surveillance activities in state/local jurisdictions. See Guide to Acronyms and Initialisms, Data Tables, and Technical Notes for more information on definitions and data specifications.
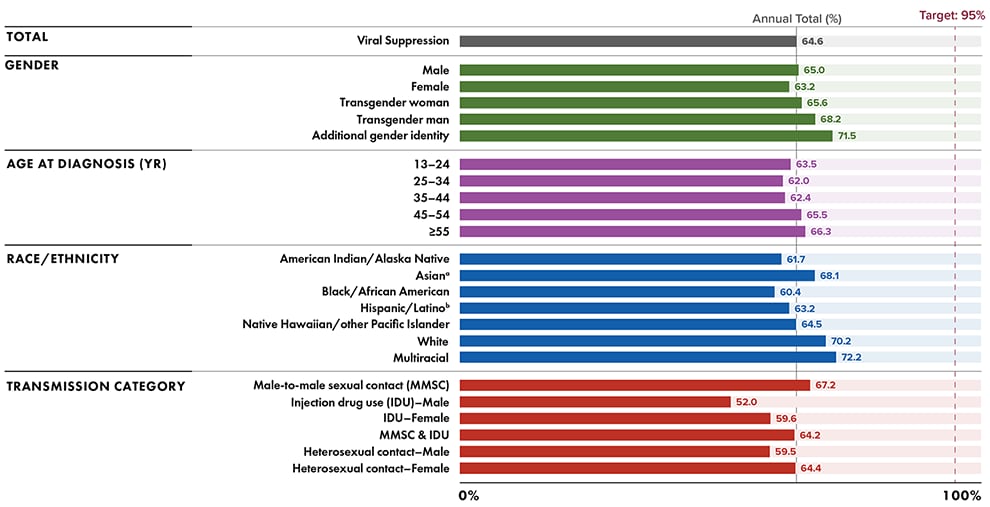
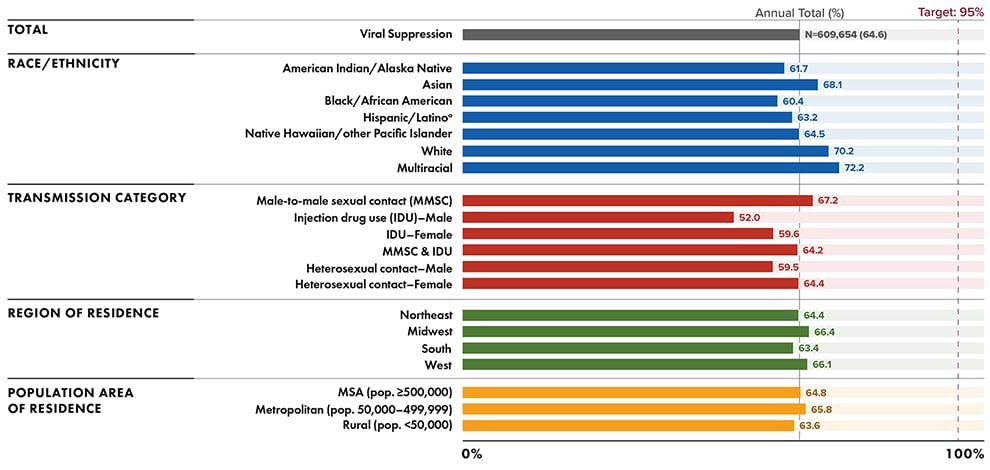
Note. Gray line indicates overall percentage of persons who had viral suppression at the most recent viral load test. Data for the year 2020 are preliminary and based on deaths reported to CDC as of December 2021. Data for 2020 should also be interpreted with caution due to the impact of the COVID-19 pandemic on access to HIV testing, care-related services, and case surveillance activities in state/local jurisdictions. See Guide to Acronyms and Initialisms, Data Tables, and Technical Notes for more information on definitions and data specifications.
a Includes Asian/Pacific Islander legacy cases.
b Hispanic/Latino persons can be of any race.
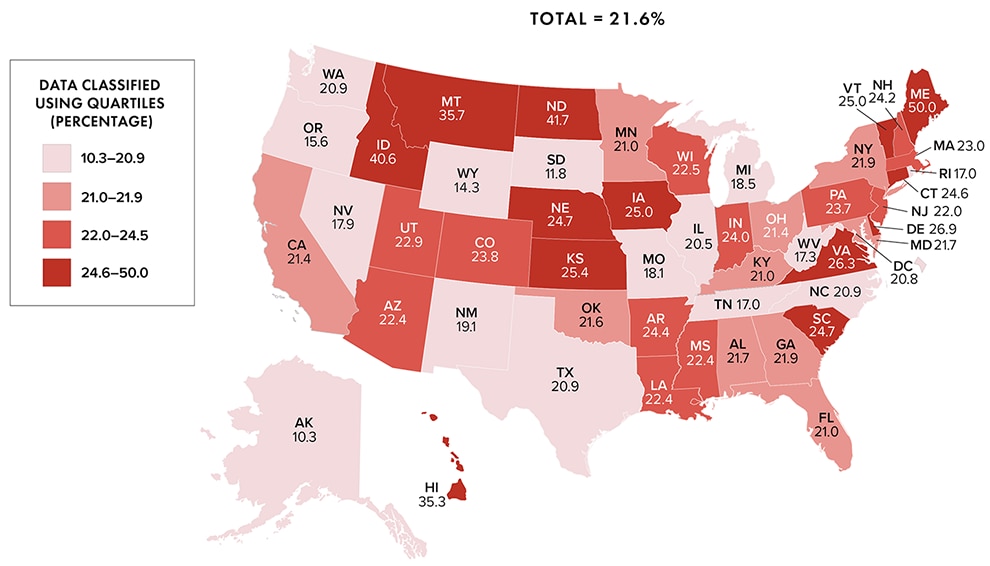
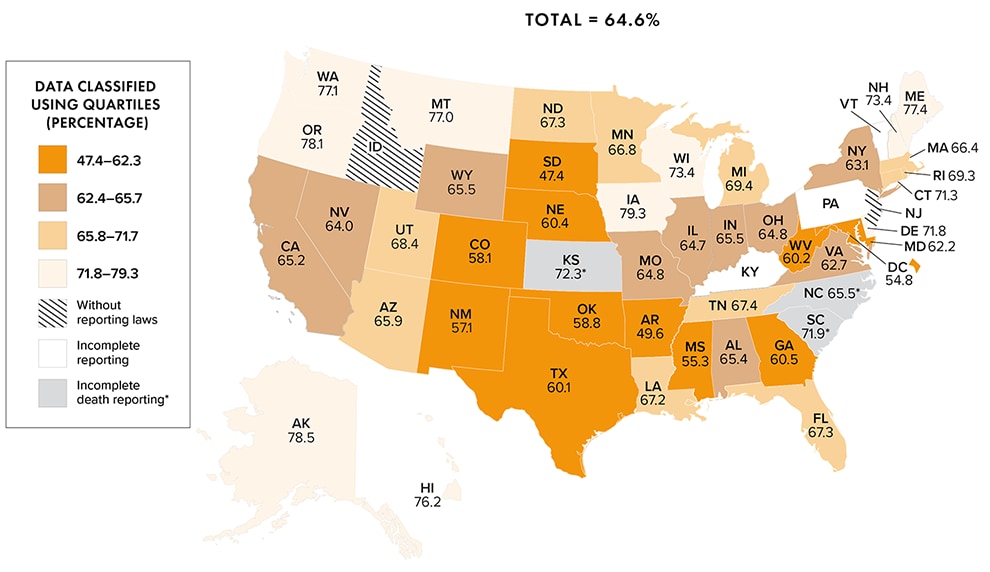
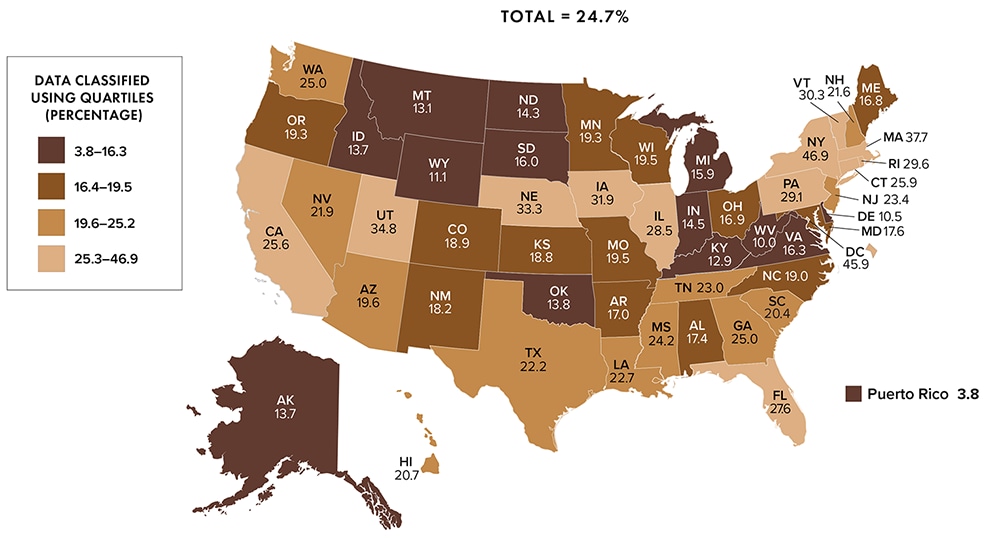
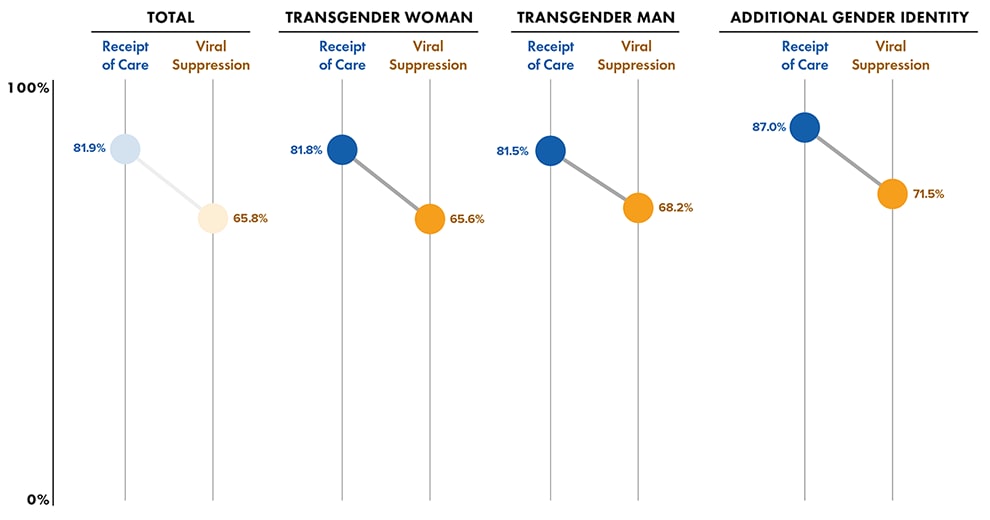
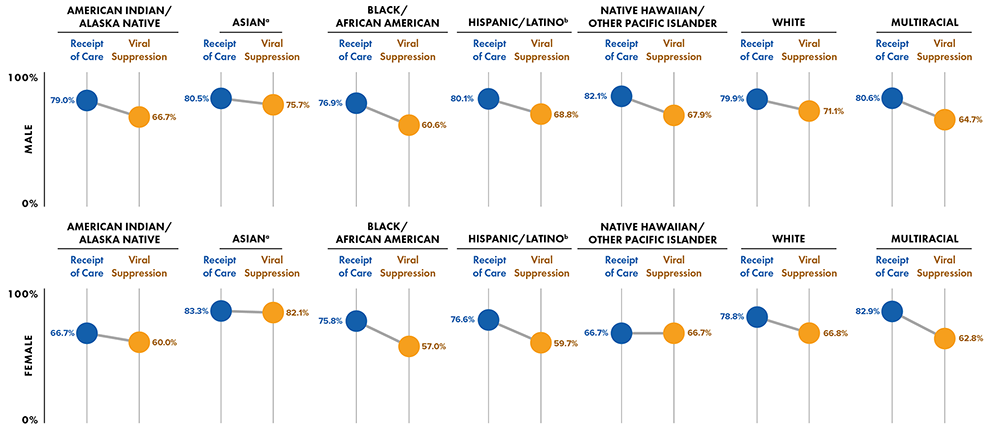
Note. Data for 2020 should be interpreted with caution due to the impact of the COVID-19 pandemic on access to HIV testing, care-related services, and case surveillance activities in state/local jurisdictions. See Guide to Acronyms and Initialisms, Data Tables, and Technical Notes for more information on definitions and data specifications.
Note. Data for 2020 should also be interpreted with caution due to the impact of the COVID-19 pandemic on access to HIV testing, care-related services, and case surveillance activities in state/local jurisdictions. See Guide to Acronyms and Initialisms, Data Tables, and Technical Notes for more information on definitions and data specifications.
a Hispanic/Latino persons can be of any race.
b Includes American Indian/Alaska Native, Asian, Native Hawaiian/other Pacific Islander, and multiracial persons.
Note. Data for 2020 should also be interpreted with caution due to the impact of the COVID-19 pandemic on access to HIV testing, care-related services, and case surveillance activities in state/local jurisdictions. See Guide to Acronyms and Initialisms, Data Tables, and Technical Notes for more information on definitions and data specifications.
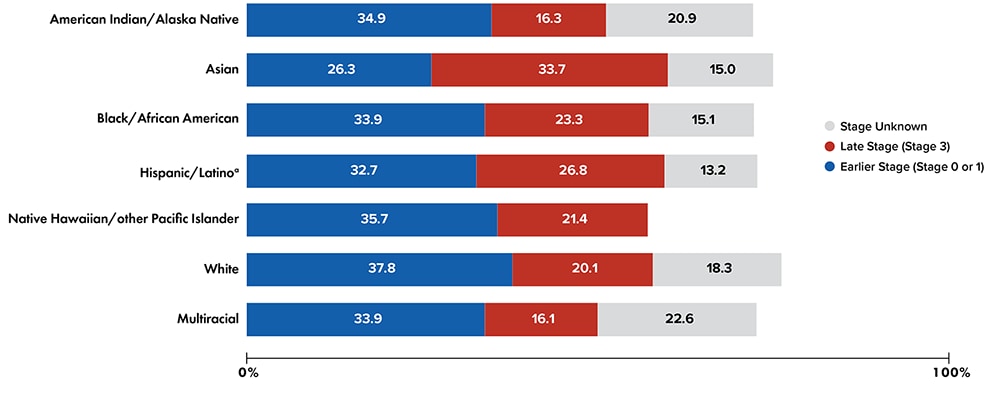
Note. Data for 2020 should be interpreted with caution due to the impact of the COVID-19 pandemic on access to HIV testing, care-related services, and case surveillance activities in state/local jurisdictions. See Guide to Acronyms and Initialisms, Data Tables, and Technical Notes for more information on definitions and data specifications.
a Hispanic/Latino persons can be of any race.
Note. Data for the year 2020 are preliminary and based on deaths reported to CDC as of December 2021. Data for 2020 should also be interpreted with caution due to the impact of the COVID-19 pandemic on access to HIV testing, care-related services, and case surveillance activities in state/local jurisdictions. See Guide to Acronyms and Initialisms, Data Tables, and Technical Notes for more information on definitions and data specifications.
a Includes Asian/Pacific Islander legacy cases.
b Hispanic/Latino persons can be of any race.
Note. Data for 2020 should be interpreted with caution due to the impact of the COVID-19 pandemic on access to HIV testing, care-related services, and case surveillance activities in state/local jurisdictions. See Guide to Acronyms and Initialisms, Data Tables, and Technical Notes for more information on definitions and data specifications. Diagnosis of HIV infection may not be reported for some groups in 2020.
a Hispanic/Latino persons can be of any race.
Note. Data for the year 2020 are preliminary and based on deaths reported to CDC as of December 2021. Data for 2020 should also be interpreted with caution due to the impact of the COVID-19 pandemic on access to HIV testing, care-related services, and case surveillance activities in state/local jurisdictions. See Guide to Acronyms and Initialisms, Data Tables, and Technical Notes for more information on definitions and data specifications.
a Includes Asian/Pacific Islander legacy cases.
b Hispanic/Latino persons can be of any race.
Note. Data for the year 2020 are preliminary and based on deaths reported to CDC as of December 2021. Data for 2020 should also be interpreted with caution due to the impact of the COVID-19 pandemic on access to HIV testing, care-related services, and case surveillance activities in state/local jurisdictions. See Guide to Acronyms and Initialisms, Data Tables, and Technical Notes for more information on definitions and data specifications.
Note. Data for 2020 should be interpreted with caution due to the impact of the COVID-19 pandemic on access to HIV testing, care-related services, and case surveillance activities in state/local jurisdictions. See Guide to Acronyms and Initialisms, Data Tables, and Technical Notes for more information on definitions and data specifications.
a Hispanic/Latino persons can be of any race.
Note. Data for the year 2020 are preliminary and based on deaths reported to CDC as of December 2021. Data for 2020 should also be interpreted with caution due to the impact of the COVID-19 pandemic on access to HIV testing, care-related services, and case surveillance activities in state/local jurisdictions. See Guide to Acronyms and Initialisms, Data Tables, and Technical Notes for more information on definitions and data specifications.
a Includes Asian/Pacific Islander legacy cases.
b Hispanic/Latino persons can be of any race.
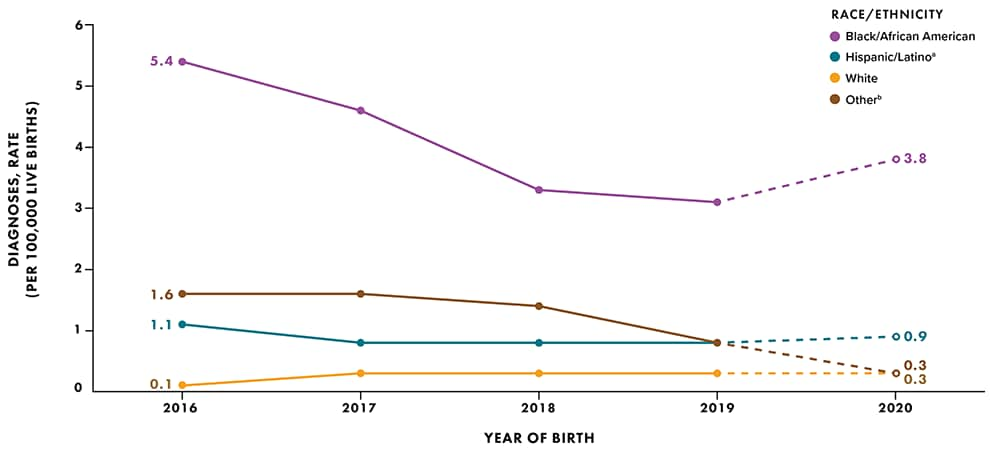
Note. Live-birth data reflect race/ethnicity of the infant’s mother. Data for 2020 should be interpreted with caution due to the impact of the COVID-19 pandemic on access to HIV testing, care-related services, and case surveillance activities in state/local jurisdictions. See Guide to Acronyms and Initialisms, Data Tables, and Technical Notes for more information on definitions and data specifications.
a Hispanic/Latino persons can be of any race.
b Includes American Indian/Alaska Native, Asian, Native Hawaiian/other Pacific Islander, and multiracial persons
Note. Data for the year 2020 are preliminary and based on deaths reported to CDC as of December 2021. Data for 2020 should also be interpreted with caution due to the impact of the COVID-19 pandemic on access to HIV testing, care-related services, and case surveillance activities in state/local jurisdictions. See Guide to Acronyms and Initialisms, Data Tables, and Technical Notes for more information on definitions and data specifications.
a Includes Asian/Pacific Islander legacy cases.
b Hispanic/Latino persons can be of any race.
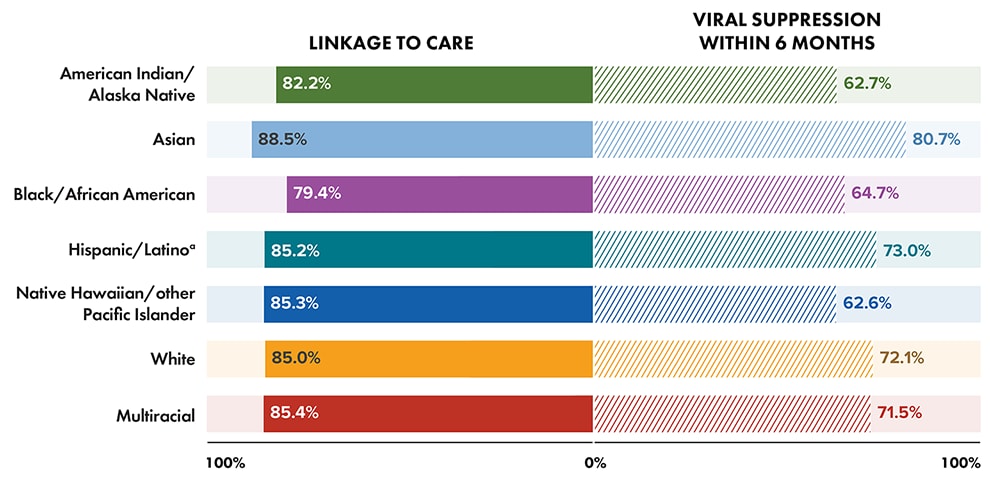
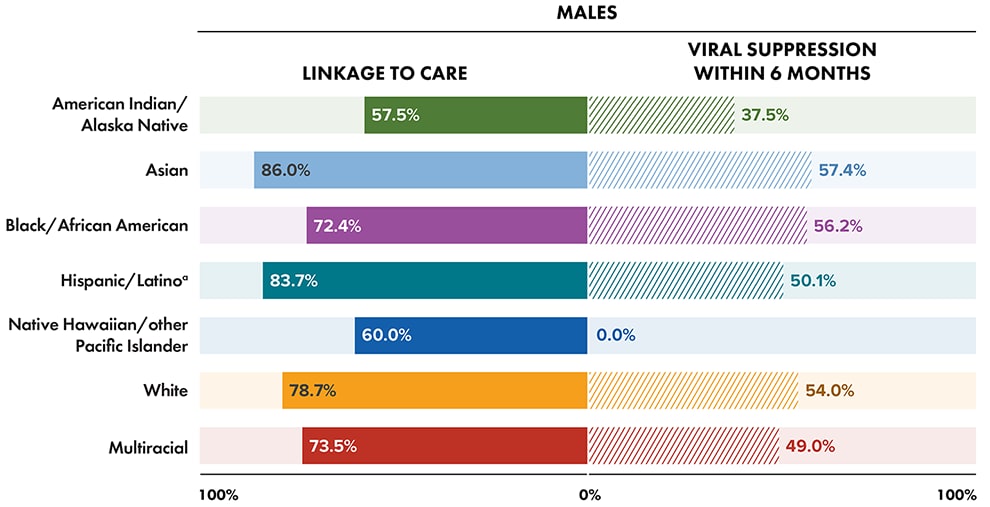
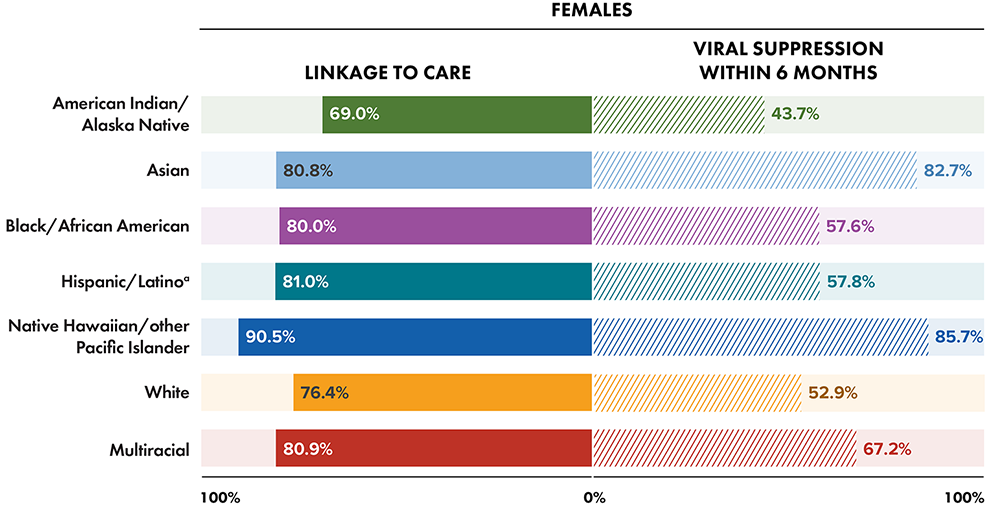
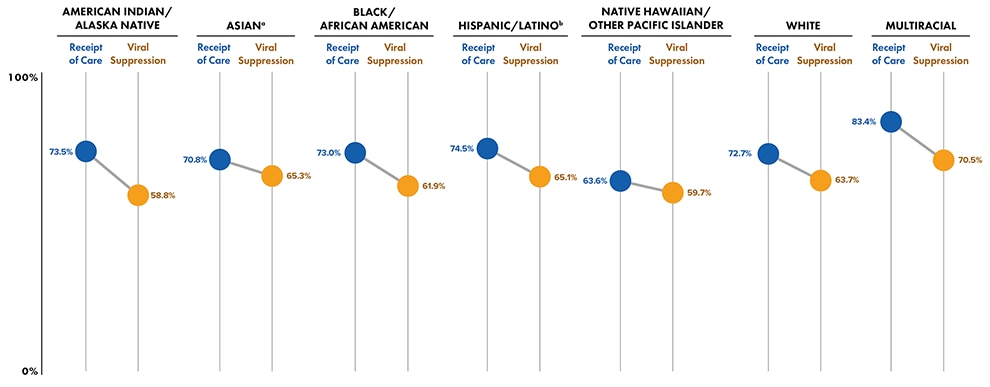
Note. Gray line indicates the overall percentage of persons linked to care within 1 month of diagnosis. Data for 2020 should be interpreted with caution due to the impact of the COVID-19 pandemic on access to HIV testing, care-related services, and case surveillance activities in state/local jurisdictions. See Guide to Acronyms and Initialisms, Data Tables, and Technical Notes for more information on definitions and data specifications.
a Hispanic/Latino persons can be of any race.
Note. Gray line indicates the overall percentage of persons had viral suppression at the most recent viral load test. Data for the year 2020 are preliminary and based on deaths reported to CDC as of December 2021. Data for 2020 should be interpreted with caution due to the impact of the COVID-19 pandemic on access to HIV testing, care-related services, and case surveillance activities in state/local jurisdictions. See Guide to Acronyms and Initialisms, Data Tables, and Technical Notes for more information on definitions and data specifications.
a Hispanic/Latino persons can be of any race.
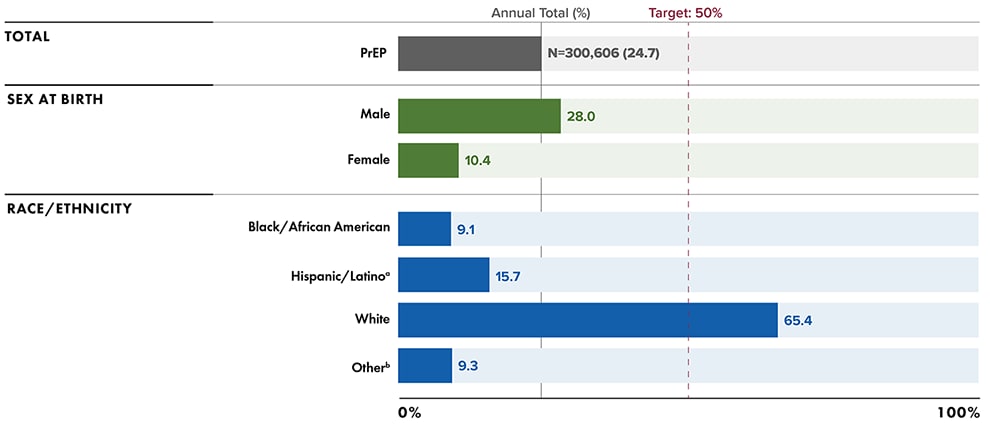
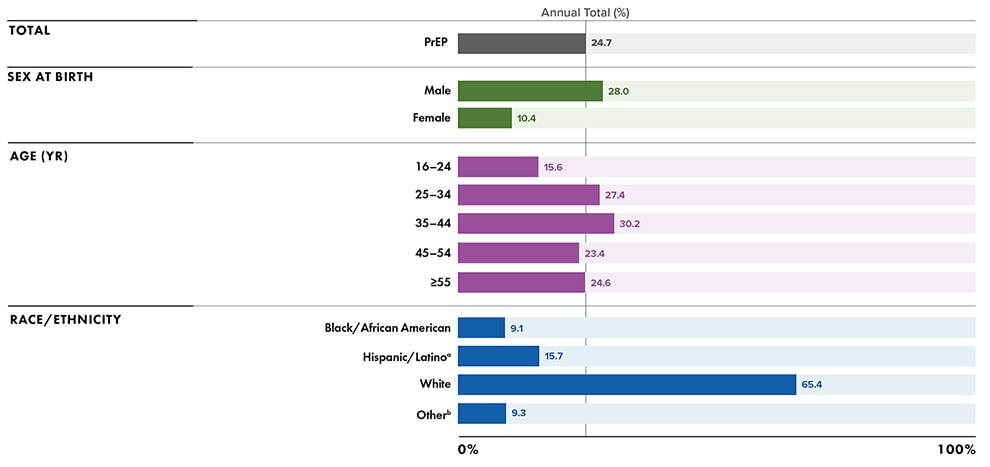
Note. Gray line indicates the overall percentage of persons with indications for PrEP prescribed PrEP. Data for 2020 should be interpreted with caution due to the impact of the COVID-19 pandemic on access to HIV testing, care-related services, and case surveillance activities in state/local jurisdictions. See Guide to Acronyms and Initialisms, Data Tables, and Technical Notes for more information on definitions and data specifications.
a Hispanic/Latino persons can be of any race.
b Includes American Indian/Alaska Native, Asian, Native Hawaiian/other Pacific Islander, and multiracial persons.