Social Determinants of Health among Adults with Diagnosed HIV Infection, 2018: National SDH Profile

The statements in this section, unless otherwise indicated, are based on stable numbers (i.e., based on 12 or more diagnoses). All rates are per 100,000 population and refer to adults aged 18 years and older. Social determinants of health data are estimates for the period 2014–2018, and HIV surveillance data are based on diagnoses of HIV infection in 2018 among adults in the 50 states, the District of Columbia, and Puerto Rico. Data on linkage to HIV medical care and viral suppression within 6 months of HIV diagnosis are for 42 jurisdictions with complete reporting of CD4s and viral loads to CDC (see Technical Notes for list of jurisdictions).
The data presented in this HIV surveillance supplemental report are a snapshot of the environment in which people lived at the time of HIV diagnosis. Some SDH indicators and/or selected characteristics may be correlated (e.g., lack of education has been associated with both poverty and low income in the United States [3,4]), but correlations of indicators and/or characteristics were not assessed for this report.
Important note— The statements in the sections on linkage to care and viral suppression focus on the lowest percentages at the SDH extremes only (e.g., highest poverty, highest uninsured) and not the overall values within the column, unless otherwise indicated. Also, when highlighting care outcomes, the “other” racial group is not considered when making comparisons across groups.
Please read all table titles and footnotes carefully to ensure a complete understanding of the displayed data.
Diagnoses of HIV Infection — Overview
In the 50 states, the District of Columbia, and Puerto Rico, HIV infection was diagnosed for 33,087 adults (aged 18 years and older) whose residential address information was sufficient for geocoding to the census tract level (Table 1). These diagnoses represent approximately 89.5% of all diagnoses of HIV infection in 2018 among adults in these areas. The overall rate of diagnoses of HIV infection was 13.1. The HIV diagnosis rate was 21.9 for males and 4.8 for females (Table 1).
Linkage to HIV medical care was based on data for persons with infection diagnosed during 2018 in 42 jurisdictions that reported complete CD4 and viral load test results to CDC. Of the 29,100 adults whose infection was diagnosed during 2018 in the 42 jurisdictions, 80.7% (23,490) were linked to HIV medical care ≤1 month after diagnosis, and 88.3% (25,695) were linked to HIV medical care ≤3 months after diagnosis (Table 9a).
Viral suppression within 6 months of HIV diagnosis was measured for persons whose infection was diagnosed during 2018 and who resided in the 42 jurisdictions at time of diagnosis. Of the 29,100 adults whose infection was diagnosed during 2018 in the 42 jurisdictions, 67.9% (19,749 adults) had viral suppression within 6 months (Table 10a).
Federal Poverty Status
Sex at Birth: The highest HIV diagnosis rate for males (39.7) and for females (10.1) were among those who lived in census tracts where 18% or more of the residents lived below the federal poverty level. For both sexes, the rate of HIV diagnoses increased as the percentages of residents living below the federal poverty level increased (Table 1).
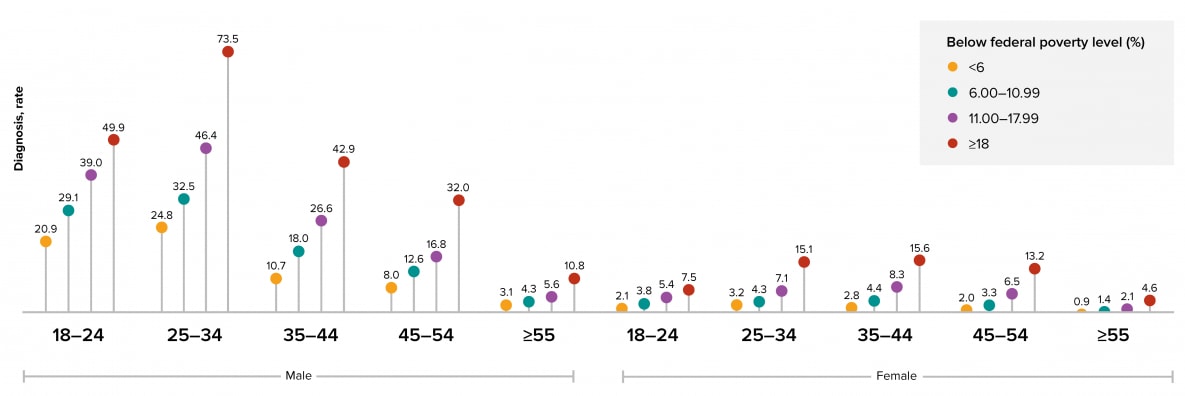
Age Group: Persons who lived in census tracts where 18% or more of the residents lived below the federal poverty level accounted for the highest HIV diagnoses rates for both sexes in all age groups (Figure 1 and Table 2).
Figure 1. Diagnoses of HIV infection among adults, by age at diagnosis, sex at birth, and federal poverty status, 2018—census tract level, United States and Puerto Rico
Race/Ethnicity: Persons who lived in census tracts where 18% or more of the residents lived below the federal poverty level accounted for the highest HIV diagnosis rates for both sexes in all racial/ethnic groups (Figure 2 and Table 1). Please use caution when interpreting data for American Indians/Alaska Natives and Native Hawaiian/other Pacific Islanders due to most rates being based on small case counts.
Figure 2. Diagnoses of HIV infection among adults, race/ethnicity, sex at birth, and federal poverty status, 2018—census tract level, United States and Puerto Rico
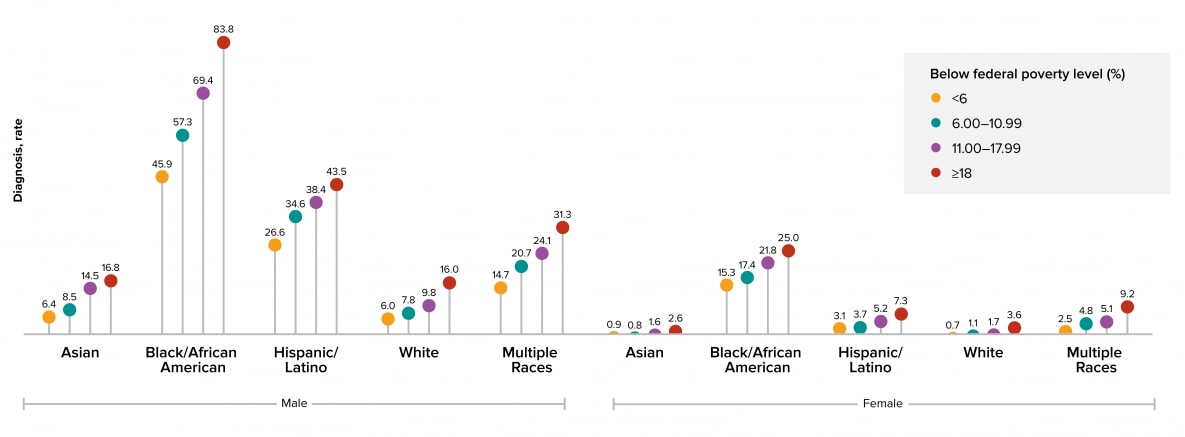
Note. Hispanics/Latinos can be of any race.
Transmission category: Persons who lived in census tracts where 18% or more of the residents lived below the federal poverty level accounted for the largest percentage of HIV diagnoses for both sexes and in all transmission categories (Figure 3 and Table 3).
Figure 3. Diagnoses of HIV infection among adults, by transmission category, sex at birth, and federal poverty status, 2018—census tract level, United States and Puerto Rico
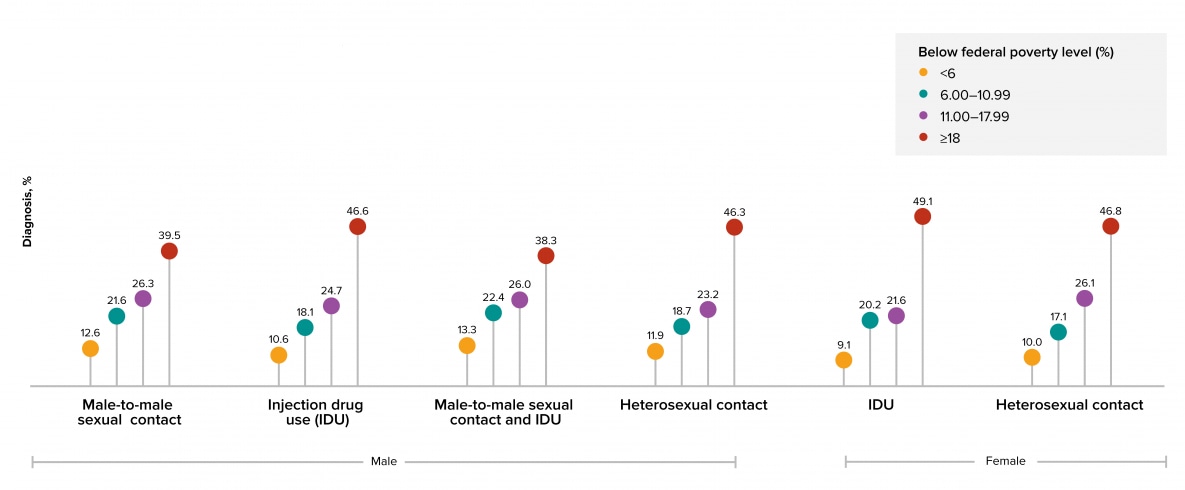
Note. Data have been statistically adjusted to account for missing transmission category. See Data Tables, Definitions, and Acronyms for more information on transmission categories.
Area of Residence: Among persons who lived in census tracts where 18% or more of the residents lived below the federal poverty level, the areas with the highest rates of HIV diagnoses were the District of Columbia (total, 57.7; males, 87.6; females, 32.9), followed by Florida (total, 50.9; males, 80.9; females, 22.6) (Table 4). Use caution when comparing the rates of diagnoses for the District of Columbia to the rates for states.
Linkage to Care: In 42 jurisdictions with complete reporting of laboratory data to CDC, overall, the lowest percentages linked to HIV medical care ≤1 month after receiving a diagnosis in 2018 were among persons who lived in census tracts with the highest poverty for both males (79.0%) and females (78.0%) (Table 9a). By race/ethnicity, the lowest percentages were among those who lived in census tracts with the highest poverty for both sexes in all racial/ethnic groups (Table 9a). By age group, the lowest percentages were among those who lived in census tracts with the highest poverty for both sexes in all age groups (except females aged 45–54 years where the lowest percentage was among those who lived in census tracts with the lowest poverty) (Table 9b). By transmission category, the lowest percentages were among those who lived in census tracts with the highest poverty for both sexes in all transmission categories (except for males with infection attributed to male-to-male sexual contact and injection drug use) (Table 9c). Among males with infection attributed to male-to-male sexual contact by race/ethnicity, the lowest percentages were among Hispanics/Latinos (82.3%) and whites (83.3%) who lived in census tracts with the highest poverty (Table 9d).
Viral Suppression: In 42 jurisdictions with complete reporting of laboratory data to CDC, overall, the lowest percentages of viral suppression within 6 months of diagnosis among persons with HIV diagnosed during 2018 were among those who lived in census tracts with the highest poverty for both males (65.1%) and females (63.1%) (Table 10a). By race/ethnicity, the lowest percentages were among those who lived in census tracts with the highest poverty for both sexes for Blacks/African Americans, Hispanics/Latinos, and whites (Table 10a). By age group, the lowest percentages were among those who lived in census tracts with the highest poverty for both sexes in all age groups (Table 10b). By transmission category, the lowest percentages were among those who lived in census tracts with the highest poverty for both sexes and all transmission categories (except among males with infection attributed to injection drug use) (Table 10c). Among males with infection attributed to male-to-male sexual contact by race/ethnicity, the lowest percentages were among males who lived in census tracts with the highest poverty for Blacks/African Americans (61.5%), Hispanics/Latinos (72.3%), and whites (69.4%) (Table 10d).
Education Level
Sex at Birth: The highest HIV diagnosis rate for males (36.0) and for females (9.5) were among those who lived in census tracts where 18% or more of the residents had less than a high school diploma (Table 1). For both sexes, the rate of HIV diagnoses increased as the percentages of residents with less than a high school diploma increased.
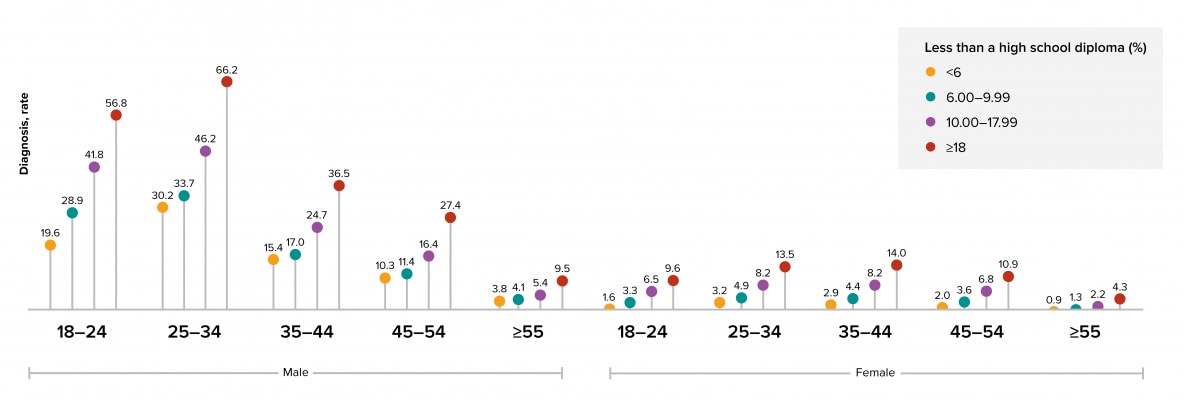
Age Group: Persons who lived in census tracts where 18% or more of the residents had less than a high school diploma accounted for the highest HIV diagnoses rates for both sexes in all age groups (Figure 4 and Table 2).
Figure 4. Diagnoses of HIV infection among adults, by age at diagnosis, sex at birth, and education status, 2018—census tract level, United States and Puerto Rico
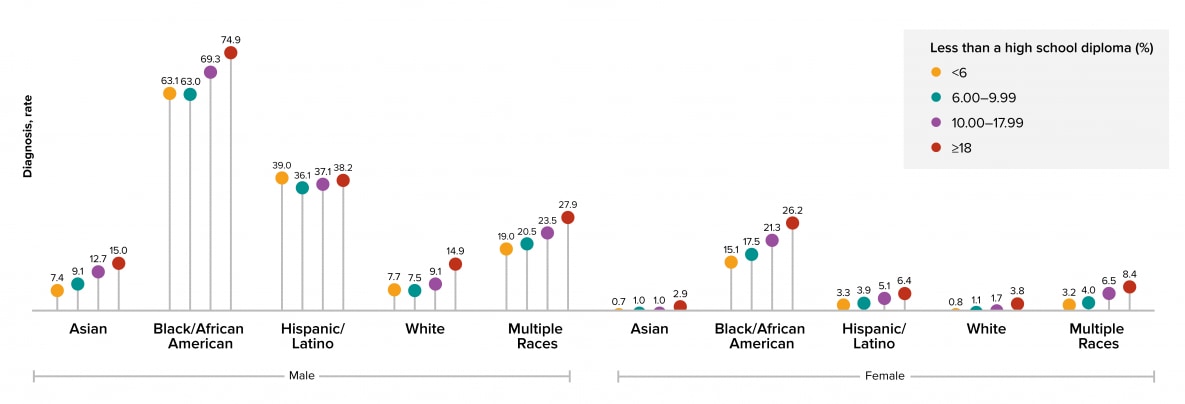
Race/Ethnicity: Persons who lived in census tracts where 18% or more of the residents had less than a high school diploma accounted for the highest HIV diagnosis rates for both sexes in all racial/ethnic groups (Figure 5 and Table 1). Please use caution when interpreting data for American Indians/Alaska Natives and Native Hawaiian/other Pacific Islanders due to most rates being based on small case counts.
Figure 5. Diagnoses of HIV infection among adults, by race/ethnicity, sex at birth, and education status, 2018—census tract level, United States and Puerto Rico
Note. Hispanics/Latinos can be of any race.
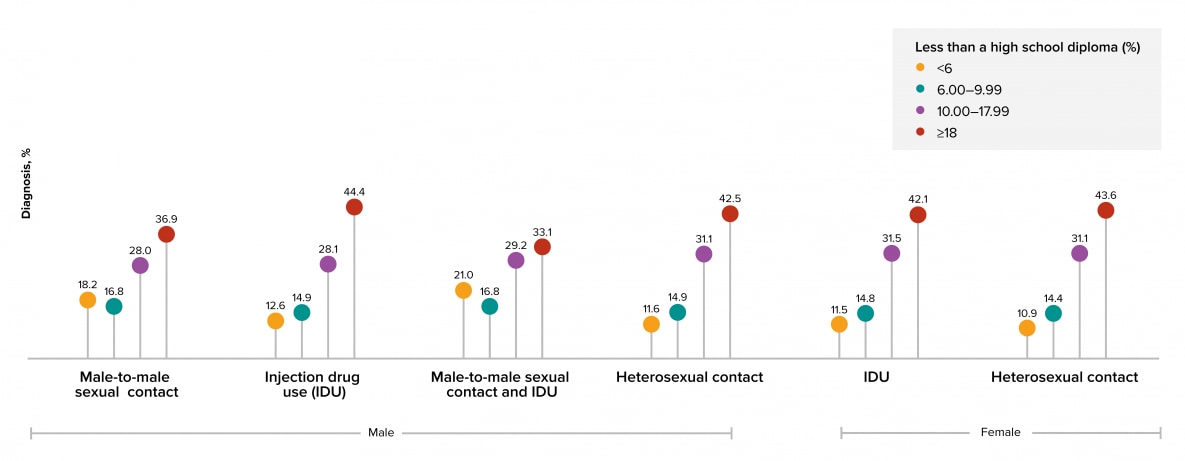
Transmission Category: Persons who lived in census tracts where 18% or more of the residents had less than a high school diploma accounted for the largest percentage of HIV diagnoses for both sexes and in all transmission categories (Figure 6 and Table 3).
Figure 6. Diagnoses of HIV infection among adults, by transmission category, sex at birth, and education status, 2018—census tract level, United States and Puerto Rico
Note. Data have been statistically adjusted to account for missing transmission category. See Data Tables, Definitions, and Acronyms for more information on transmission categories.
Area of Residence: Among persons who lived in census tracts where 18% or more of the residents had less than a high school diploma, the areas with the highest rates of HIV diagnoses were the District of Columbia (total, 64.8; males, 96.4; females, 36.3), followed by Florida (total, 46.2; males, 69.2; females, 23.1) (Table 5). Use caution when comparing the rates of diagnoses for the District of Columbia to the rates for states.
Linkage to Care: In 42 jurisdictions with complete reporting of laboratory data to CDC, overall, the lowest percentages of linkage ≤1 month after diagnosis among persons with HIV diagnosed in 2018 were among those who lived in census tracts with the 2 lowest education levels for both sexes (Table 9a). By race/ethnicity, the lowest percentages were among those who lived in census tracts with the lowest education for Hispanic/Latino males (82.1%), white males (82.1%) and white females (71.4%); and the highest education for Hispanic/Latino females (79.5%) (Table 9a). By age group, the lowest percentages were among those who lived in census tracts with the lowest education for both sexes for those aged 18–24 and ≥45 years, and females aged 25–34 years; and highest education for females aged 35–44 years (Table 9b). By transmission category, the lowest percentages were among those who lived in census tracts with the lowest education for both sexes and all transmission categories (except for males with infection attributed to male-to-male sexual contact or to heterosexual contact) (Table 9c). Among males with infection attributed to male-to-male sexual contact and who lived in census tracts with the lowest education, the lowest percentages by race/ethnicity were among Hispanics/Latinos (82.4%) and whites (84.0%) (Table 9d).
Viral Suppression: In 42 jurisdictions with complete reporting of laboratory data to CDC, overall, the lowest percentages of viral suppression within 6 months of diagnosis among persons with HIV diagnosed during 2018 were among those who lived in census tracts with the lowest education for both males (66.1%) and females (64.5%) (Table 10a). By race/ethnicity, the lowest percentages were among those who lived in census tracts with the lowest education for both sexes and Blacks/African Americans, Hispanics/Latinos, and whites (Table 10a). By age group, the lowest percentages were among those who lived in census tracts with the lowest education for males aged ≥25 and females aged 18–44 years (Table 10b). By transmission category, the lowest percentages were among those who lived in census tracts with the lowest education for male-to-male sexual contact and heterosexual contact for both sexes (Table 10c). Among males with infection attributed to male-to-male sexual contact by race/ethnicity, the lowest percentages were among males who lived in census tracts with the lowest education for Blacks/African Americans (61.4%), Hispanics/Latinos (71.5%), and whites (70.2%) (Table 10d).
Median Household Income
Sex at Birth: The highest HIV diagnosis rate for males (38.4) and for females (10.2) were among those who lived in census tracts where the median household income was less than $42,000 a year (Table 1). For both sexes, the rate of HIV diagnoses decreased as median household incomes increased.
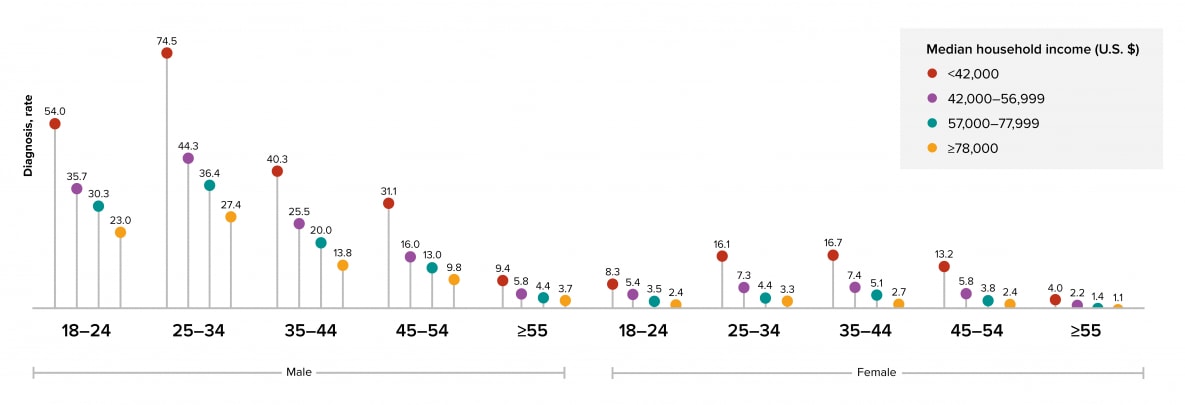
Age Group: Persons who lived in census tracts where the median household income was less than $42,000 a year accounted for the highest HIV diagnoses rates for both sexes in all age groups (Figure 7 and Table 2).
Figure 7. Diagnoses of HIV infection among adults, by age at diagnosis, sex at birth, and income level, 2018—census tract level, United States and Puerto Rico
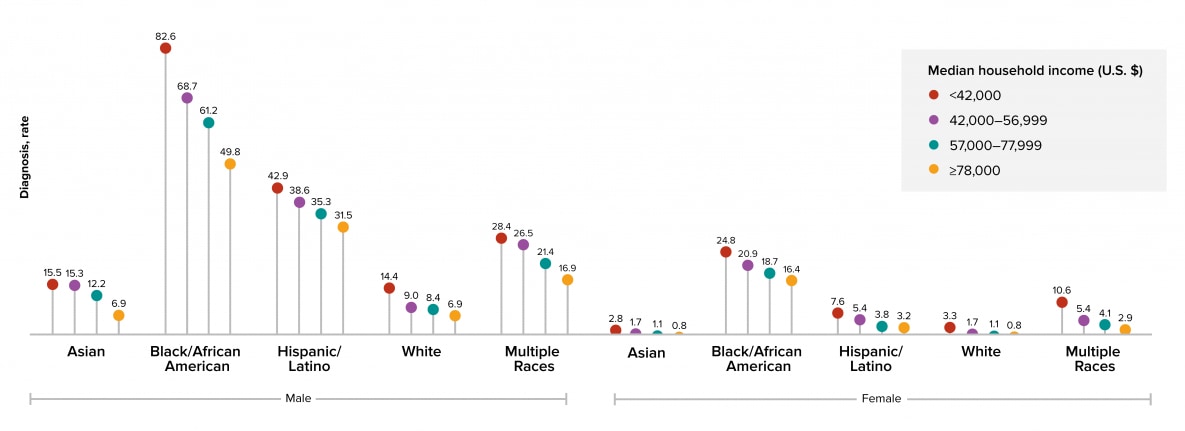
Race/Ethnicity: Persons who lived in census tracts where the median household income was less than $42,000 a year accounted for the highest HIV diagnosis rates for both sexes in all racial/ethnic groups (Figure 8 and Table 1). Please use caution when interpreting data interpreting data for American Indians/Alaska Natives and Native Hawaiian/other Pacific Islanders due to most rates being based on small case counts.
Figure 8. Diagnoses of HIV infection among adults, by race/ethnicity, sex at birth, and income level, 2018—census tract level, United States and Puerto Rico
Note. Hispanics/Latinos can be of any race.
Transmission Category: Persons who lived in census tracts where the median household income was less than $42,000 a year accounted for the largest percentage of HIV diagnoses for both sexes and in all transmission categories (Figure 9 and Table 3).
Figure 9. Diagnoses of HIV infection among adults, by transmission category, sex at birth, and income level, 2018—census tract level, United States and Puerto Rico
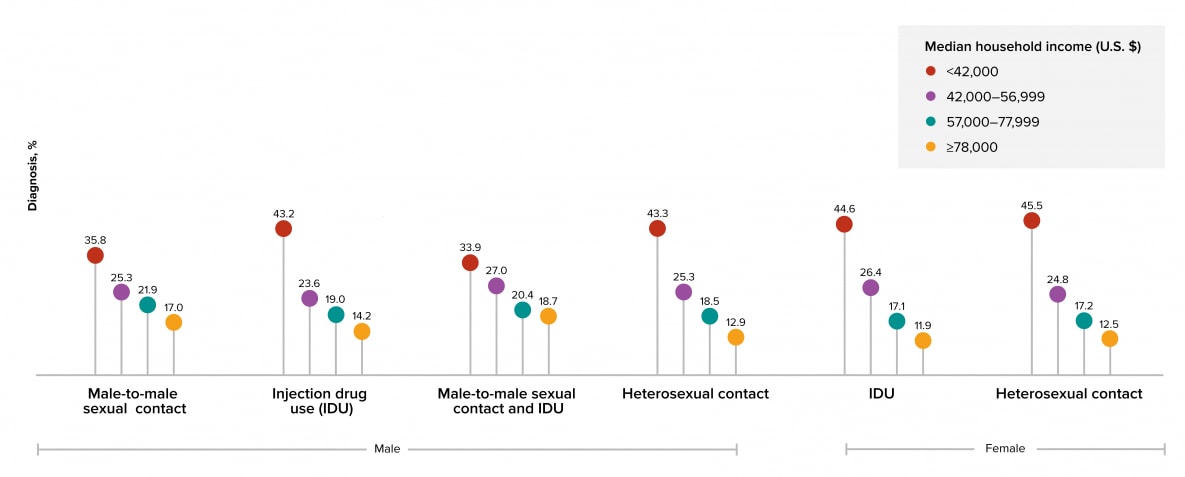
Note. Data have been statistically adjusted to account for missing transmission category. See Data Tables, Definitions, and Acronyms for more information on transmission categories.
Area of Residence: Among persons who lived in census tracts where the median household income was less than $42,000 a year, the area with the highest rates of HIV diagnoses were the District of Columbia (total, 71.3; males, 110.4; females, 42.1), followed by Maryland (total, 46.1; males, 77.3) and Louisiana for females (23.8) (Table 6). Use caution when comparing the rates of diagnoses for the District of Columbia to the rates for states.
Linkage to Care: In 42 jurisdictions with complete reporting of laboratory data to CDC, overall, the lowest percentages of persons linked to HIV medical care ≤1 month after receiving a diagnosis in 2018 were among those who lived in census tracts with lowest income for both males (78.4%) and females (78.4%) (Table 9a). By race/ethnicity, the lowest percentages were among those who lived in census tracts with the lowest income for both sexes for Blacks/African Americans, Hispanics/Latinos, and whites (Table 9a). By age group, the lowest percentages were among those who lived in census tracts with the lowest income for males aged 18–54 years and females aged 25–44 and ≥55 years; and highest income for females aged 18–24 years (Table 9b). By transmission category, the lowest percentages were among those who lived in census tracts with the lowest income for both sexes and all transmission categories (except for infection attributed to male-to-male sexual contact and injection drug use) (Table 9c). Among males with infection attributed to male-to-male sexual contact by race/ethnicity, the lowest percentages were among males who lived in census tracts with the lowest income for Blacks/African Americans (76.0%), Hispanics/Latinos (81.7%), and whites (83.3%) (Table 9d).
Viral Suppression: In 42 jurisdictions with complete reporting of laboratory data to CDC, overall, the lowest percentages of viral suppression within 6 months of diagnosis among persons with HIV diagnosed during 2018 were among those who lived in census tracts with the lowest income for both males (63.9%) and females (62.9%) (Table 10a). By race/ethnicity, the lowest percentages were among those who lived in census tracts with the lowest income for both sexes and Blacks/African Americans, Hispanics/Latinos, and whites (Table 10a). By age group, the lowest percentages were among those who lived in census tracts with the lowest income for both sexes in all age groups (except females aged 45–54 years) (Table 10b). By transmission category, the lowest percentages were among those who lived in census tracts with the lowest income for both sexes and all transmission categories (for infection attributed to male-to-male sexual contact and injection drug use, the lowest percentages were the 2 lowest levels of income) (Table 10c). Among males with infection attributed to male-to-male sexual contact by race/ethnicity, the lowest percentages were among males who lived in census tracts with the lowest income for Blacks/African Americans (60.8%), Hispanics/Latinos (70.7%), and whites (69.2%) (Table 10d).
Health Insurance Coverage
Sex at Birth: The highest HIV diagnosis rate for males (39.5) and for females (9.8) were among those who lived in census tracts where 15% or more of the residents did not have health insurance or health coverage plan (hereafter referred to as health insurance coverage) (Table 1). For both sexes, the rate of HIV diagnoses increased as the percentages of residents without health insurance coverage increased.
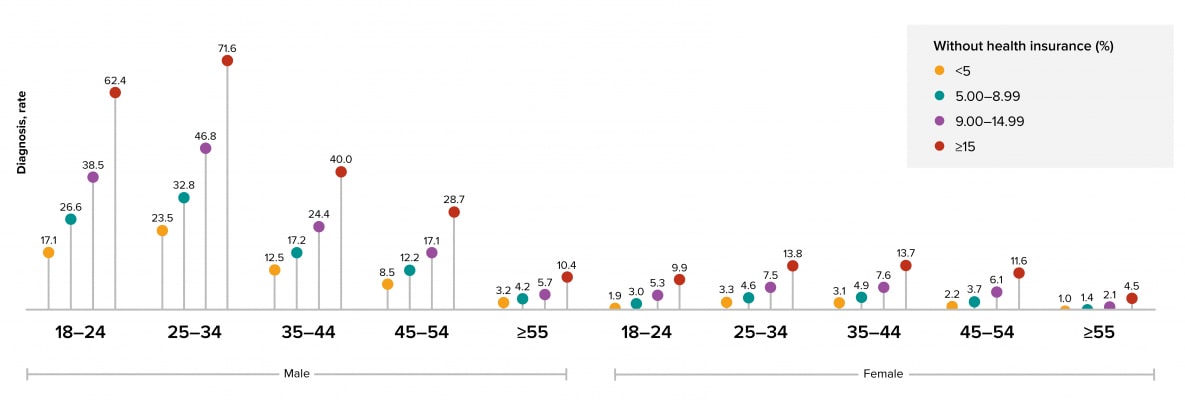
Age Group, by Sex at Birth: Persons who lived in census tracts where 15% or more of the residents did not have health insurance coverage accounted for the highest HIV diagnoses rates for both sexes in all age groups (Figure 10 and Table 2).
Figure 10. Diagnoses of HIV infection among adults, by age at diagnosis, sex at birth, and health insurance coverage, 2018—census tract level, United States and Puerto Rico
Race/Ethnicity, by Sex at Birth: Persons who lived in census tracts where 15% or more of the residents did not have health insurance coverage accounted for the highest HIV diagnosis rates for both sexes in all racial/ethnic groups (Figure 11 and Table 1). Please use caution when interpreting data for American Indians/Alaska Natives and Native Hawaiian/other Pacific Islanders due to most rates being based on small case counts.
Figure 11. Diagnoses of HIV infection among adults, by race/ethnicity, sex at birth, and health insurance coverage, 2018—census tract level, United States and Puerto Rico
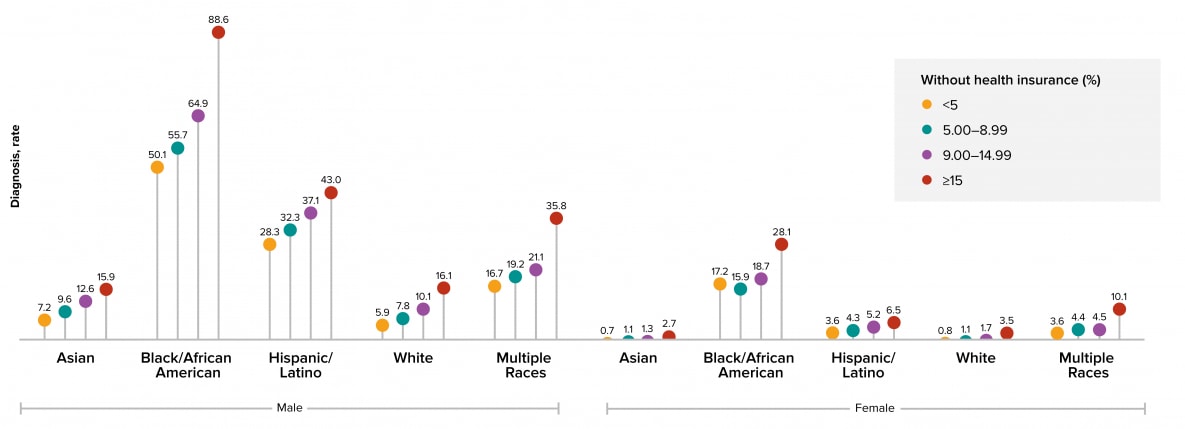
Note. Hispanics/Latinos can be of any race.
Transmission Category: Persons who lived in census tracts where 15% or more of the residents did not have health insurance coverage accounted for the largest percentage of HIV diagnoses for both sexes and in all transmission categories (Figure 12 and Table 3).
Figure 12. Diagnoses of HIV infection among adults, by transmission category, sex at birth, and health insurance coverage, 2018—census tract level, United States and Puerto Rico
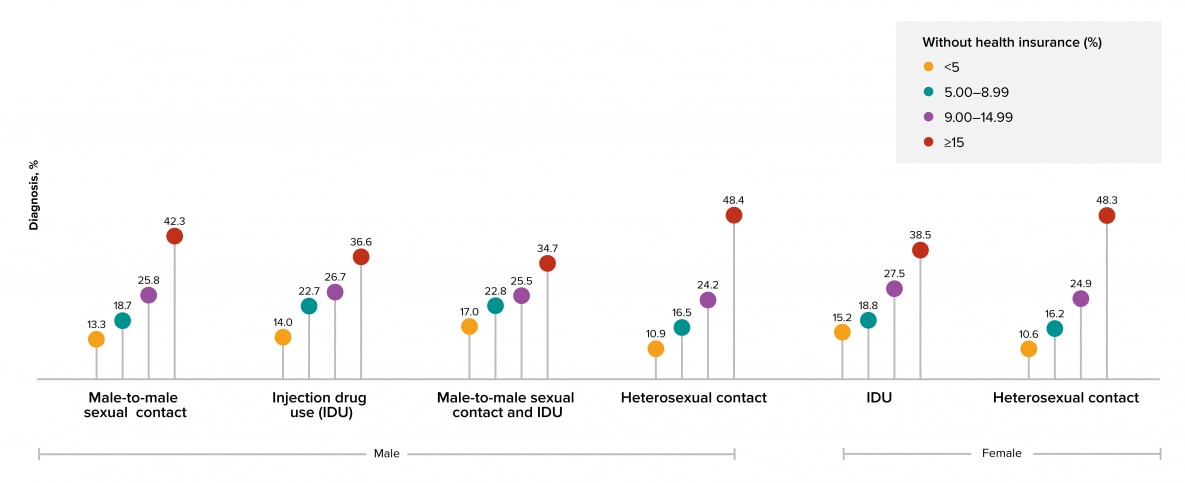
Note. Data have been statistically adjusted to account for missing transmission category. See Data Tables, Definitions, and Acronyms for more information on transmission categories.
Area of Residence: Among persons who lived in census tracts where 15% or more of the residents did not have health insurance coverage, the areas with the highest rates of HIV diagnoses were Maryland (total, 42.6; females, 27.2) and Florida for males (61.8), followed by Florida for total (39.1), Georgia for males (59.5), and Louisiana for females (18.7) (Table 7). Use caution when comparing the rates of diagnoses for the District of Columbia to the rates for states.
Linkage to Care: In 42 jurisdictions with complete reporting of laboratory data to CDC, overall, the lowest percentages of persons linked to HIV medical care ≤1 month after receiving a diagnosis in 2018 were among those who lived in census tracts with the 2 lowest health insurance coverage levels for both sexes (Table 9a). By race/ethnicity, the lowest percentages were among those who lived in census tracts with the lowest health insurance coverage for Black/African American males (74.7) and females (78.2%), Hispanic/Latino males (82.1%) and females (81.0%), and white males (82.1%) (Table 9a). By age group, the lowest percentages were among those who lived in census tracts with the lowest health insurance coverage for both sexes in all age groups (except for females aged ≥55 years) (Table 9b). By transmission category, the lowest percentages were among those who lived in census tracts with the lowest health insurance coverage for both sexes and all transmission categories (except for females with infection attributed to injection drug use) (Table 9c). Among males with infection attributed to male-to-male sexual contact by race/ethnicity, the lowest percentages were among males who lived in census tracts with the lowest health insurance coverage for Blacks/African Americans (75.2%), Hispanics/Latinos (82.5%), and whites (83.8%) (Table 9d).
Viral Suppression: In 42 jurisdictions with complete reporting of laboratory data to CDC, overall, the lowest percentages of viral suppression within 6 months of diagnosis among persons with HIV diagnosed during 2018 were among those who lived in census tracts with the lowest health insurance coverage for both males (64.9%) and females (63.8%) (Table 10a). By race/ethnicity, the lowest percentages were among those who lived in census tracts with the lowest health insurance coverage for both sexes in Blacks/African Americans, Hispanics/Latinos, and white males (Table 10a). By age group, the lowest percentages were among those who lived in census tracts with the lowest health insurance coverage for both sexes in all age groups (Table 10b). By transmission category, the lowest percentages were among those who lived in census tracts with the lowest health insurance coverage for both sexes and all transmission categories (Table 10c). Among males with infection attributed to male-to-male sexual contact by race/ethnicity, the lowest percentages were among males who lived in census tracts with the lowest health insurance coverage for Blacks/African Americans (59.7%), Hispanics/Latinos (71.7%), and whites (69.7%) (Table 10d).