Social Determinants of Health among Adults with Diagnosed HIV Infection, 2018: Figures

Figure 1. Diagnoses of HIV infection among adults, by age at diagnosis, sex at birth, and federal poverty status, 2018—census tract level, United States and Puerto Rico
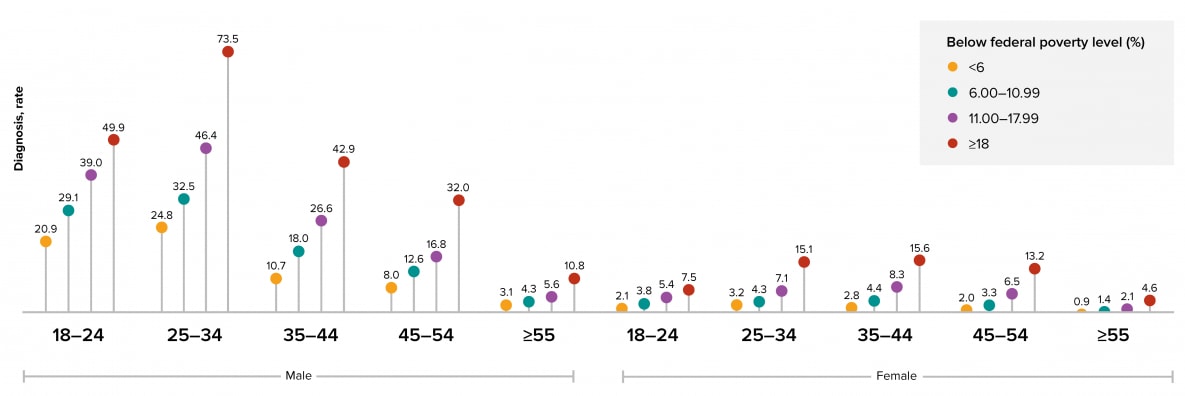
Figure 1: Persons who lived in census tracts where 18% or more of the residents lived below the federal poverty level accounted for the highest HIV diagnoses rates for both sexes in all age groups.

Figure 2. Diagnoses of HIV infection among adults, race/ethnicity, sex at birth, and federal poverty status, 2018—census tract level, United States and Puerto Rico
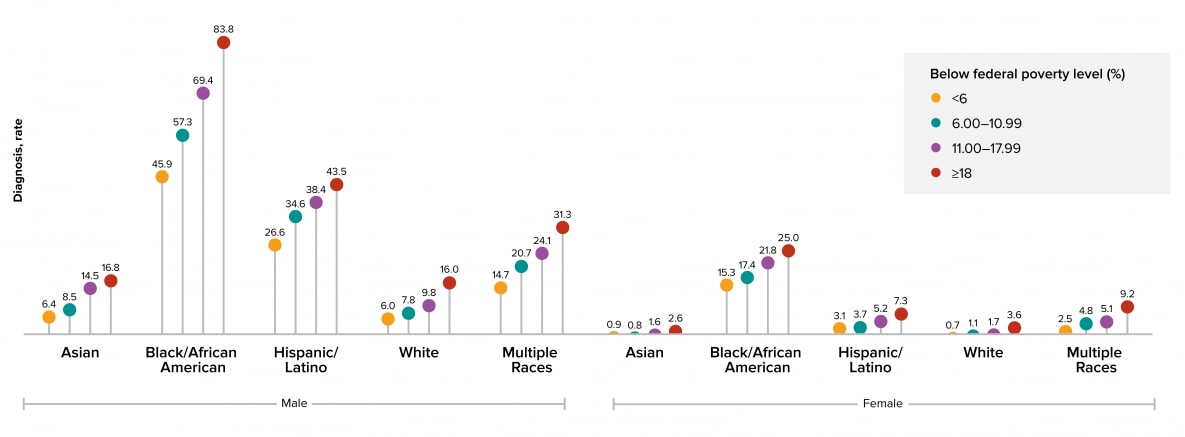
Figure 2: Persons who lived in census tracts where 18% or more of the residents lived below the federal poverty level accounted for the highest HIV diagnosis rates for both sexes in all racial/ethnic groups.

Note. Hispanics/Latinos can be of any race.

Figure 3. Diagnoses of HIV infection among adults, by transmission category, sex at birth, and federal poverty status, 2018—census tract level, United States and Puerto Rico
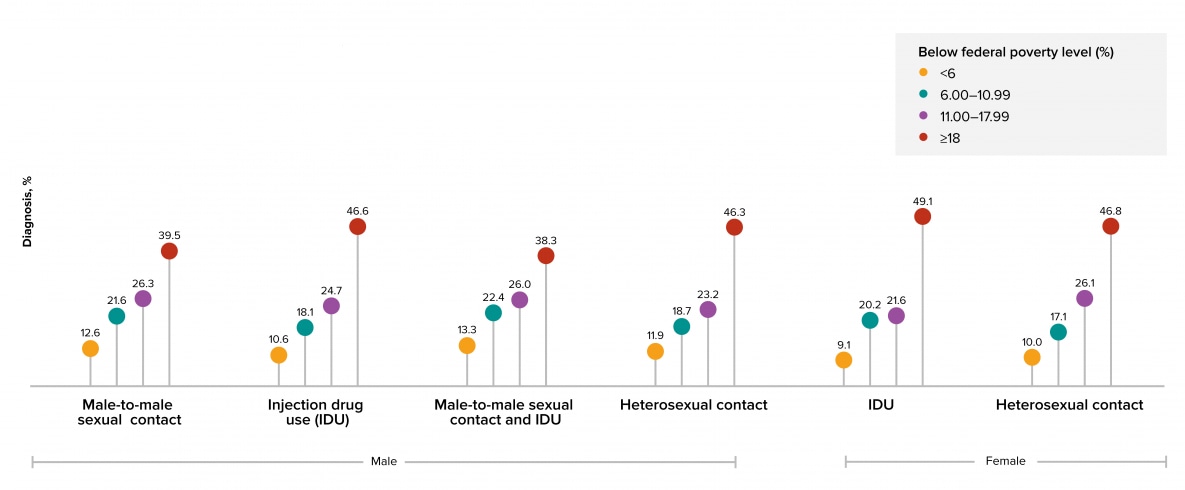
Figure 3: Persons who lived in census tracts where 18% or more of the residents lived below the federal poverty level accounted for the largest percentage of HIV diagnoses for both sexes and in all transmission categories.

Note. Data have been statistically adjusted to account for missing transmission category. See Data Tables, Definitions, and Acronyms for more information on transmission categories.

Figure 4. Diagnoses of HIV infection among adults, by age at diagnosis, sex at birth, and education status, 2018—census tract level, United States and Puerto Rico
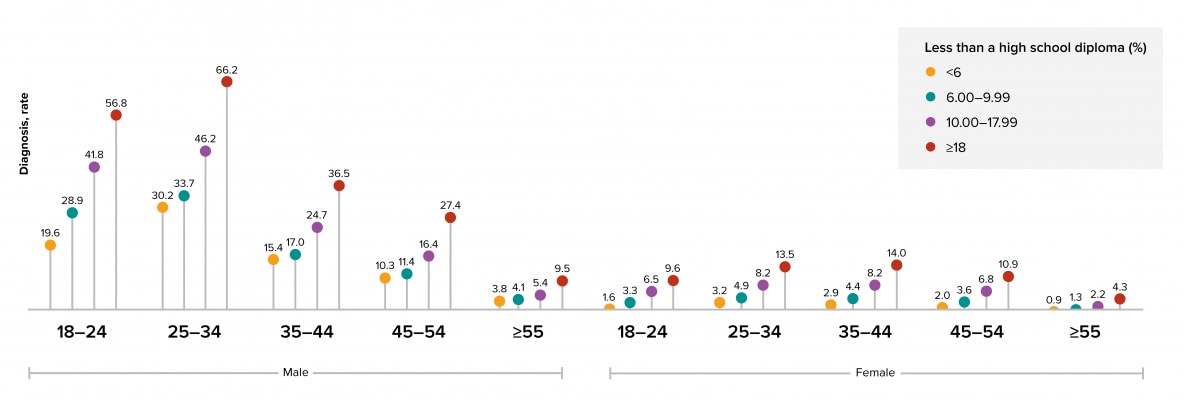
Figure 4: Persons who lived in census tracts where 18% or more of the residents had less than a high school diploma accounted for the highest HIV diagnoses rates for both sexes in all age groups.

Figure 5. Diagnoses of HIV infection among adults, by race/ethnicity, sex at birth, and education status, 2018—census tract level, United States and Puerto Rico
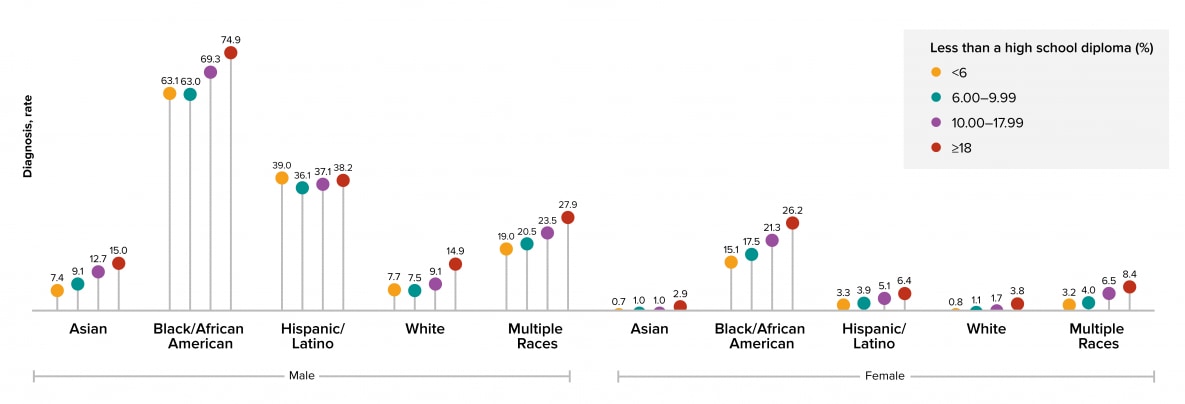
Figure 5: Persons who lived in census tracts where 18% or more of the residents had less than a high school diploma accounted for the highest HIV diagnosis rates for both sexes in all racial/ethnic groups.

Note. Hispanics/Latinos can be of any race.

Figure 6. Diagnoses of HIV infection among adults, by transmission category, sex at birth, and education status, 2018—census tract level, United States and Puerto Rico
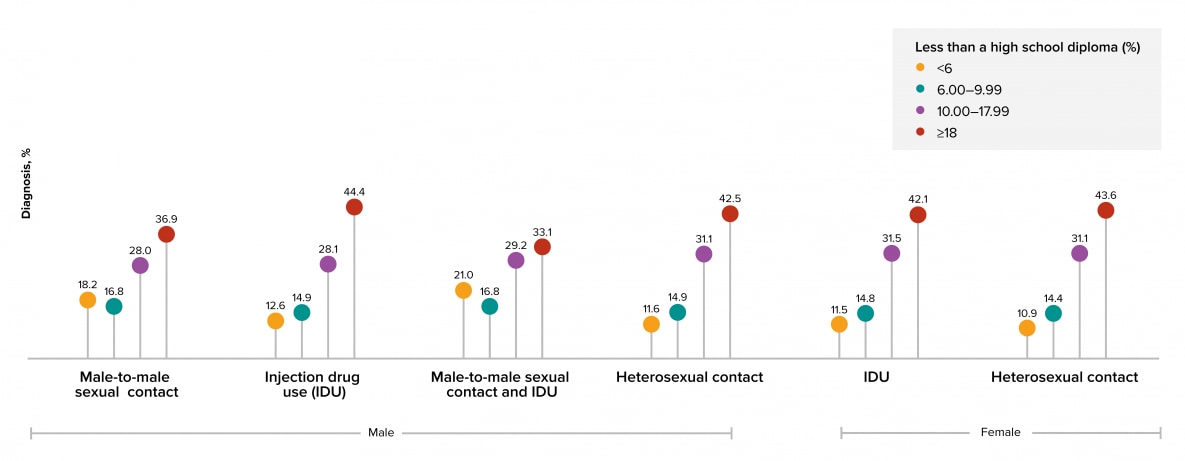
Figure 6: Persons who lived in census tracts where 18% or more of the residents had less than a high school diploma accounted for the largest percentage of HIV diagnoses for both sexes and in all transmission categories.

Note. Data have been statistically adjusted to account for missing transmission category. See Data Tables, Definitions, and Acronyms for more information on transmission categories.

Figure 7. Diagnoses of HIV infection among adults, by age at diagnosis, sex at birth, and income level, 2018—census tract level, United States and Puerto Rico
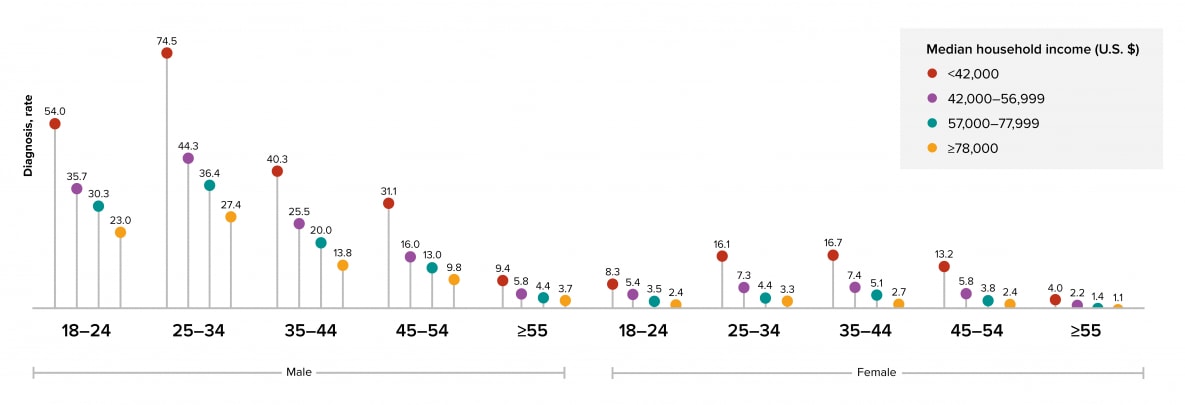
Figure 7: Persons who lived in census tracts where the median household income was less than $42,000 a year accounted for the highest HIV diagnoses rates for both sexes in all age groups.

Figure 8. Diagnoses of HIV infection among adults, by race/ethnicity, sex at birth, and income level, 2018—census tract level, United States and Puerto Rico
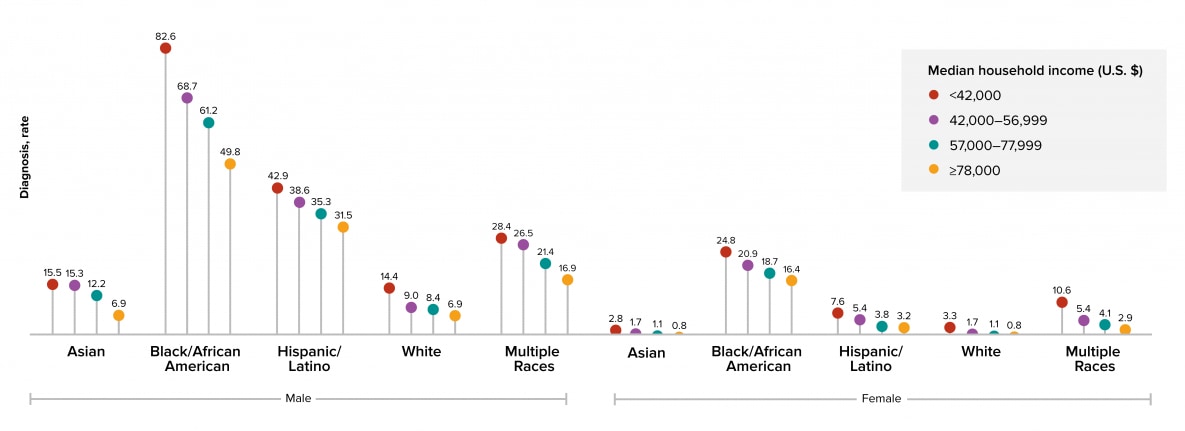
Figure 8: Persons who lived in census tracts where the median household income was less than $42,000 a year accounted for the highest HIV diagnosis rates for both sexes in all racial/ethnic groups.

Note. Hispanics/Latinos can be of any race.

Figure 9. Diagnoses of HIV infection among adults, by transmission category, sex at birth, and income level, 2018—census tract level, United States and Puerto Rico
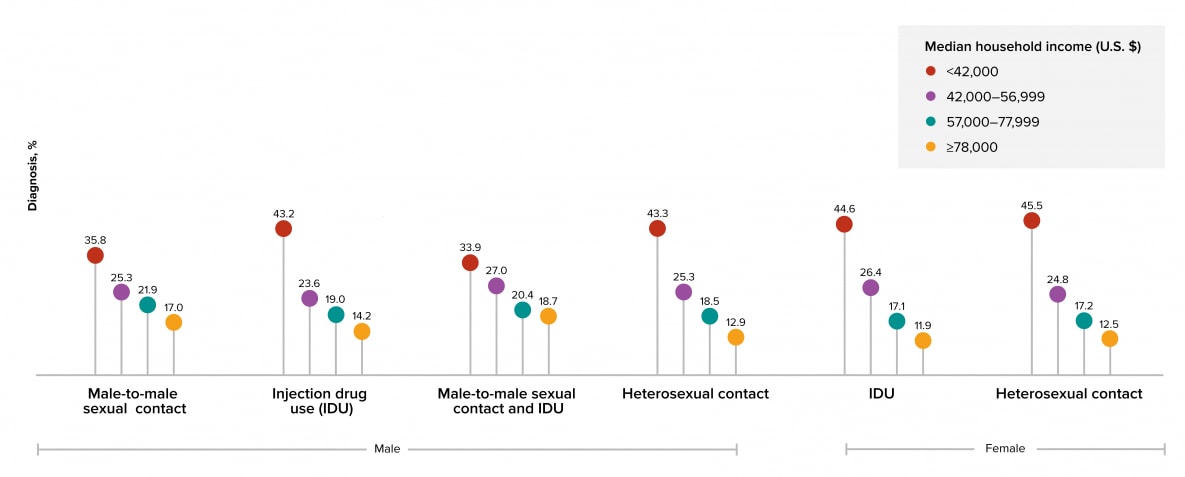
Figure 9: Persons who lived in census tracts where the median household income was less than $42,000 a year accounted for the largest percentage of HIV diagnoses for both sexes and in all transmission categories.

Note. Data have been statistically adjusted to account for missing transmission category. See Data Tables, Definitions, and Acronyms for more information on transmission categories.

Figure 10. Diagnoses of HIV infection among adults, by age at diagnosis, sex at birth, and health insurance coverage, 2018—census tract level, United States and Puerto Rico
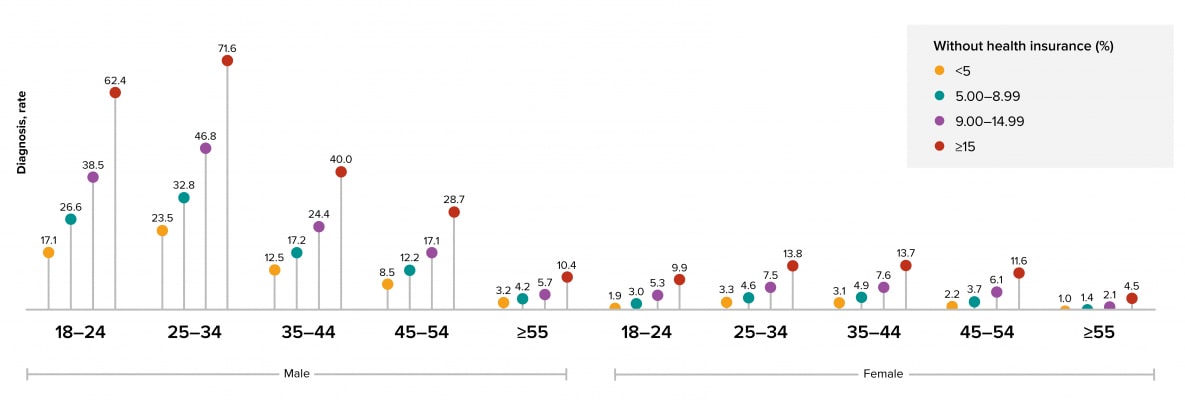
Figure 10: Persons who lived in census tracts where 15% or more of the residents did not have health insurance coverage accounted for the highest HIV diagnoses rates for both sexes in all age groups.

Figure 11. Diagnoses of HIV infection among adults, by race/ethnicity, sex at birth, and health insurance coverage, 2018—census tract level, United States and Puerto Rico
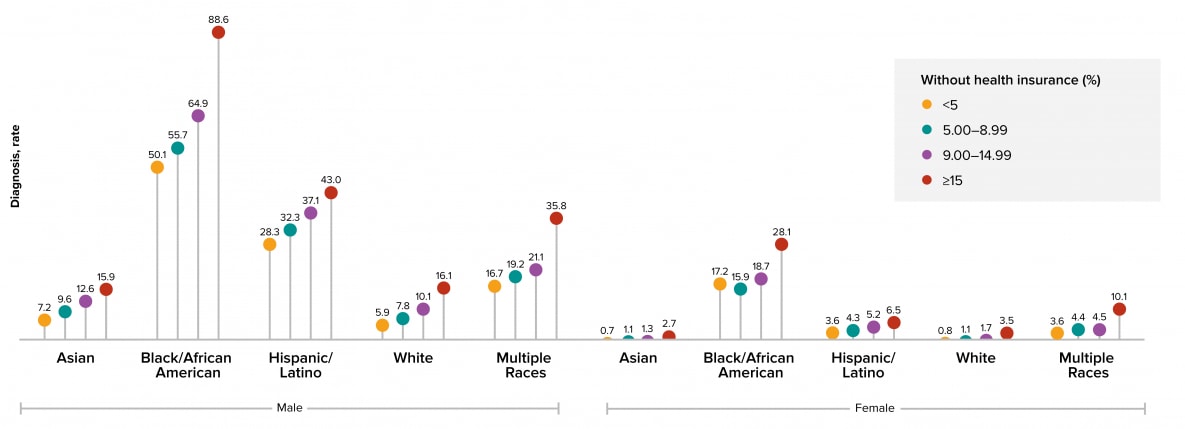
Figure 11: Persons who lived in census tracts where 15% or more of the residents did not have health insurance coverage accounted for the highest HIV diagnosis rates for both sexes in all racial/ethnic groups.

Note. Hispanics/Latinos can be of any race.

Figure 12. Diagnoses of HIV infection among adults, by transmission category, sex at birth, and health insurance coverage, 2018—census tract level, United States and Puerto Rico
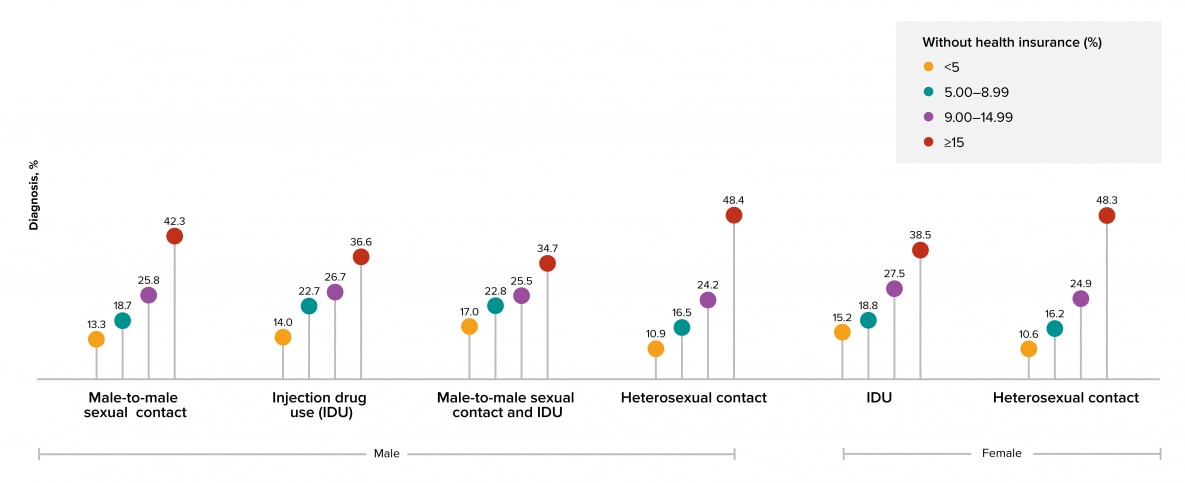
Figure 12: Persons who lived in census tracts where 15% or more of the residents did not have health insurance coverage accounted for the largest percentage of HIV diagnoses for both sexes and in all transmission categories.

Note. Data have been statistically adjusted to account for missing transmission category. See Data Tables, Definitions, and Acronyms for more information on transmission categories.

Figure 13. Disparities of diagnoses of HIV infection among adult males, by race/ethnicity and poverty status, 2018—census tract level, United States and Puerto Rico
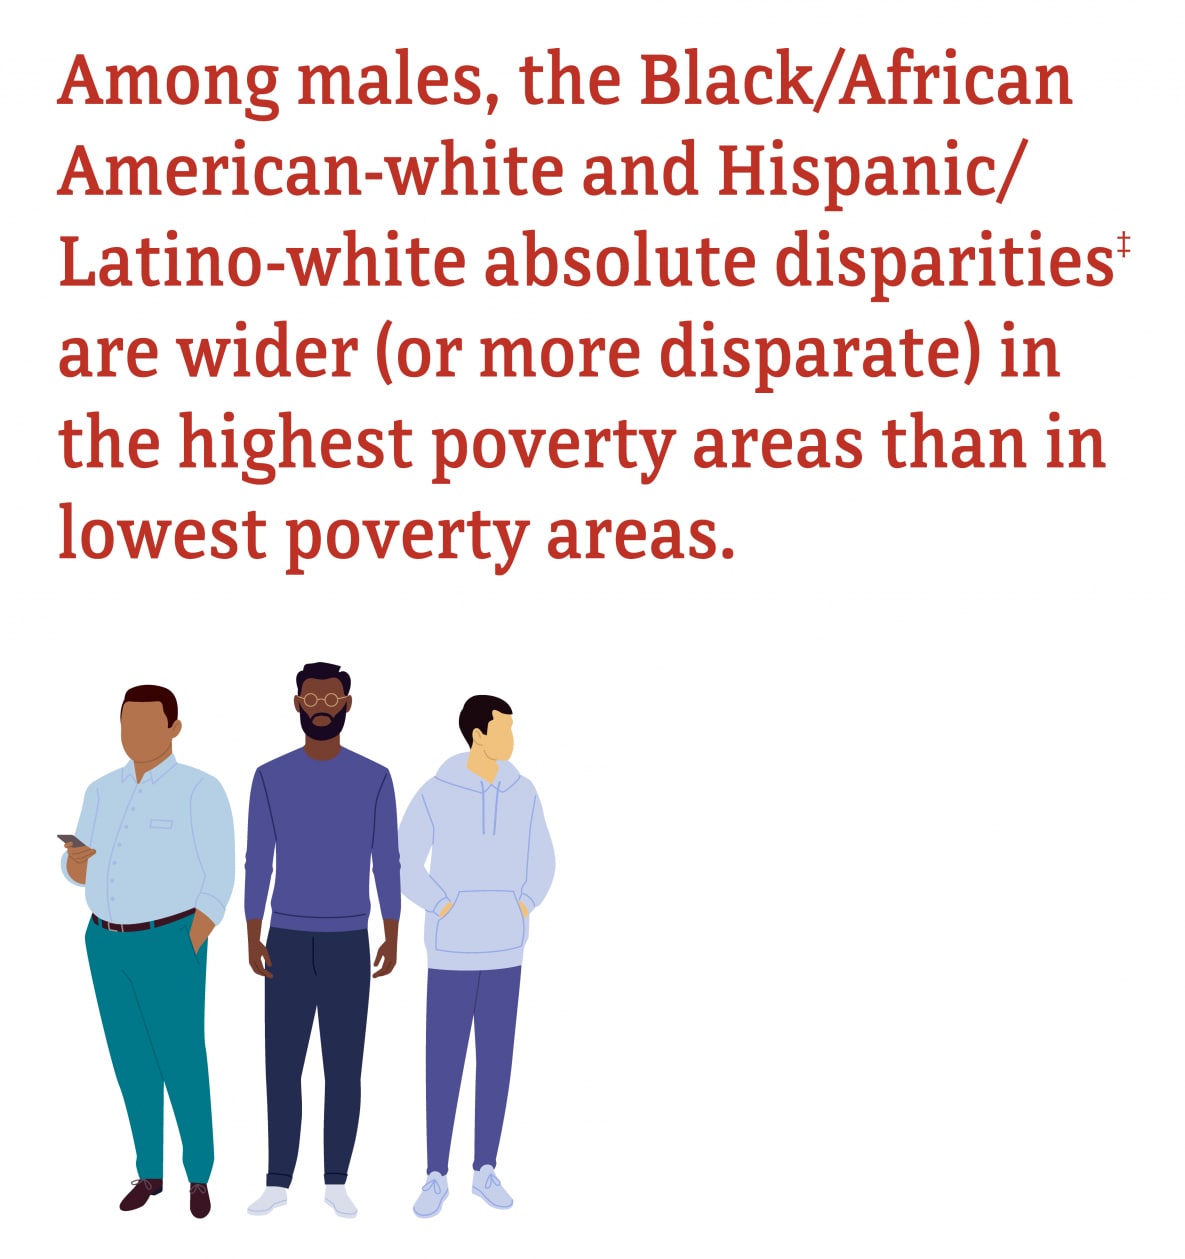
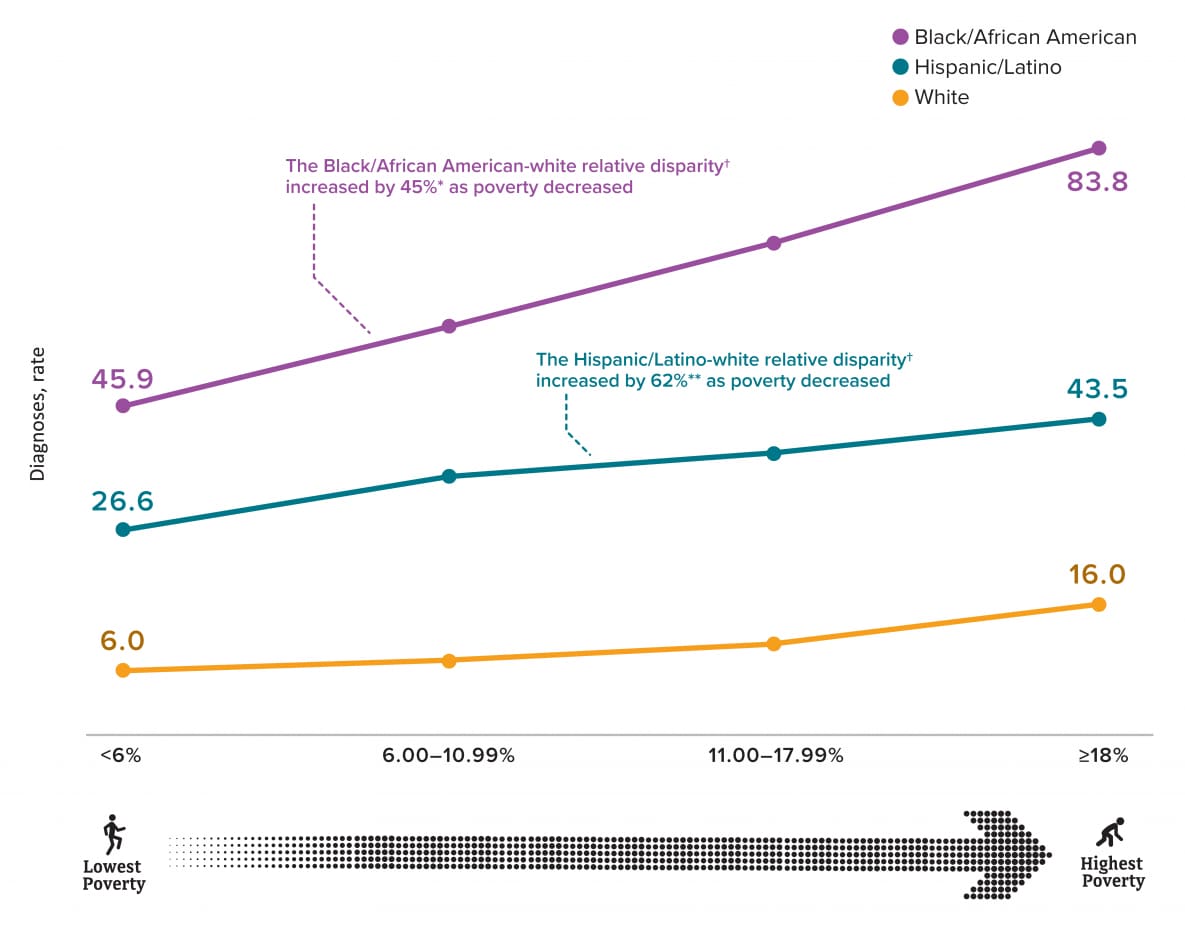
Figure 13: Among males residing in census tracts with the lowest poverty, HIV diagnosis rates in 2018 among Blacks/African Americans (45.9) and Hispanics/Latinos (26.6) were 7.6 times and 4.4 times, respectively, as high as the rate for whites (6.0). The Black/African American-white and Hispanic/Latino-white relative disparities increased by 45% and 62%, respectively, as percentages of poverty decreased. Whereas, the Black/African American-white and Hispanic/Latino-white absolute disparities were wider (or more disparate) in the highest poverty areas than in lowest poverty areas.
Note. Hispanics/Latinos can be of any race.
‡absolute disparity measures the difference between a group with the lowest rate and the group with the highest rate.
†relative disparity measures the ratio of the difference between the group rate and the overall population rate to the overall rate.
*45% increase is the lowest poverty disparity (45.9/6.0) compared to the highest poverty disparity (83.8/16.0).
**62% increase is the lowest poverty disparity (26.6/6.0) compared to the highest poverty disparity (43.5/16.0).

Figure 14. Disparities of diagnoses of HIV infection among adult females, by race/ethnicity and poverty status, 2018—census tract level, United States and Puerto Rico
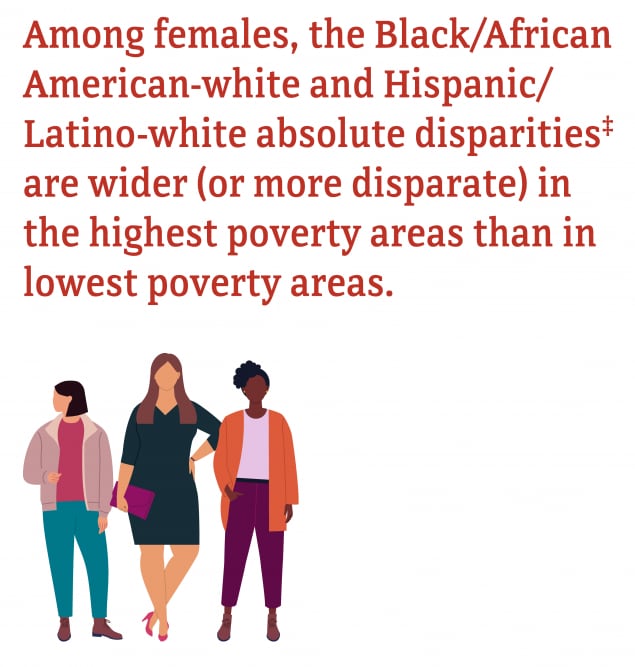
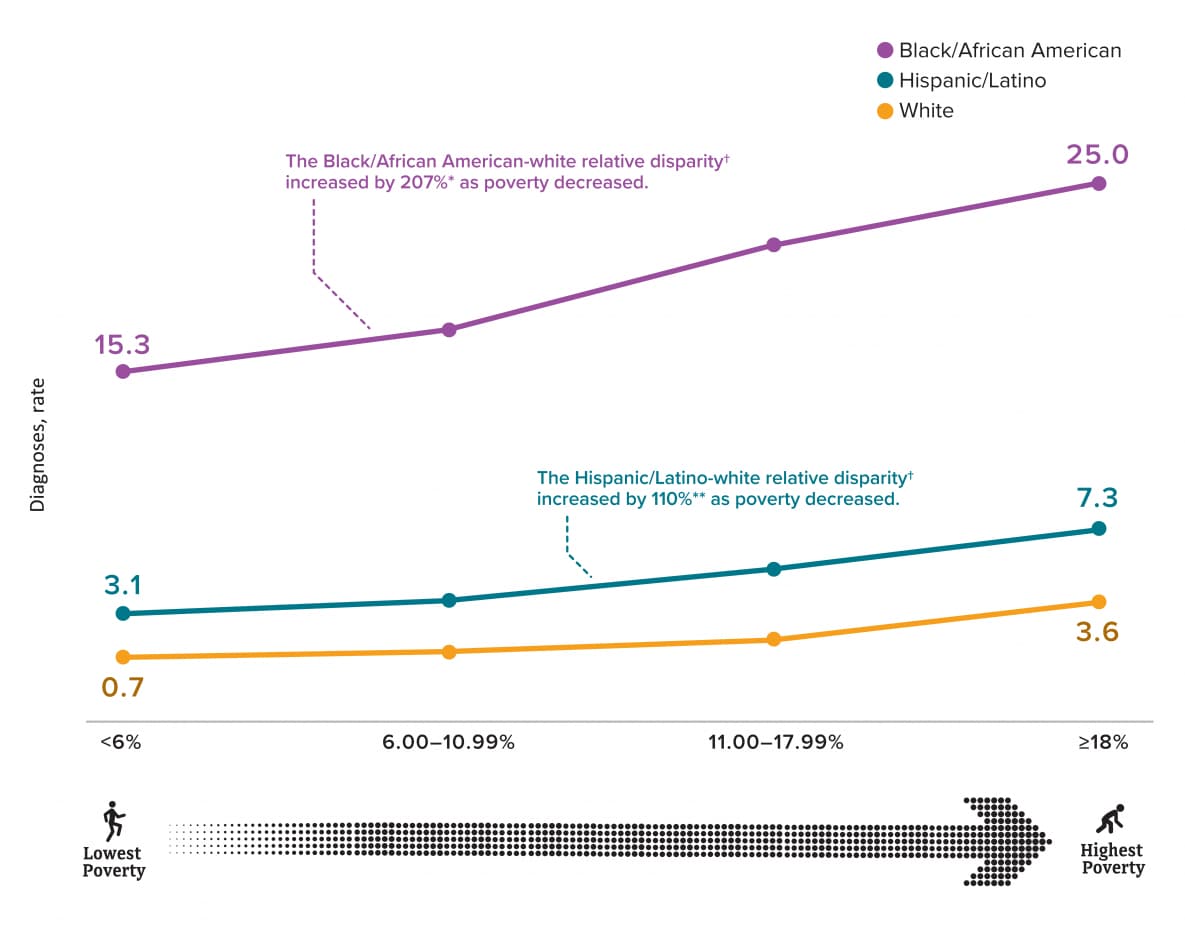
Among females residing in census tracts with the lowest poverty, HIV diagnosis rates among Blacks/African Americans (15.3) and Hispanics/Latinos (3.1) were 21.3 times and 4.3 times, respectively, as high as the rate for whites (0.7). The Black/African American-white and Hispanic/Latino-white relative disparities increased by 207percent and 110percent, respectively, as percentages of poverty decreased. Whereas, the Black/African American-white and Hispanic/Latino-white absolute disparities were wider (or more disparate) in the highest poverty areas than in lowest poverty areas.

Among females residing in census tracts with the lowest poverty, HIV diagnosis rates among Blacks/African Americans (15.3) and Hispanics/Latinos (3.1) were 21.3 times and 4.3 times, respectively, as high as the rate for whites (0.7). The Black/African American-white and Hispanic/Latino-white relative disparities increased by 207percent and 110percent, respectively, as percentages of poverty decreased. Whereas, the Black/African American-white and Hispanic/Latino-white absolute disparities were wider (or more disparate) in the highest poverty areas than in lowest poverty areas.

Note. Hispanics/Latinos can be of any race.
‡absolute disparity measures the difference between a group with the lowest rate and the group with the highest rate.
†relative disparity measures the ratio of the difference between the group rate and the overall population rate to the overall rate.
*207% increase is the lowest poverty disparity (15.3/0.7) compared to the highest poverty disparity (25.0/3.6).
**110% increase is the lowest poverty disparity (3.1/0.7) compared to the highest poverty disparity (7.3/3.6).

Figure 15. Disparities of diagnoses of HIV infection among adult males, by race/ethnicity and education status, 2018—census tract level, United States and Puerto Rico
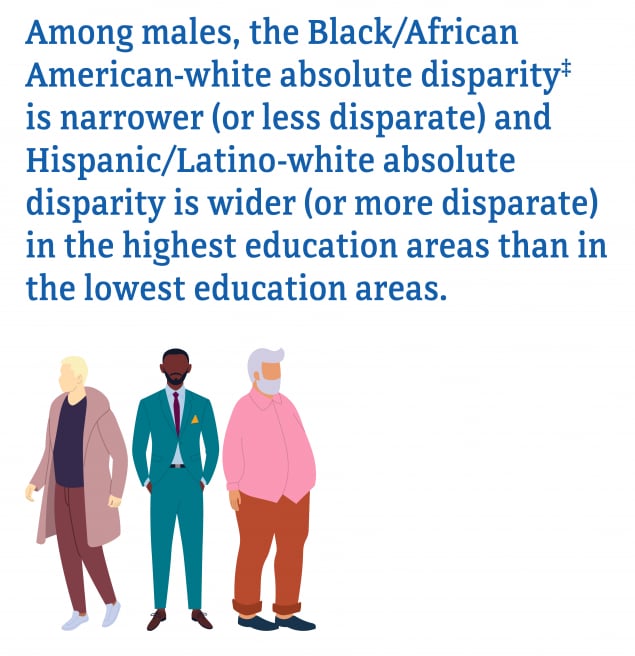
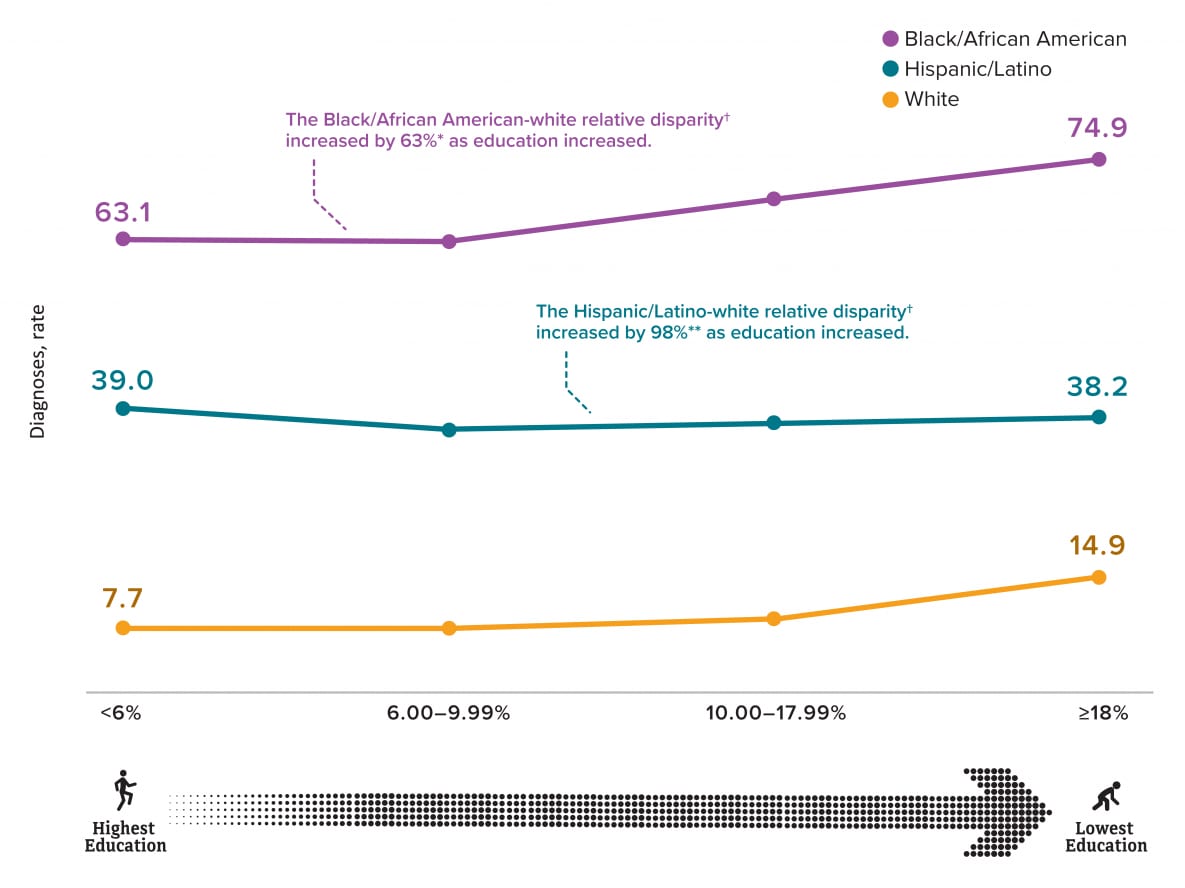
Figure 15:  Among males residing in census tracts with the highest education, HIV diagnosis rates among Blacks/African Americans (63.1) and Hispanics/Latinos (39.0) were 8.2 times and 5.1 times, respectively, as high as the rate for whites (7.7). he Black/African American-white and Hispanic/Latino-white relative disparities increased by 63 percent and 98 percent, respectively, as percentages of education increased. Whereas, the Black/African American-white absolute disparity was narrower (or less disparate) and Hispanic/Latino-white absolute disparity was wider (or more disparate) in the highest education areas than in the lowest education areas.

Figure 15: Among males residing in census tracts with the highest education, HIV diagnosis rates among Blacks/African Americans (63.1) and Hispanics/Latinos (39.0) were 8.2 times and 5.1 times, respectively, as high as the rate for whites (7.7). he Black/African American-white and Hispanic/Latino-white relative disparities increased by 63 percent and 98 percent, respectively, as percentages of education increased. Whereas, the Black/African American-white absolute disparity was narrower (or less disparate) and Hispanic/Latino-white absolute disparity was wider (or more disparate) in the highest education areas than in the lowest education areas.

Note. Hispanics/Latinos can be of any race.
‡absolute disparity measures the difference between a group with the lowest rate and the group with the highest rate.
†relative disparity measures the ratio of the difference between the group rate and the overall population rate to the overall rate.
*63% increase is the lowest education disparity (74.9/14.9) compared to the highest education disparity (63.1/7.7).
**98% increase is the lowest education disparity (38.2/14.9) compared to the highest education disparity (39.0/7.7).

Figure 16. Disparities of diagnoses of HIV infection among adult females, by race/ethnicity and education status, 2018—census tract level, United States and Puerto Rico
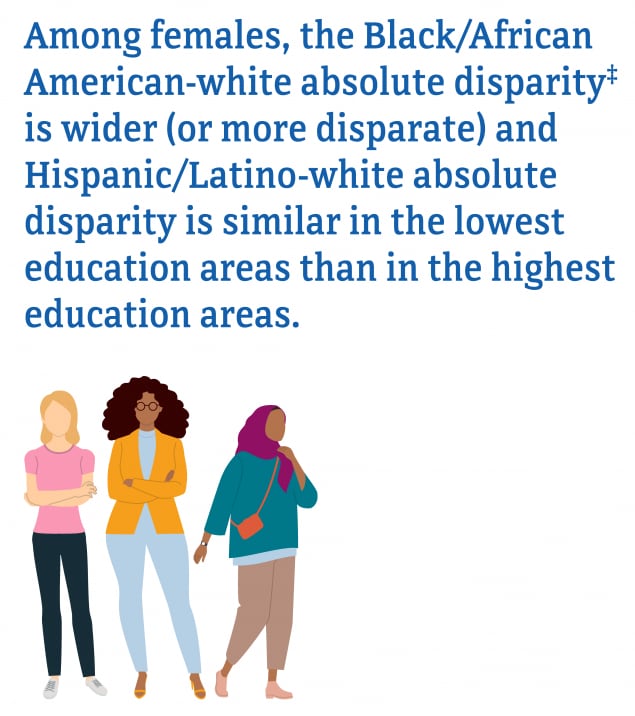
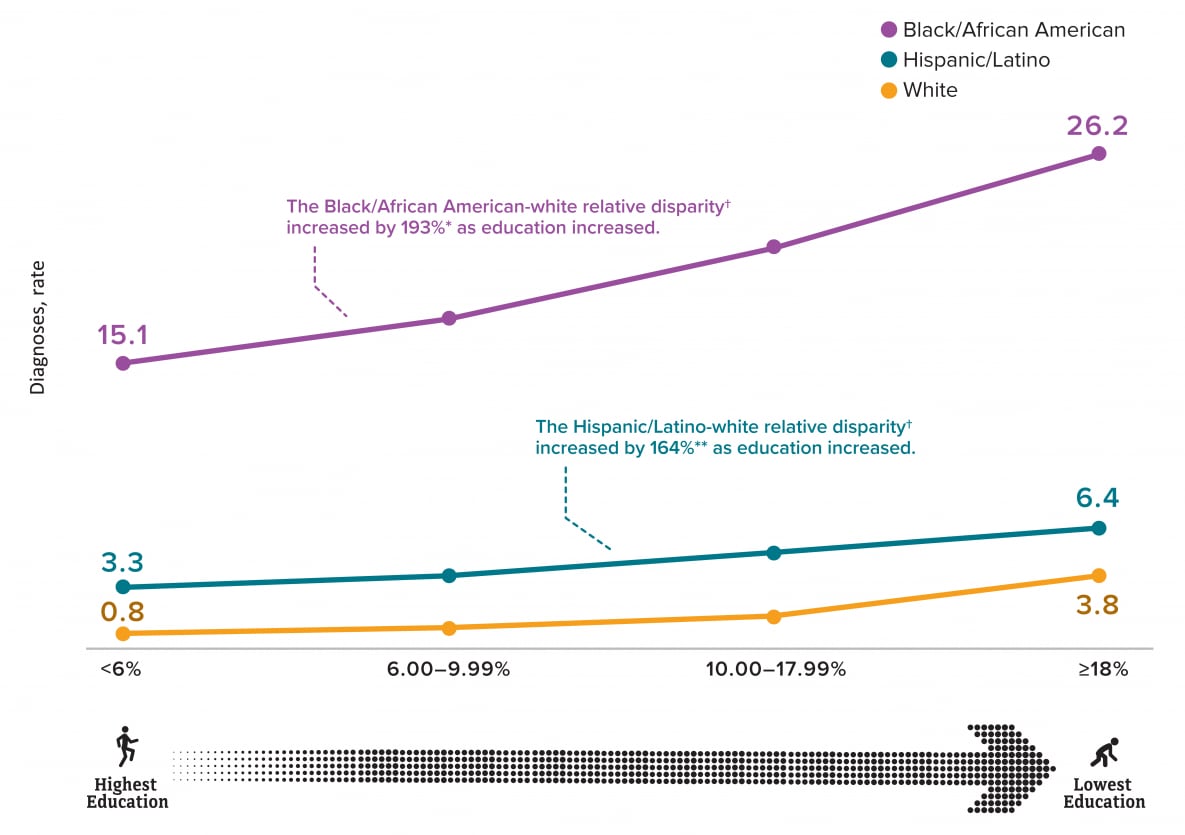
Figure 16: Among females residing in census tracts with the highest education, HIV diagnosis rates among Blacks/African Americans (15.1) and Hispanics/Latinos. The Black/African American-white and Hispanic/Latino-white relative disparities increased by 193 percent and 164 percent, respectively, as percentages of education increased. Whereas, the Black/African American-white absolute disparity was wider (or more disparate) and Hispanic/Latino-white absolute disparity was similar in the lowest education areas than in the highest education areas.

Figure 16: Among females residing in census tracts with the highest education, HIV diagnosis rates among Blacks/African Americans (15.1) and Hispanics/Latinos. The Black/African American-white and Hispanic/Latino-white relative disparities increased by 193 percent and 164 percent, respectively, as percentages of education increased. Whereas, the Black/African American-white absolute disparity was wider (or more disparate) and Hispanic/Latino-white absolute disparity was similar in the lowest education areas than in the highest education areas.

Note. Hispanics/Latinos can be of any race.
‡absolute disparity measures the difference between a group with the lowest rate and the group with the highest rate.
†relative disparity measures the ratio of the difference between the group rate and the overall population rate to the overall rate.
*193% increase is the lowest education disparity (26.2/3.8) compared to the highest education disparity (15.1/0.8).
**164% increase is the lowest education disparity (6.4/3.8) compared to the highest education disparity (3.3/0.8).

Figure 17. Disparities of diagnoses of HIV infection among adult males, by race/ethnicity and income level, 2018—census tract level, United States and Puerto Rico
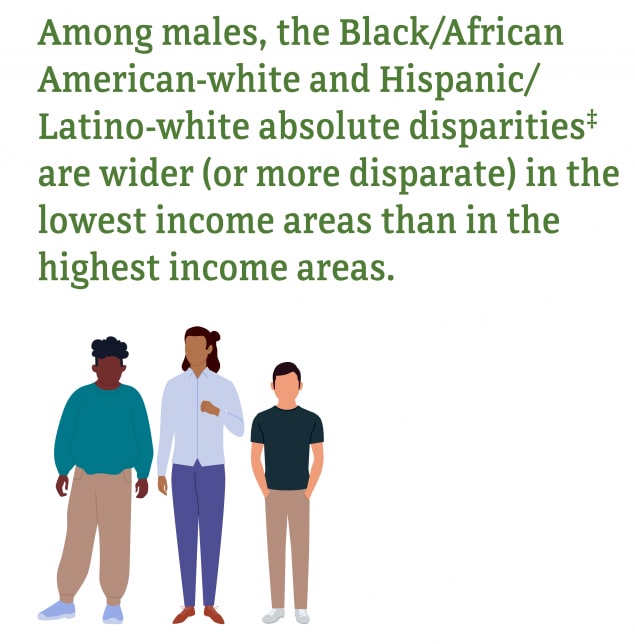
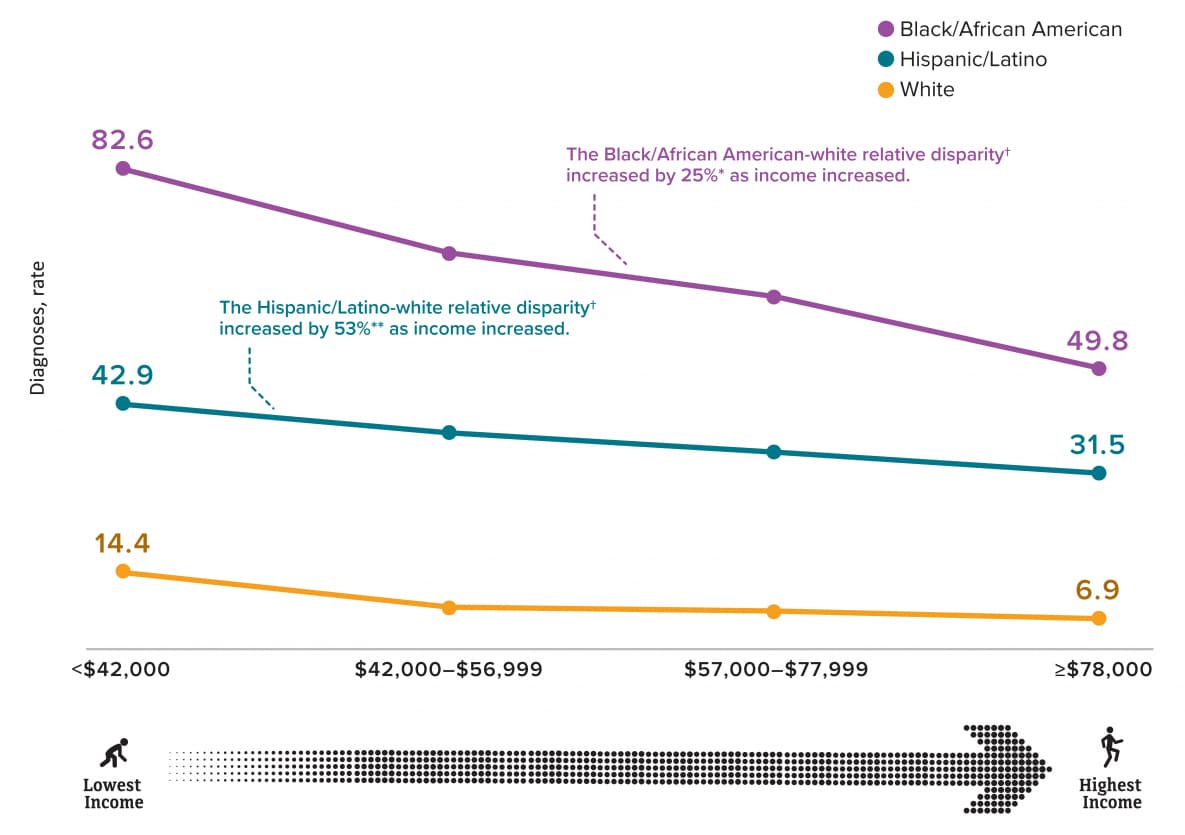
Figure 17: Among males residing in census tracts with the lowest income, HIV diagnosis rates among Blacks/African Americans (82.6) and Hispanics/Latinos (42.9) was 3.0 times and 5.8 times, respectively, as high as the rate for whites (14.4). The Black/African American-white and Hispanic/Latino-white relative disparities increased by 25 percent and 53 percent, respectively, as percentages of income increased. Whereas, the Black/African American-white and Hispanic/Latino-white absolute disparities were wider (or more disparate) in the lowest income areas than in the highest income areas.

Figure 17: Among males residing in census tracts with the lowest income, HIV diagnosis rates among Blacks/African Americans (82.6) and Hispanics/Latinos (42.9) was 3.0 times and 5.8 times, respectively, as high as the rate for whites (14.4). The Black/African American-white and Hispanic/Latino-white relative disparities increased by 25 percent and 53 percent, respectively, as percentages of income increased. Whereas, the Black/African American-white and Hispanic/Latino-white absolute disparities were wider (or more disparate) in the lowest income areas than in the highest income areas.

Note. Hispanics/Latinos can be of any race.
‡absolute disparity measures the difference between a group with the lowest rate and the group with the highest rate.
†relative disparity measures the ratio of the difference between the group rate and the overall population rate to the overall rate.
*25% increase is the lowest income disparity (82.6/14.4) compared to the highest income disparity (49.8/6.9).
**53% increase is the lowest income disparity (42.9/14.4) compared to the highest income disparity (31.5/6.9).

Figure 18. Disparities of diagnoses of HIV infection among adult females, by race/ethnicity and income level, 2018—census tract level, United States and Puerto Rico
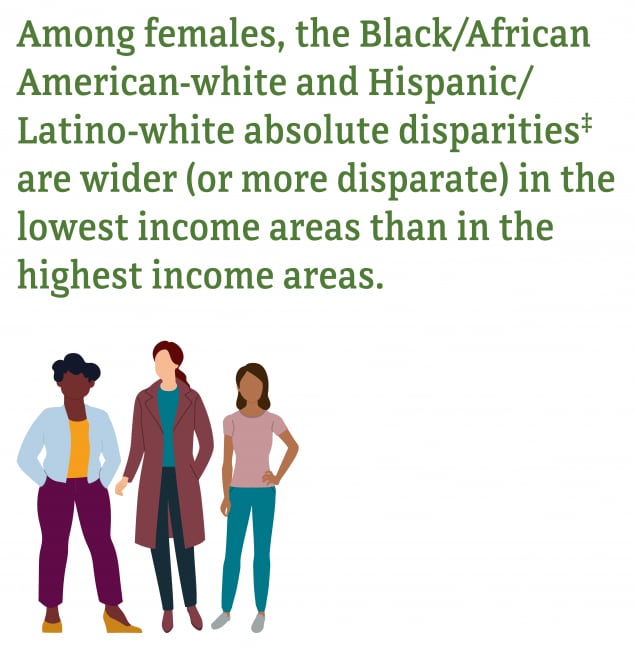
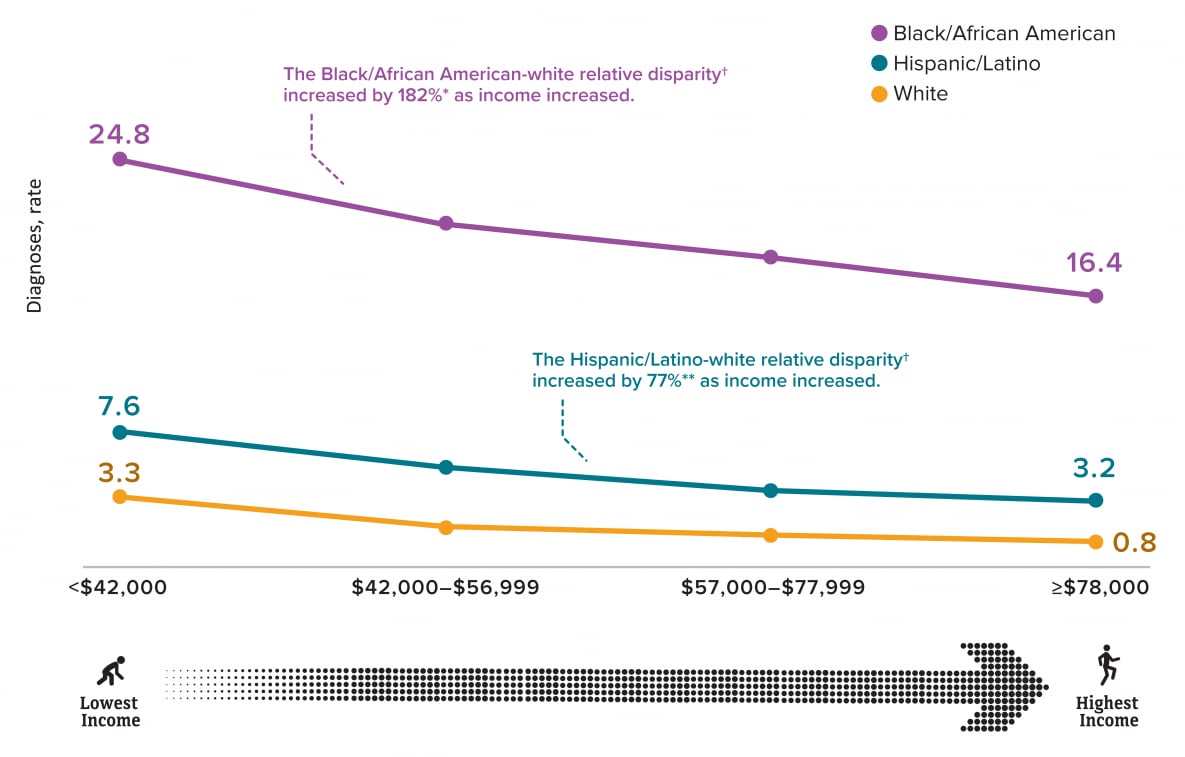
Figure 18: Among females residing in census tracts with the lowest income, HIV diagnosis rates among Blacks/African Americans (24.8) and Hispanics/Latinos (7.6) was 7.5 times and 2.3 times, respectively, as high as the rate for whites (3.3). The Black/African American-white and Hispanic/Latino-white relative disparities increased by 182% and 77%, respectively, as percentages of income increased. Whereas, the Black/African American-white and Hispanic/Latino-white absolute disparities were wider (or more disparate) in the lowest income areas than in the highest income areas.
Note. Hispanics/Latinos can be of any race.
‡absolute disparity measures the difference between a group with the lowest rate and the group with the highest rate.
†relative disparity measures the ratio of the difference between the group rate and the overall population rate to the overall rate.
*182% increase is the lowest income disparity (24.8/3.3) compared to the highest income disparity (16.4/0.8).
**77% increase is the lowest income disparity (7.6/3.3) compared to the highest income disparity (3.2/0.8).

Figure 19. Disparities of diagnoses of HIV infection among adult males, by race/ethnicity and health insurance coverage, 2018—census tract level, United States and Puerto Rico
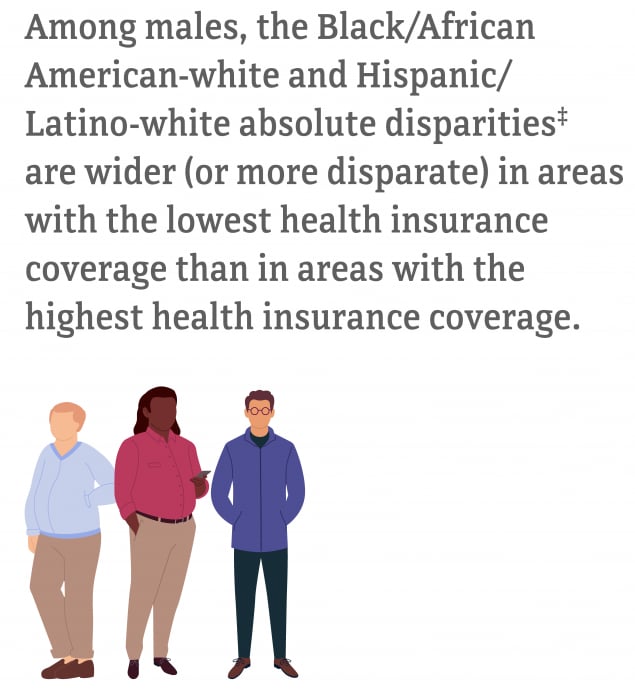
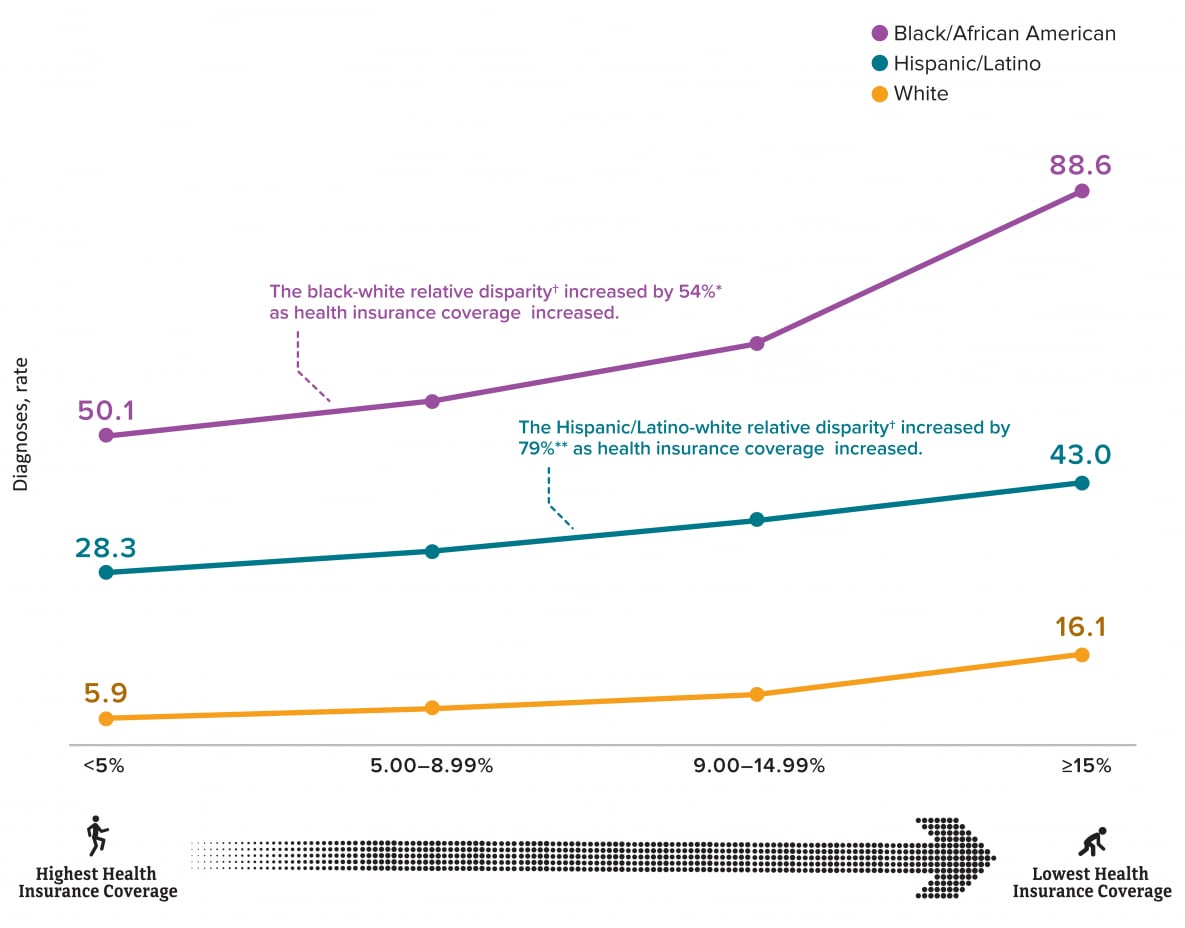
Figure 19: Among males residing in census tracts with the highest health insurance coverage, HIV diagnosis rates among Blacks/African Americans (50.1) and Hispanics/Latinos (28.3) was 8.5 times and 4.8 times, respectively, as high as the rate for whites (5.9). The Black/African American-white and Hispanic/Latino-white relative disparities increased by 54 percent and 79 percent, respectively, as percentages of health insurance coverage increased. Whereas, the Black/African American-white and Hispanic/Latino-white absolute disparities were wider (or more disparate) in areas with the lowest health insurance coverage than in areas with the highest health insurance coverage.

Figure 19: Among males residing in census tracts with the highest health insurance coverage, HIV diagnosis rates among Blacks/African Americans (50.1) and Hispanics/Latinos (28.3) was 8.5 times and 4.8 times, respectively, as high as the rate for whites (5.9). The Black/African American-white and Hispanic/Latino-white relative disparities increased by 54 percent and 79 percent, respectively, as percentages of health insurance coverage increased. Whereas, the Black/African American-white and Hispanic/Latino-white absolute disparities were wider (or more disparate) in areas with the lowest health insurance coverage than in areas with the highest health insurance coverage.

Note. Hispanics/Latinos can be of any race.
absolute disparity measures the diff­erence between a group with the lowest rate and the group with the highest rate.
relative disparity measures the ratio of the di­fference between the group rate and the overall population rate to the overall rate.
*54% increase is the lowest health insurance coverage (88.6/16.1) compared to the highest health insurance coverage (50.1/5.9).
**79% increase is the lowest health insurance coverage (43.0/16.1) compared to the highest health insurance coverage (28.3/5.9).

Figure 20. Disparities of diagnoses of HIV infection among adult males, by race/ethnicity and health insurance coverage, 2018—census tract level, United States and Puerto Rico
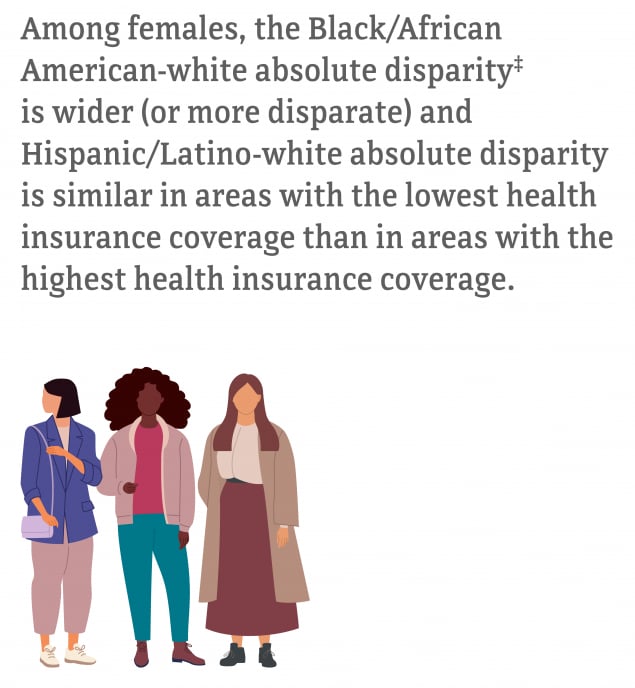
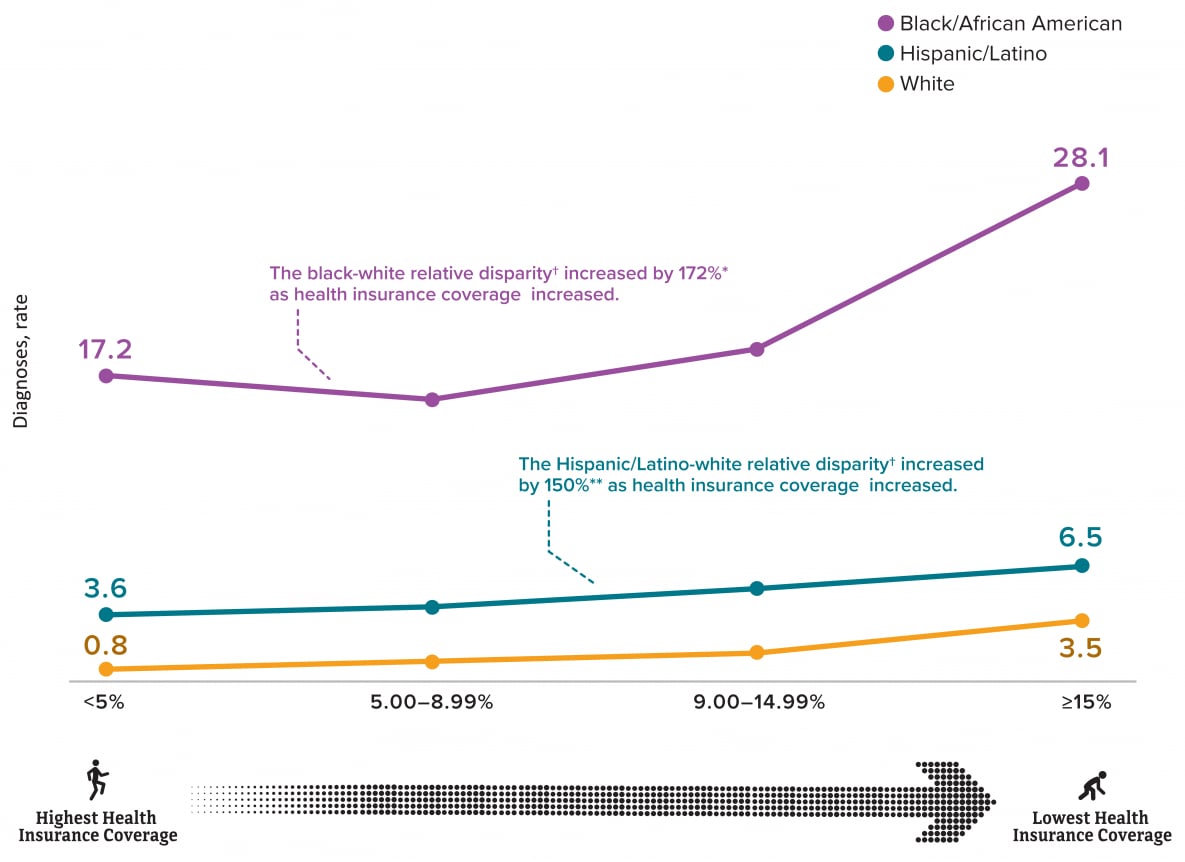
Figure 20: Among females residing in census tracts with the highest health insurance coverage, HIV diagnosis rates among Blacks/African Americans (17.2) and Hispanics/Latinos (3.6) was 4.7 times and 22.1 times, respectively, as high as the rate for whites (0.8). The Black/African American-white and Hispanic/Latino-white relative disparities increased by 172 percent and 150 percent, respectively, as percentages of health insurance coverage increased. Whereas, the Black/African American-white absolute disparity was wider (or more disparate) and Hispanic/Latino-white absolute disparity was similar in are-as with the lowest health insurance coverage than in areas with the highest health insurance coverage.

Figure 20: Among females residing in census tracts with the highest health insurance coverage, HIV diagnosis rates among Blacks/African Americans (17.2) and Hispanics/Latinos (3.6) was 4.7 times and 22.1 times, respectively, as high as the rate for whites (0.8). The Black/African American-white and Hispanic/Latino-white relative disparities increased by 172 percent and 150 percent, respectively, as percentages of health insurance coverage increased. Whereas, the Black/African American-white absolute disparity was wider (or more disparate) and Hispanic/Latino-white absolute disparity was similar in are-as with the lowest health insurance coverage than in areas with the highest health insurance coverage.

Note. Hispanics/Latinos can be of any race.
‡absolute disparity measures the difference between a group with the lowest rate and the group with the highest rate.
†relative disparity measures the ratio of the difference between the group rate and the overall population rate to the overall rate.
*172% increase is the lowest health insurance coverage (28.1/3.5) compared to the highest health insurance coverage (17.2/0.8).
**150% increase is the lowest health insurance coverage (6.5/3.5) compared to the highest health insurance coverage (3.6/0.8).

Figure 21. Diagnoses of HIV infection among adults, race/ethnicity, sex at birth, and Gini index, 2018—census tract level, United States and Puerto Rico

Figure 21: Persons who lived in census tracts where income inequality was 46% or more accounted for the highest HIV diagnoses rates in all age groups for both sexes

Note. Hispanics/Latinos can be of any race

Figure 22. Diagnoses of HIV infection among adults, age group, sex at birth, and Gini index, 2018—census tract level, United States and Puerto Rico

Figure 22: Persons who lived in census tracts where income inequality was 46 percent or more accounted for the highest HIV diagnosis rates for both sexes in all racial/ethnic groups

Figure 23. Diagnoses of HIV infection among adults, by transmission category, sex at birth, and Gini index, 2018—census tract level, United States and Puerto Rico
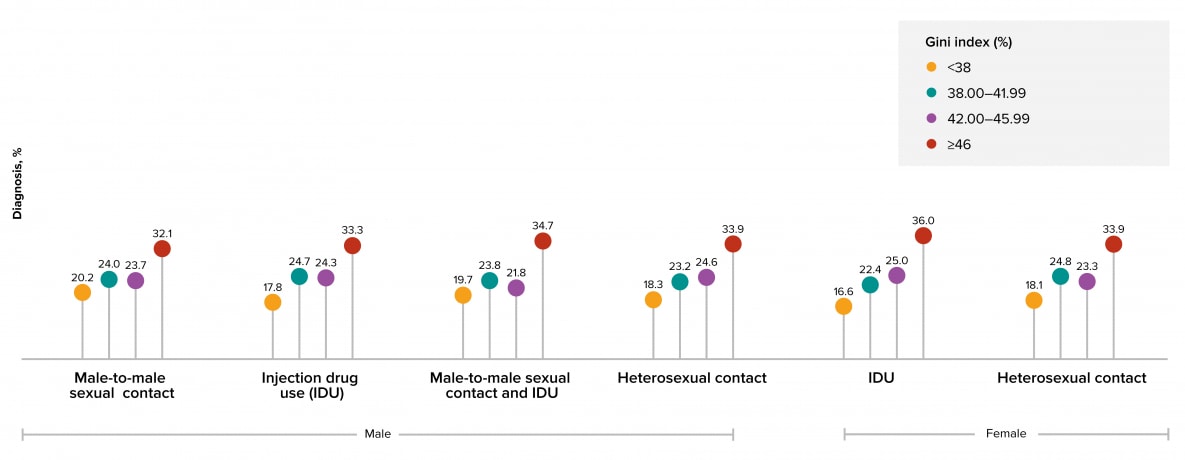
Figure 23: Persons who lived in census tracts where income inequality was 46 percent or more accounted for the largest percentage of HIV diagnoses for both sexes and in all transmission categories

Note: Data have been statistically adjusted to account for missing transmission category. See Data Tables, Definitions, and Acronyms for more information on transmission categories.

Figure 24. Disparities of diagnoses of HIV infection among adults, by sex at birth and Gini index, 2018—census tract level, United States and Puerto Rico
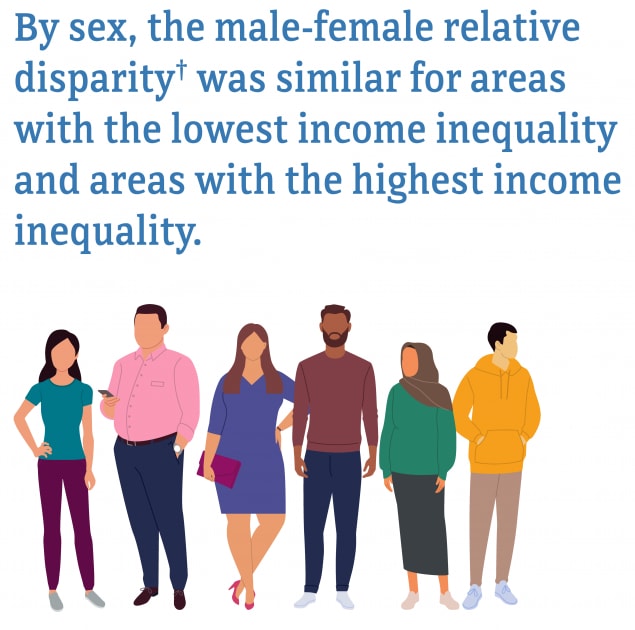
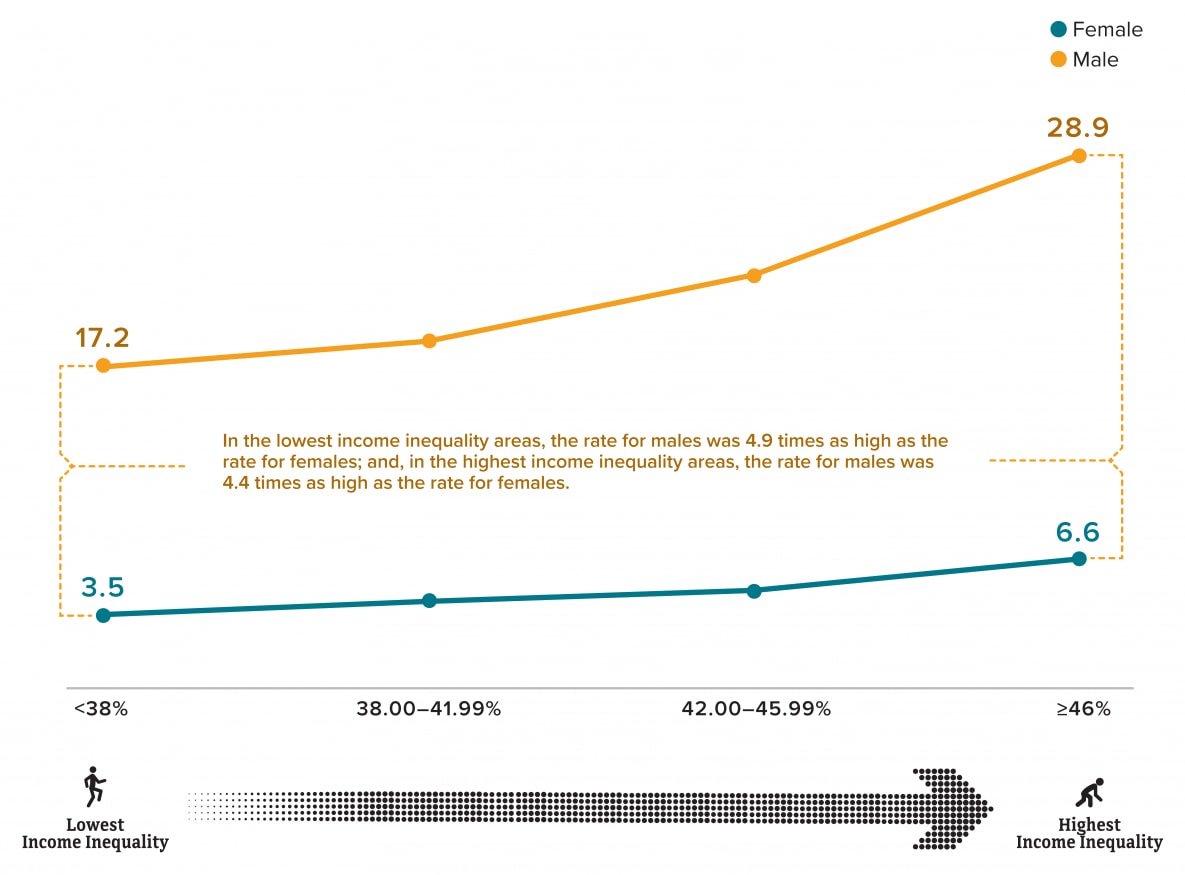
Figure 24: Among those residing in census tracts with the highest income inequality, the HIV diagnoses rate among males (28.9) was 4.4 times as high as the rate for females (6.6); and in census tracts with the lowest income inequality, the diagnoses rate among males (17.2) was 4.9 times as high as the rate for females (3.5). By sex, the male-female relative disparity† was similar for areas with the lowest income inequality and areas with the highest income inequality.

Figure 24: Among those residing in census tracts with the highest income inequality, the HIV diagnoses rate among males (28.9) was 4.4 times as high as the rate for females (6.6); and in census tracts with the lowest income inequality, the diagnoses rate among males (17.2) was 4.9 times as high as the rate for females (3.5). By sex, the male-female relative disparity† was similar for areas with the lowest income inequality and areas with the highest income inequality.

†relative disparity measures the ratio of the difference between the group rate and the overall population rate to the overall rate.

Figure 25. Disparities of diagnoses of HIV infection among adult males, by race/ethnicity and Gini index, 2018—census tract level, United States and Puerto Rico
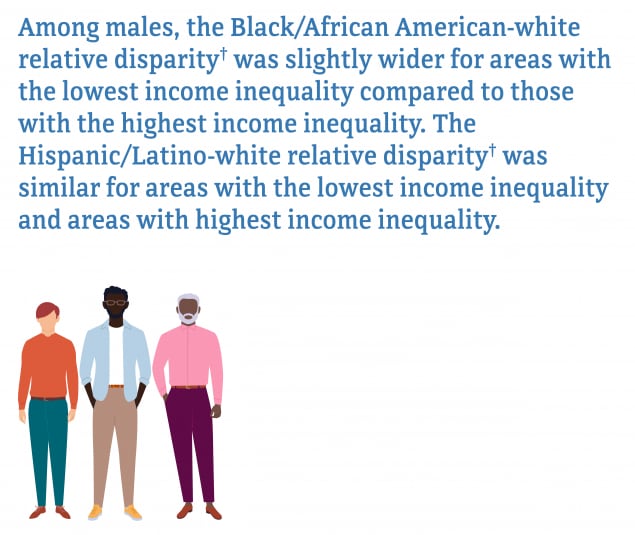
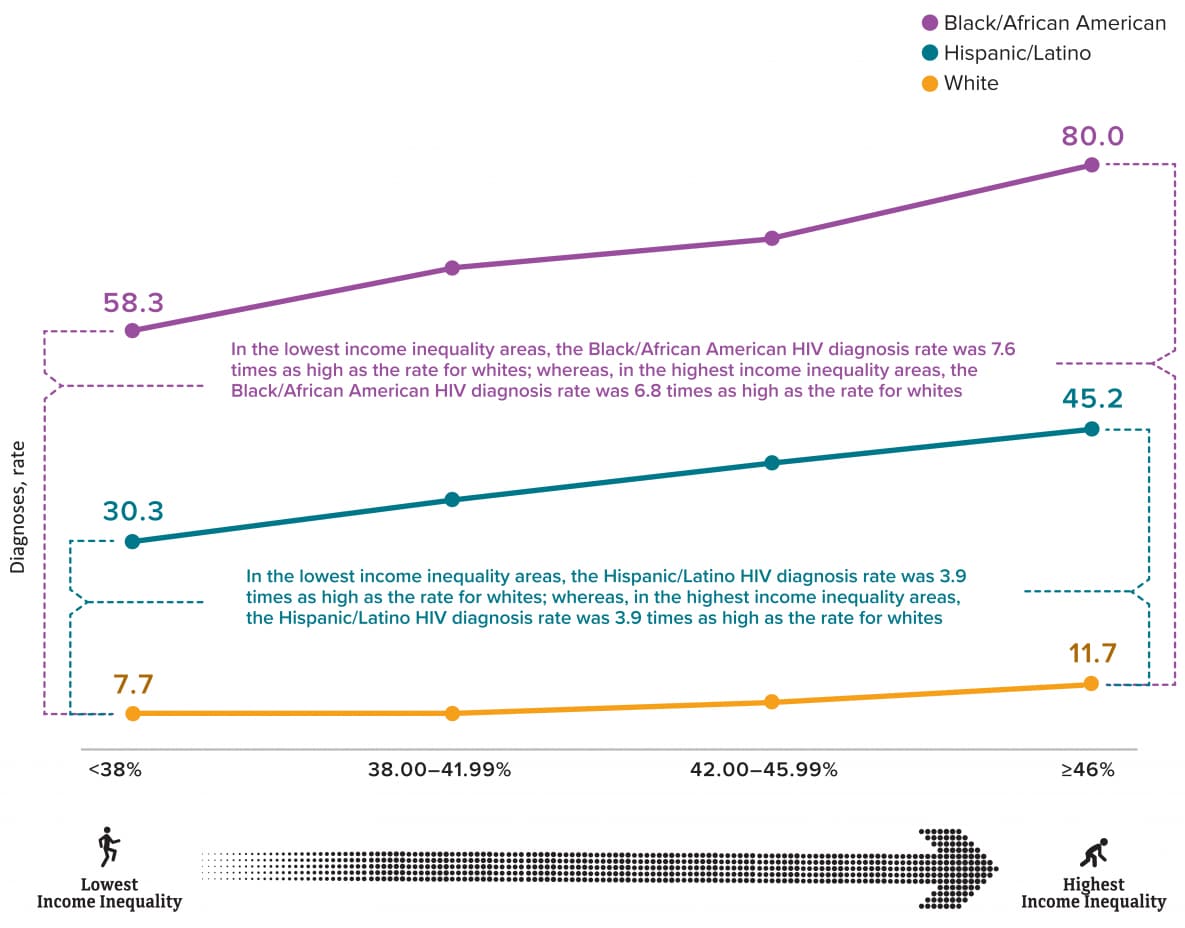
Figure 25: Among males residing in census tracts with the highest income inequality, the rate of diagnoses among Blacks/African Americans (80.0) was 6.9 times as high as the rate for whites (11.7); whereas, in census tracts with the lowest income inequality, the rate of diagnoses among Blacks/African Americans (58.3) was 7.6 times as high as the rate for whites (7.7). Among males, the Black/African American-white relative disparity was slightly wider for areas with the lowest income inequality compared to those with the highest income inequality. The Hispanic/Latino-white relative disparity was similar for areas with the lowest income inequality and areas with highest income inequality.

Figure 25: Among males residing in census tracts with the highest income inequality, the rate of diagnoses among Blacks/African Americans (80.0) was 6.9 times as high as the rate for whites (11.7); whereas, in census tracts with the lowest income inequality, the rate of diagnoses among Blacks/African Americans (58.3) was 7.6 times as high as the rate for whites (7.7). Among males, the Black/African American-white relative disparity was slightly wider for areas with the lowest income inequality compared to those with the highest income inequality. The Hispanic/Latino-white relative disparity was similar for areas with the lowest income inequality and areas with highest income inequality.

Note. Hispanics/Latinos can be of any race
†relative disparity measures the ratio of the difference between the group rate and the overall population rate to the overall rate.

Figure 26. Disparities of diagnoses of HIV infection among adult females, by race/ethnicity and Gini index, 2018—census tract level, United States and Puerto Rico
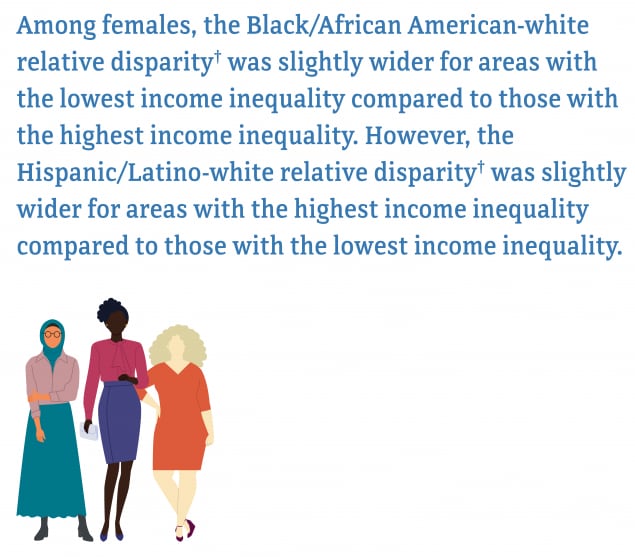
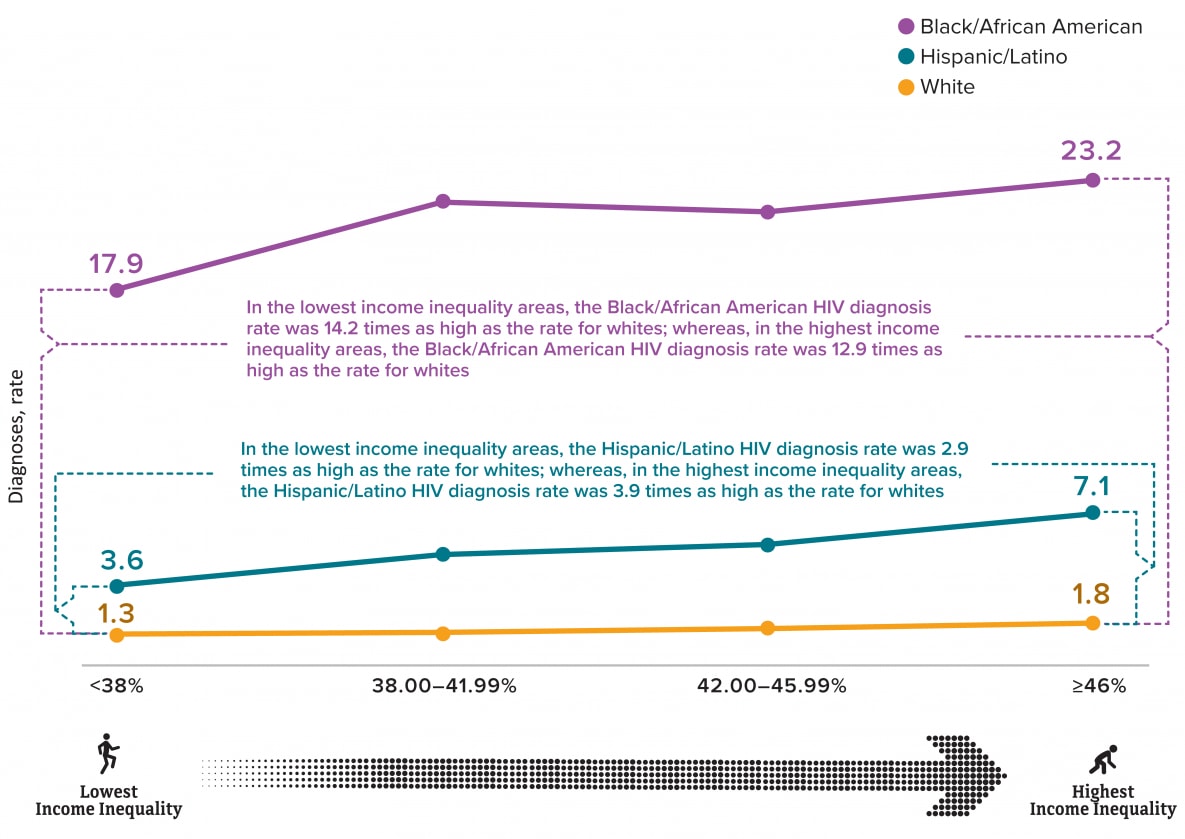
Figure 26: Among females residing in census tracts with the highest income inequality, the rate of diagnoses among Blacks/African Americans (23.2) was 12.9 times as high as the rate for whites (1.8); whereas, in census tracts with the lowest income inequality, the rate of diagnoses among Blacks/African Americans (17.9) was 14.2 times as high as the rate for whites (1.3). Among females, the Black/African American-white relative disparity was slightly wider for areas with the lowest income inequality compared to those with the highest income inequality. However, the Hispanic/Latino-white relative disparity was slightly wider for areas with the highest income inequality compared to those with the lowest income inequality.

Figure 26: Among females residing in census tracts with the highest income inequality, the rate of diagnoses among Blacks/African Americans (23.2) was 12.9 times as high as the rate for whites (1.8); whereas, in census tracts with the lowest income inequality, the rate of diagnoses among Blacks/African Americans (17.9) was 14.2 times as high as the rate for whites (1.3). Among females, the Black/African American-white relative disparity was slightly wider for areas with the lowest income inequality compared to those with the highest income inequality. However, the Hispanic/Latino-white relative disparity was slightly wider for areas with the highest income inequality compared to those with the lowest income inequality.

Note. Hispanics/Latinos can be of any race
†relative disparity measures the ratio of the difference between the group rate and the overall population rate to the overall rate.