YRBSS Participation
2021 High School YRBS Participation Map
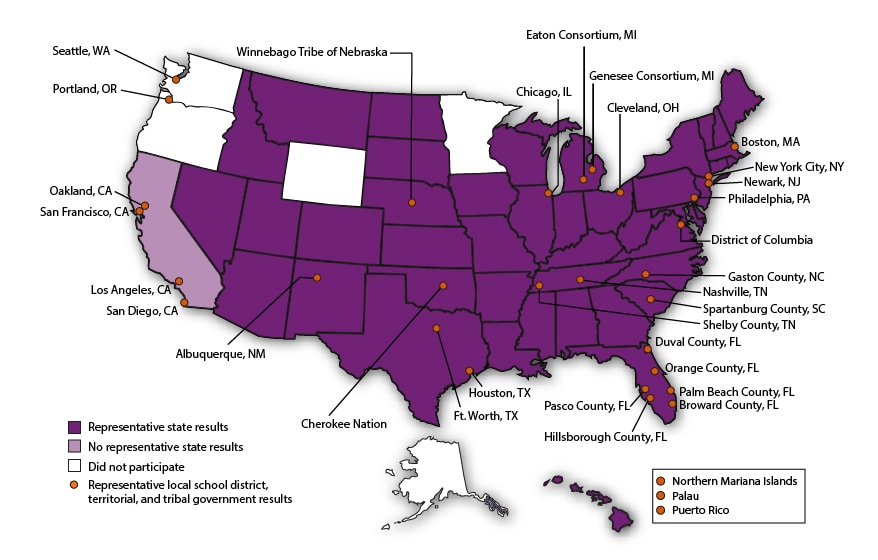
This map illustrates state, territory, tribal government, and local school district participation in the 2021 High School Youth Risk Behavior Survey. Surveys with representative1 and no representative2 state, territory, tribal government, and local school district data are shown.
- Alabama
- Arizona
- Arkansas
- Colorado
- Connecticut
- Florida
- Georgia
- Hawaii
- Idaho
- Illinois
- Indiana
- Iowa
- Kansas
- Kentucky
- Louisiana
- Maine
- Maryland
- Massachusetts
- Michigan
- Mississippi
- Missouri
- Montana
- Nebraska
- Nevada
- New Hampshire
- New Jersey
- New Mexico
- New York
- North Carolina
- North Dakota
- Ohio
- Oklahoma
- Pennsylvania
- Rhode Island
- South Carolina
- South Dakota
- Tennessee
- Texas
- Utah
- Vermont
- Virginia
- West Virginia
not representative
- California
- Albuquerque, NM
- Boston, MA
- Broward County, FL
- Chicago, IL
- Cleveland, OH
- District of Columbia
- Duval County, FL
- Eaton Consortium, MI
- Ft. Worth, TX
- Gaston County, NC
- Genesee Consortium, MI
- Hillsborough County, FL
- Houston, TX
- Los Angeles, CA
- Nashville, TN
- New York City, NY
- Newark, NJ
- Oakland, CA
- Orange County, FL
- Palm Beach County, FL
- Pasco County, FL
- Philadelphia, PA
- Portland, OR
- San Diego, CA
- San Francisco, CA
- Seattle, WA
- Shelby County, TN
- Spartanburg County, SC
Representative Territorial Surveys
- Northern Mariana Islands
- Palau
- Puerto Rico
Representative Tribal Surveys
- Cherokee Nation
- Winnebago Tribe
- Representative data are weighted to be representative of all students in grades 9–12 attending schools in each jurisdiction. With representative data, it is possible to say, for example, “X% of students in state Y never or rarely wore a seat belt when riding in a car driven by someone else.”
- Data from these sites represent only the students who completed the survey. The following states conducted a high school survey in 2021 and did not obtain representative data: California.
2021 Middle School YRBS Participation Map
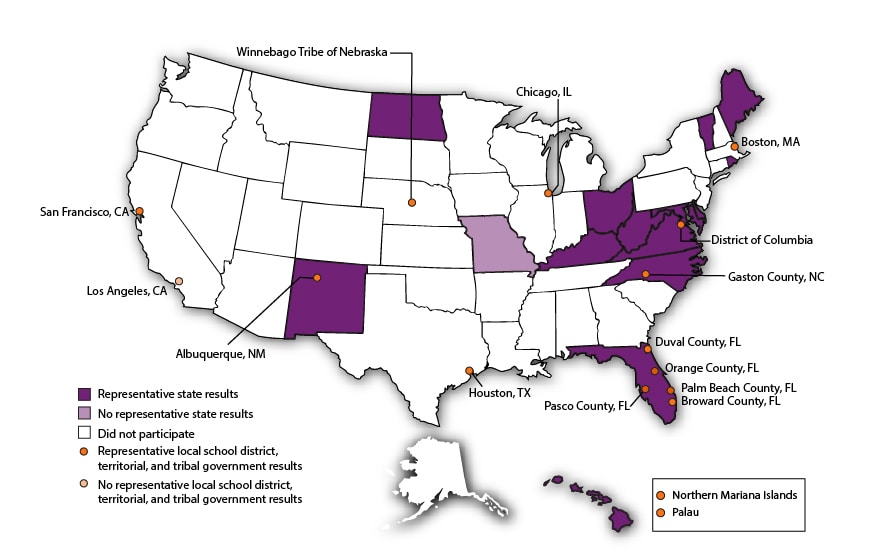
This map illustrates state, territory, tribal government, and local school district participation in the 2021 Middle School Youth Risk Behavior Survey. Surveys with representative1 and no representative2 state, territory, tribal government, and local school district data are shown.
- Delaware
- Florida
- Hawaii
- Kentucky
- Maine
- Maryland
- New Mexico
- North Carolina
- North Dakota
- Ohio
- Rhode Island
- Vermont
- Virginia
- West Virginia
Not representative:
- Missouri
- Albuquerque, NM
- Boston, MA
- Broward County, FL
- Chicago, IL
- District of Columbia
- Duval County, FL
- Gaston County, NC
- Houston, TX
- Orange County, FL
- Palm Beach County, FL
- Pasco County, FL
- San Francisco, CA
Not representative:
- Orange County, FL
Representative Territorial Surveys
- Northern Mariana Islands
- Palau
Representative Tribal Surveys
- Winnebago Tribe
- Representative data are weighted to be representative of all students in grades 9–12 attending schools in each jurisdiction. With representative data, it is possible to say, for example, “X% of students in state Y never or rarely wore a seat belt when riding in a car driven by someone else.”
- Unweighted data represent only the students who completed the survey.