Data Summary of HAIs in the US: Assessing Progress 2006-2016
A Story of Progress
On this page
Introduction
- The text and figures that follow constitute a high-level assessment of data reported to the National Healthcare Safety Network (NHSN) combined with data from other sources the Centers for Disease Control and Prevention uses, reflecting on several years of national progress toward elimination of major healthcare-associated infections (HAIs) in acute care hospitals.
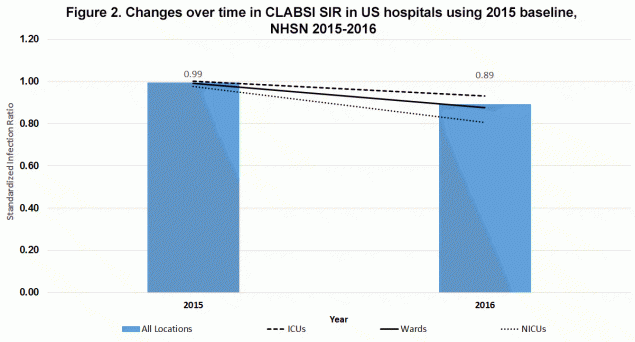
- To bridge understanding over the 2014 to 2015 transition between baselines and protocol changes, an advance look at 2016 national standardized infection ratios (SIRs) is included, calculated using both 2015 and historical baselines and models.
- This progress reflects outstanding collaborative efforts among healthcare providers, supported by national prevention efforts led by CDC, state health departments, the Agency for Healthcare Research and Quality (AHRQ) Comprehensive Unit Based Safety Program (CUSP), and Centers for Medicare and Medicaid Services (CMS) Quality Improvement Networks and Organizations and Hospital Engagement Networks.
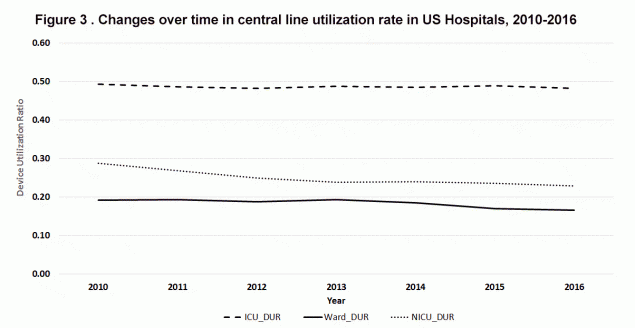
- Combined with declining SIRs, which change in relation to the number of CLABSIs per central line days, declines in the device (i.e. central line) use ratio (Figure 3: measured as central line days per patient days) on wards and especially neonatal intensive-care units (NICUs), highlight the net benefit to patients afforded by both safer and reduced central line use. Carefully determining the necessity of central lines before insertion is a CLABSI prevention strategy.
Measurement Background
- The national target set by the U.S. Health and Human Services (HHS) in the National Action Plan to Prevent Health Care-Associated Infections: Road Map to Elimination (HAI Action Plan) was a 5-year, 50% reduction in SIR from the baseline in 2008-9 with a new metric set (with a 2015 baseline) for another 50% reduction by 2020 (ODPHP National Targets and Metricsexternal icon).
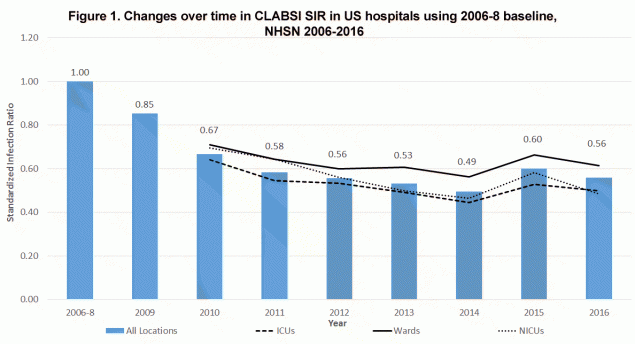
- In 2013 the national performance was just shy of the HAI Action Plan target with a 47% reduction in the overall SIR; however, reductions exceeded this target in 2014 with a 51% reduction in SIR from the 2006-2008 baseline.
- The increase from 2014 to 2015, measured using the 2006-8 baseline, was caused by changes in the surveillance protocol as described in the report entitled, National 2015 Standardized Infection Ratios (SIRs) Calculated Using Historical Baselines. The 10% overall decline in the 2016 SIR compared to the 2015 SIR recorded using the 2015 baseline (Figure 2), combined with previous yearly declines, supports a likelihood that the 2014 to 2015 increase was solely due to the surveillance protocol change.
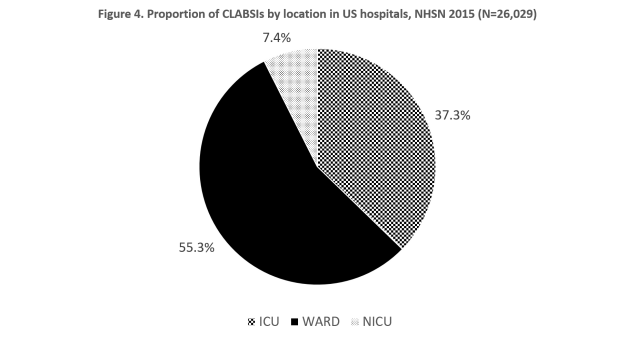
- There was a leveling off in the magnitude of SIR declines from 2012-14 that was more pronounced on wards, to which the majority of CLABSI reported to NHSN were attributed in 2015 (Figure 4).
- Both earlier reports (Fagan R et al. ICHE 2013external icon and VitalSigns Making Health Care Safer Reducing bloodstream infections pdf icon[PDF – 275 KB] ), and more recent unpublished data, suggest that, at least among adult intensive care unit (ICU) patients, declines in CLABSIs caused by Staphylococcus and Enterococcus spp. have outpaced declines in infections caused by gram negative and fungal pathogens.
- Dynamics in the microbiology of CLABSIs, along with lagging declines on wards where central lines are on average in place longer than ICU central lines, suggest prevention successes due primarily to improved central line insertion practices.
Additional Prevention Data
- Data from CDC’s hospital HAI point prevalence surveys, conducted in collaboration with the Emerging Infections Program, show significant reductions in overall HAI prevalence and central line prevalence between 2011 and 2015. The percentage of patients with blood stream infections (not limited to CLABSI) was similar in the 2011 survey and the 2015 survey (Magill S et al. IDWeek 2017external icon).
Next Steps
- Despite significant prevention success through improved central line insertion practices, with at least eight year-to-year declines in location-specific and overall SIRs between the 2006-8 baseline and 2016 (Figures 1 and 2), there is need to expand prevention through improved maintenance of central lines and other strategies.
- Resources to prevent CLABSIs include:
Catheter-associated Urinary Tract Infection (CAUTI)
Prevention Highlights
- After some early lack of progress, there have been steady declines in CAUTIs over the past few years. The gains have been most marked in non-ICU locations, but recent years have seen progress in ICUs as well.
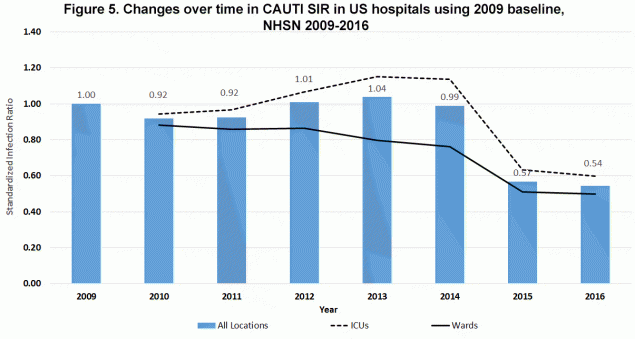
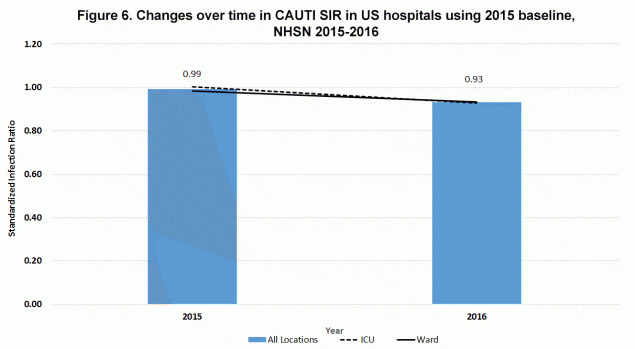
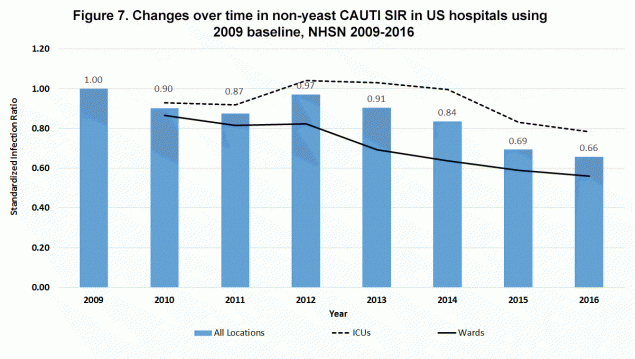
- Although CAUTIs that include those caused by yeast declined on wards from 2012 through 2014, they failed to decline in ICUs, where they increased and then remained elevated from 2012 through 2014 (Figure 5). However, using the more clinically-relevant CAUTI definition that no longer includes yeast, and applying this retrospectively as well as in the new baseline, there have been consistent year-to-year declines in CAUTIs in both ICUs and wards from 2012 through 2016 (Figures 6 and 7)
- Collaboration between CDC, CMS, AHRQ and the Office of the Assistant Secretary of Health driven by the Agency Priority Goal process helped inform and drive targeted prevention efforts.
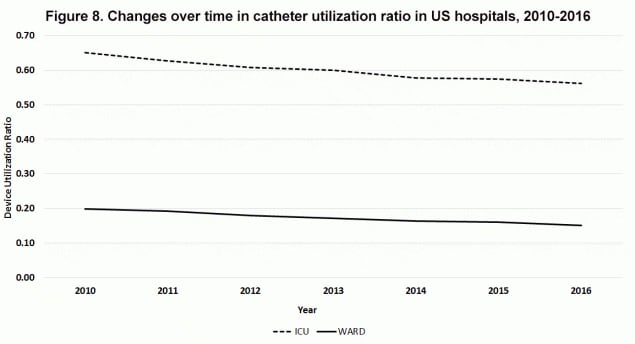
- Combined with declining non-yeast CAUTI SIRs, which change in relation to the number of CAUTIs per urinary catheter days, declines in the device (i.e. urinary catheter) use ratio (Figure 8: measured as urinary catheter days per patient days) highlight the net benefit to patients afforded by both safer and reduced urinary catheter use. Reducing unnecessary urinary catheter use is a key prevention strategy for CAUTI.
Measurement Background
- The HAI Action Plan reduction target was a 5-year 25% reduction in SIR from the baseline to 2013 with the new metric set (with a 2015 baseline) for another 25% reduction by 2020 (ODPHP National Targets and Metricsexternal icon).
- In 2015 there was a marked (i.e. 43%) decline from 2014 in the SIR calculated using the 2009 baseline (Figure 7). This decrease was caused by changes in the surveillance protocol as described in the report entitled, National 2015 Standardized Infection Ratios (SIRs) Calculated Using Historical Baselines.
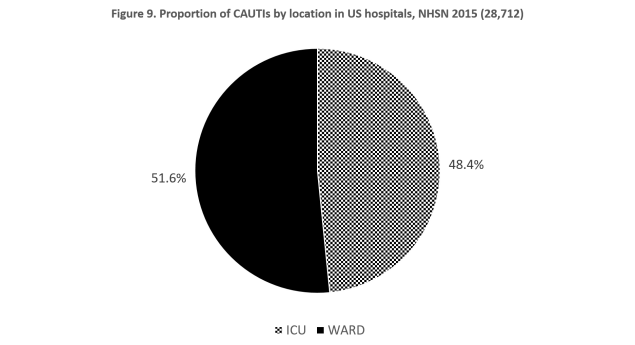
- The retrospective removal of yeast from CAUTI reports from 2009 through 2014 (Figure 7) shows that reductions in wards, to which a slight majority of CAUTIs were attributed in 2015 (Figure 9), were more pronounced. However, there were also declines in the ICU SIR resulting in successive yearly relative declines of 6-8% in the revised overall CAUTI SIR from 2012 through 2014.
- The 5-6% relative decline in overall SIR between 2015 and 2016 using both the 2015 and 2009 baseline with yeasts removed (Figures 6 and 7), suggests there likely was a true decline in CAUTI SIR between 2014 and 2015. However, the true decline was likely still less than the 17.1% relative decline shown in Figure 7 after the removal of yeast using the 2009 baseline—this 17.1% was potentially still inflated by surveillance protocol changes other than simply the removal of yeast.
- Assuming that the 2014 to 2015 decline, without any surveillance artifact, was similar to the declines for each of the previous two and one following year (i.e. 5-8% per year), the 25% HAI Action Plan Reduction Target from the 2008 baseline was achieved for clinically relevant CAUTI at least by 2016, if not by 2015.
Additional Prevention Data
- Data from CDC’s hospital HAI point prevalence surveys show significant reductions in UTI prevalence and urinary catheter prevalence between 2011 and 2015 (Magill S et al. IDWeek 2017external icon).
Next Steps
- Continued prevention efforts, employing strategies to both reduce the risk of CAUTI per urinary catheter day (e.g. good urinary catheter care and careful CAUTI diagnosis) and reduce unnecessary urinary catheter use, will be needed in ICUs as well as in wards.
- Resources to prevent CAUTI include:
Measurement Background
- The HAI Action Plan Reduction target was a 25% reduction in admission and readmission SSI [i.e., national SIR for SSI = 0.75] for Surgical Care Improvement Project (SCIP) procedures from 2008 to 2013 with the new metric set (with a 2015 baseline) for another 30% reduction by 2020 (ODPHP National Targets and Metricsexternal icon). For a list of the 10 SCIP procedures see Progress Toward Eliminating Healthcare-Associated Infections – October 2012 pdf icon[PDF – 382]external icon .
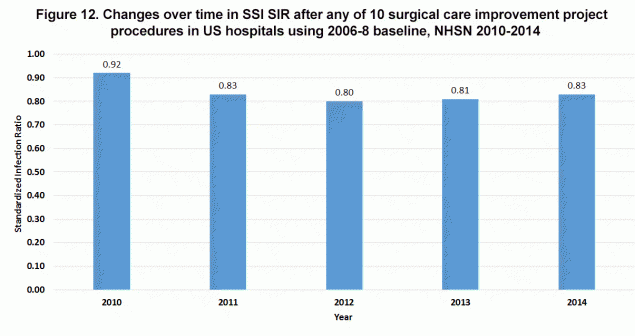
- The SCIP procedure SIR was first calculated in 2010 using a 2008 baseline and most recently available for 2014 (Figure 12). After an initial decline from 2008 and 2011, this SIR was level through 2014.
- Between 2013 and 2015 multiple surveillance protocol changes confounded the trajectory of the SIR for SSIs following colon surgeries, making progress difficult to track—data not shown. These protocol changes are described in the report entitled, National 2015 Standardized Infection Ratios (SIRs) Calculated Using Historical Baselines.
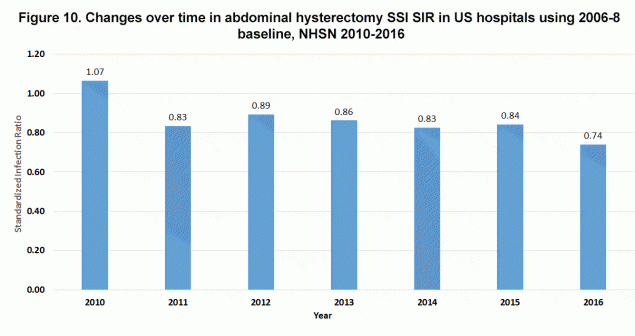
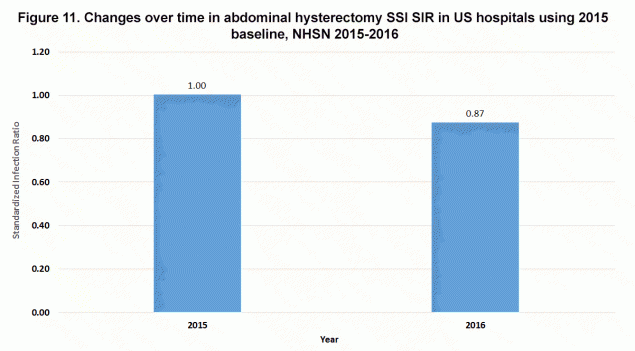
- There have been year-to-year declines in the SIR of SSIs following total abdominal hysterectomy for four of the 6 years between 2010 and 2016 (Figures 10 and 11).
Additional Prevention Data
- Data from CDC’s hospital HAI point prevalence surveys show significant reductions in overall SSI (i.e. not limited to 10 SCIP procedures or SSI following a specific procedure) prevalence between 2011 and 2015 (Magill S et al. IDWeek 2017external icon).
Next Steps
- Building upon the historicexternal icon and possibly ongoing impact of implementing general (i.e. SCIP) strategies to prevent SSIs broadly, future declines in SSI will require collaborative efforts with the surgical community to develop innovative prevention strategies directed at specific procedures.
- Resources to prevent SSIs include:
Methicillin-resistant Staphylococcus aureus Bacteremia (MRSA Bacteremia)
Prevention Highlights
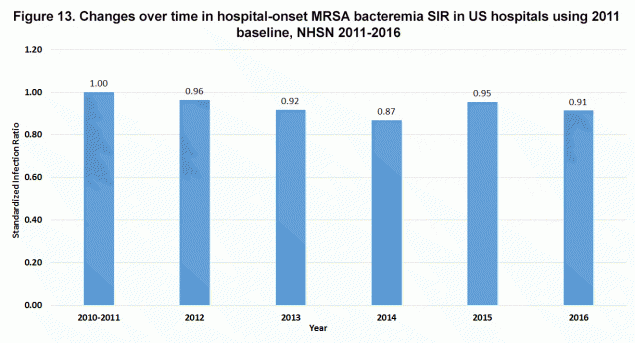
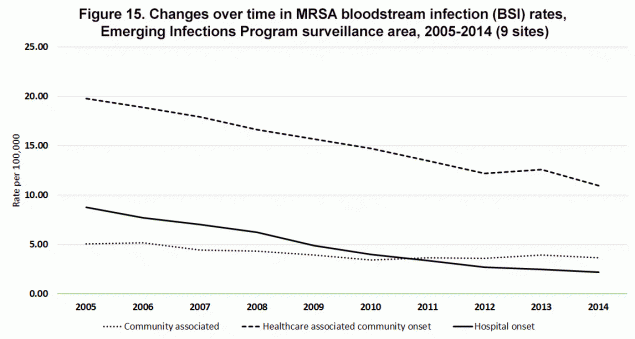
- There has been major progress since 2005 in preventing MRSA bacteremia due to declines in hospital-onset and community-onset, healthcare-associated bacteremia (Figures 13-16). However, declines are slowing in these areas.
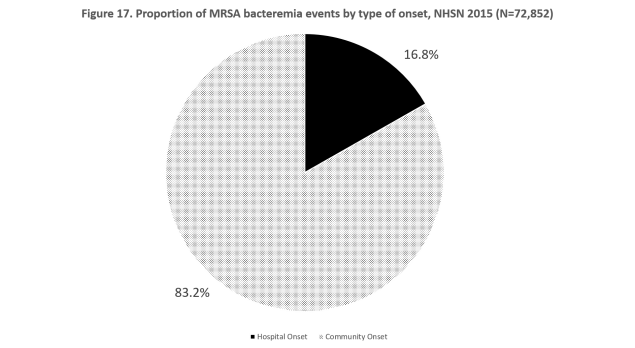
- An assessment of MRSA bacteremia events reported to NHSN demonstrates over 80% of reported events had their onset in the community in 2015 (Figure 17). Although a subset of community-onset events are used for risk adjustment, hospital-onset events are the outcome measured by the SIR.
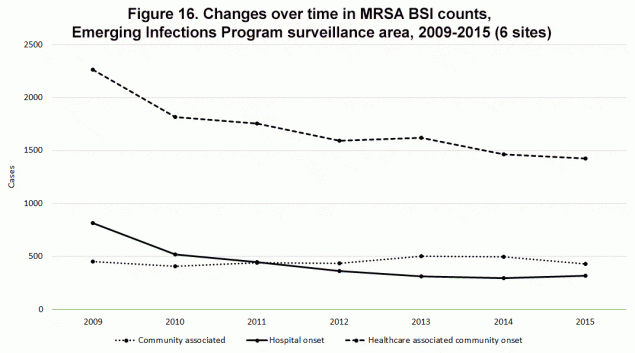
- There has been little or no decline in community-associated MRSA bacteremia (Figures 15 and 16), suggesting a need for a comprehensive, multidisciplinary community-based public health approach to prevention of invasive infections caused by this common skin organism that can transmit in communities.
- Much of the progress in preventing MRSA bacteremia reflects progress in preventing insertion-related CLABSIs (see CLABSI discussion above).
Measurement Background
- The HHS HAI Action Plan reduction target was a 25% reduction in SIR from the 2010-2011 baseline to 2013 with the new metric set (with a 2015 baseline) for another 25% reduction by 2020 (ODPHP National Targets and Metricsexternal icon).
- By the end of 2014 there had been a 13% decline in the SIR from the 2011 baseline with a 4% decline between 2012 and 2013 and a 5% decline between 2013 and 2014 (Figure 13).
- Between 2014 and 2015 there was an 8% increase in the SIR using the 2010-2011 baseline due to changes in the surveillance protocol as described in the report entitled, National 2015 Standardized Infection Ratios (SIRs) Calculated Using Historical Baselines.
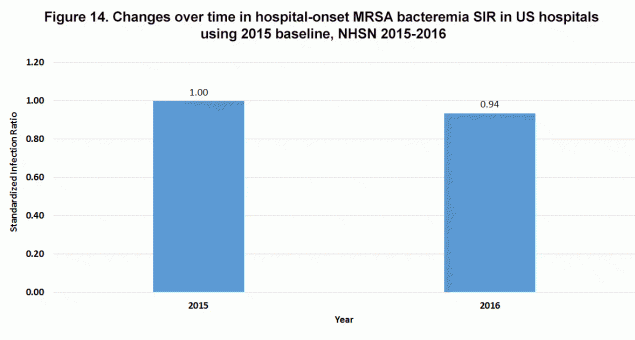
- Using the 2015 baseline, there was a 5% decline in SIR between 2015 and 2016 (Figure 14). Although the data are not shown in this report, there was a slow continuous decline in the unadjusted NHSN crude rate of hospital-onset MRSA bacteremia (the outcome represented by the SIR) from 2012 through 2016, ranging from 0.61 cases per 10,000 patient days to 0.55 cases per 10,000 patient days, with no increase in 2015.
- Despite a small (about 7%) increase in the number of hospital-onset MRSA bacteremia cases reported to the Emerging Infections Program between 2014 and 2015 (Figure 16) these data suggest that, had there been no surveillance protocol changes, there would have been yearly prevention progress reflected in the SIR through 2016, or at least no significant increases, including 2014 to 2015.
Additional Prevention Data
- The Emerging Infections Program has been monitoring healthcare and community invasive MRSA infections in select communities in 6-9 states since 2005.
- EIP data demonstrates declines in community-onset, healthcare-associated MRSA bacteremia through 2015 and hospital-onset MRSA bacteremia through 2014 (Figures 15 and 16). The years 2005 through 2008 had a reported decline of 11.2% in hospital-onset and 6.6% in community-onset, healthcare-associated MRSA bacteremia (Kallen AJ et al. JAMA 2010external icon).
Next Steps
- CDC is exploring ways to better report information on community-onset MRSA bacteremia events to help drive prevention.
- New prevention strategies for preventing non-CLABSI MRSA bacteremia are needed, as well as strategies for preventing community-associated MRSA bacteremia.
- The transmissible nature of MRSA underscores the need for public health focused prevention efforts that span the full continuum of healthcare and the community.
- Resources to prevent MRSA bacteremia:
Clostridium difficile Infection (CDI)
Prevention Highlights
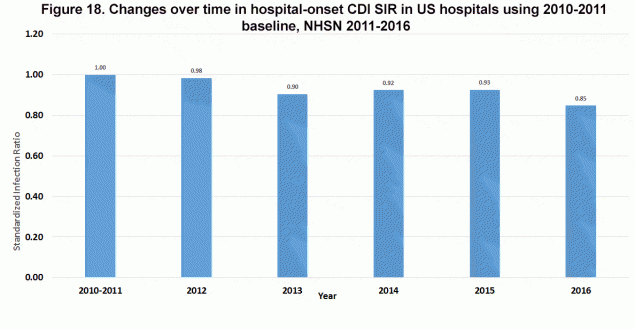
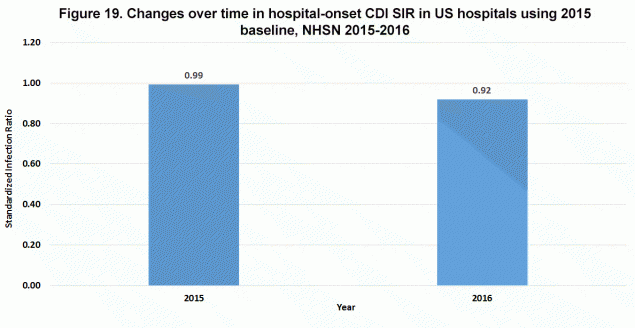
- The NHSN SIR, which accounts for the sensitivity of different diagnostic test types, suggests intermittent, slow progress in preventing hospital-onset CDI (Figures 18 and 19). The most recent pace of progress (i.e. 8% from 2015 to 2016) needs to remain steady or increase to meet national prevention goals for hospital-onset CDI in 2020.
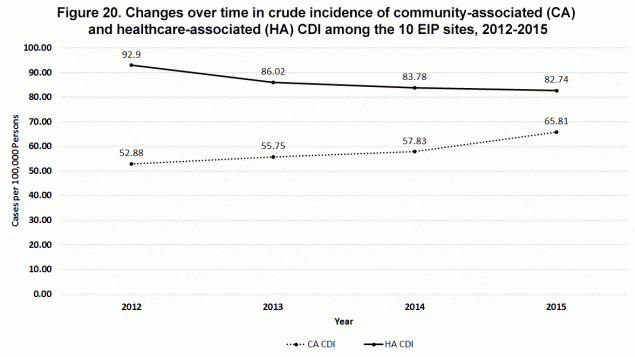
- Crude rates of healthcare-associated CDI are decreasing (Figure 20), which largely reflects declines in nursing home-onset infections (data not shown), along with some declines in hospital-onset CDI.
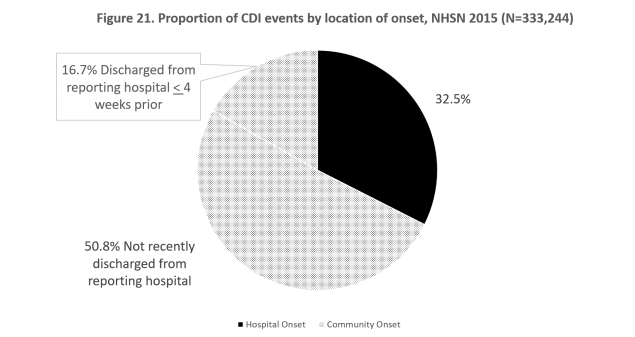
- An assessment of CDI events reported to NHSN demonstrates that nearly 70% of reported events had their onset in the community in 2015 (Figure 21). Although a subset of community-onset events are used for risk adjustment, hospital-onset events are the outcome measured by the SIR.
- Community-associated CDI may be increasing (Figure 20), even after accounting for more sensitive testing, and at the very least it is not decreasing at the same rate as inpatient healthcare-associated CDI.
Measurement Background
- The HAI Action Plan reduction target called for a 5-year, 30% reduction in SIR from 2008 to 2013 with the new metric set (with a 2015 baseline) for another 30% reduction by 2020 (ODPHP National Targets and Metricsexternal icon).
- By the end of 2014 there had been an 8% decline in the SIR from baseline and between 2015 and 2016 there was another 8% decline using the 2011 baseline (Figure 18) and 7% decline using the 2015 baseline (Figure 19).
- Although there were surveillance protocol changes made to CDI that were similar to those for MRSA Bacteremia as described in the report entitled, National 2015 Standardized Infection Ratios (SIRs) Calculated Using Historical Baselines, there was no change in the SIR between 2014 and 2015 using the 2011 baseline (Figure 18).
Additional Prevention Data
- Data from CDC’s hospital HAI point prevalence surveys show stable prevalence of CDI between 2011 and 2015 (Magill S et al. IDWeek 2017external icon). However, the prevalence survey methodology did not account for the national increase in more sensitive diagnostic testing over this period. Given the known impact of more sensitive test types on reported rates, it is likely that, if such methods were employed, modest declines in the prevalence of hospital onset CDI would have been detected (i.e. as recorded by the SIR).
- The Emerging Infections Program has been monitoring CDI in select communities in 10 states since 2011, including both community and healthcare associated infections.
- Crude rates of community-associated CDI are not decreasing at the same rate as healthcare-associated CDI and actually might be increasing slightly (Figure 20), but do not take into account more sensitive testing. The decline in healthcare-associated CDI is largely due to declines in nursing home onset disease (Guh et al. submitted for publication); some of the increase in community-associated CDI may reflect increases in more sensitive testing.
Next Steps
- CDC is exploring ways to better report information on community-onset CDI events to help drive prevention.
- There is a need for antibiotic stewardship in adult ambulatory settings as well as the development of other prevention strategies directed at these infections.
- The transmissible nature of C. difficile underscores the need for public health focused prevention efforts that span the full continuum of healthcare and the community.
- Resources to prevent CDI:
Page last reviewed: December 5, 2017
