Content on this page was developed during the 2009-2010 H1N1 pandemic and has not been updated.
- The H1N1 virus that caused that pandemic is now a regular human flu virus and continues to circulate seasonally worldwide.
- The English language content on this website is being archived for historic and reference purposes only.
- For current, updated information on seasonal flu, including information about H1N1, see the CDC Seasonal Flu website.
2009 H1N1 Vaccine Doses Allocated,
Ordered, and Shipped by Project Area
Archives Posted October 16, 2009- January 21, 2010
Note: Supplies of the vaccines to protect against the 2009 H1N1 virus are increasing and many places have opened up vaccination to anyone who wants it. This vaccine is the best way to protect against the 2009 H1N1 pandemic virus. Those who have been patiently waiting to receive the 2009 H1N1 vaccine are now encouraged to get vaccinated.
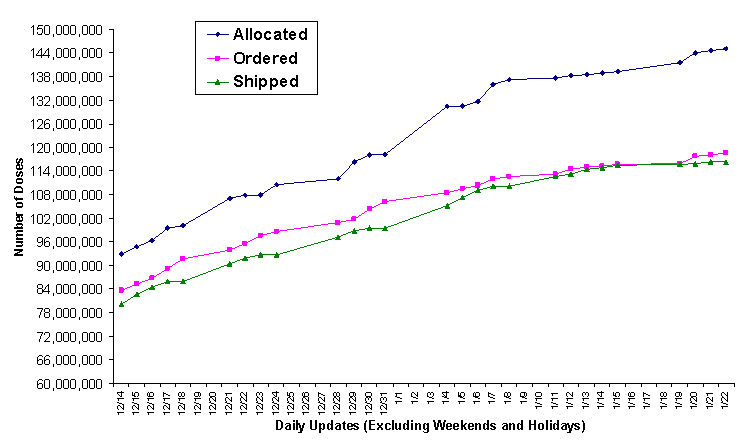
Table and Graph of 2009 H1N1 Influenza Vaccine Doses Allocated, Ordered, and Shipped By Project Area.
Updated Januray 25, 2010, 5:00 PM ET
| Date | Allocated | Ordered | Shipped |
|---|---|---|---|
| 01/22/10 | 145,132,850 | 118,630,900 | 116,226,920 |
| 01/21/10 | 144,741,750 | 118,072,700 | 116,206,320 |
| 01/20/10 | 144,092,400 | 117,711,000 | 115,822,020 |
| 01/19/10 | 141,602,700 | 115,853,000 | 115,630,620 |
| 01/15/10 | 139,334,000 |
115,591,600 |
115,487,820 |
| 01/14/10 | 138,934,400 |
115,246,700 |
114,850,120 |
| 01/13/10 | 138,402,600 |
114,972,000 |
114,504,220 |
| 01/12/10 | 138,369,200 |
114,517,000 |
113,293,220 |
| 01/11/10 | 137,697,600 |
113,270,700 |
112,538,020 |
| 01/08/10 | 137,359,300 |
112,599,500 |
110,202,920 |
| 01/07/10 | 135,981,600 |
112,013,100 |
110,202,520 |
| 01/06/10 | 131,661,400 |
110,400,200 |
109,016,520 |
| 01/05/10 | 130,386,600 |
109,506,200 |
107,351,020 |
| 01/04/10 | 130,386,600 |
108,474,200 |
105,266,520 |
| 12/31/09 | 118,241,100 | 106,247,500 | 99,366,920 |
| 12/30/09 | 118,241,100 | 104,249,900 | 99,362,620 |
| 12/29/09 | 116,266,700 | 101,697,200 | 98,764,920 |
| 12/28/09 | 111,947,700 | 100,931,500 | 97,281,820 |
| 12/24/09 | 110,477,700 | 98,681,000 | 92,659,820 |
| 12/23/09 | 107,786,500 | 97,584,000 | 92,659,820 |
| 12/22/09 | 107,786,500 | 95,514,300 | 91,863,720 |
| 12/21/09 | 107,156,700 | 93,940,500 | 90,384,920 |
| 12/18/09 | 100,082,700 |
91,630,300 |
85,988,420 |
| 12/17/09 | 99,439,500 |
89,187,200 |
85,980,220 |
| 12/16/09 | 96,385,200 |
86,710,200 |
84,493,120 |
| 12/15/09 | 94,628,100 |
85,298,200 |
82,617,120 |
| 12/14/09 | 92,883,100 |
83,656,200 |
76,355,920 |
- Allocated: Doses that are at the distribution depots and ready for states to order. Vaccine is allocated to each state in proportion to its population (pro rata)
- Ordered: Doses requested by states as of 9 PM ET for shipment to state-designated locations
- Shipped: Doses sent as of 5 PM ET from the central distributor to state-designated locations
Graph. 2010 H1N1 Influenza Vaccine Doses Allocated, Ordered, and Shipped in U.S.
(NOTE: all data in graph can be found in table above.)
Previous H1N1 Influenza Vaccine Supply Status Updates
- January 21, 2010
- January 20, 2010
- January 19, 2010
- January 15, 2010
- January 14, 2010
- January 13, 2010
- January 12, 2010
- January 11, 2010
- January 8, 2010
- January 7, 2010
- January 6, 2010
- January 5, 2010
- January 4, 2010
- December 31, 2009
- December 30, 2009
- December 29, 2009
- December 28, 2009
- December 24, 2009
- December 23, 2009
- December 22, 2009
- December 21, 2009
- December 18, 2009
- December 17, 2009
- December 16, 2009
- December 15, 2009
- December 14, 2009
- December 11, 2009
- December 10, 2009
- December 9, 2009
- December 8, 2009
- December 7, 2009
- December 4, 2009
- December 3, 2009
- December 2, 2009
- December 1, 2009
- November 30, 2009
- November 27, 2009
- November 25, 2009
- November 24, 2009
- November 23, 2009
- November 20, 2009
- November 13, 2009
- November 6, 2009
- October 30, 2009
- October 23, 2009
- October 16, 2009
