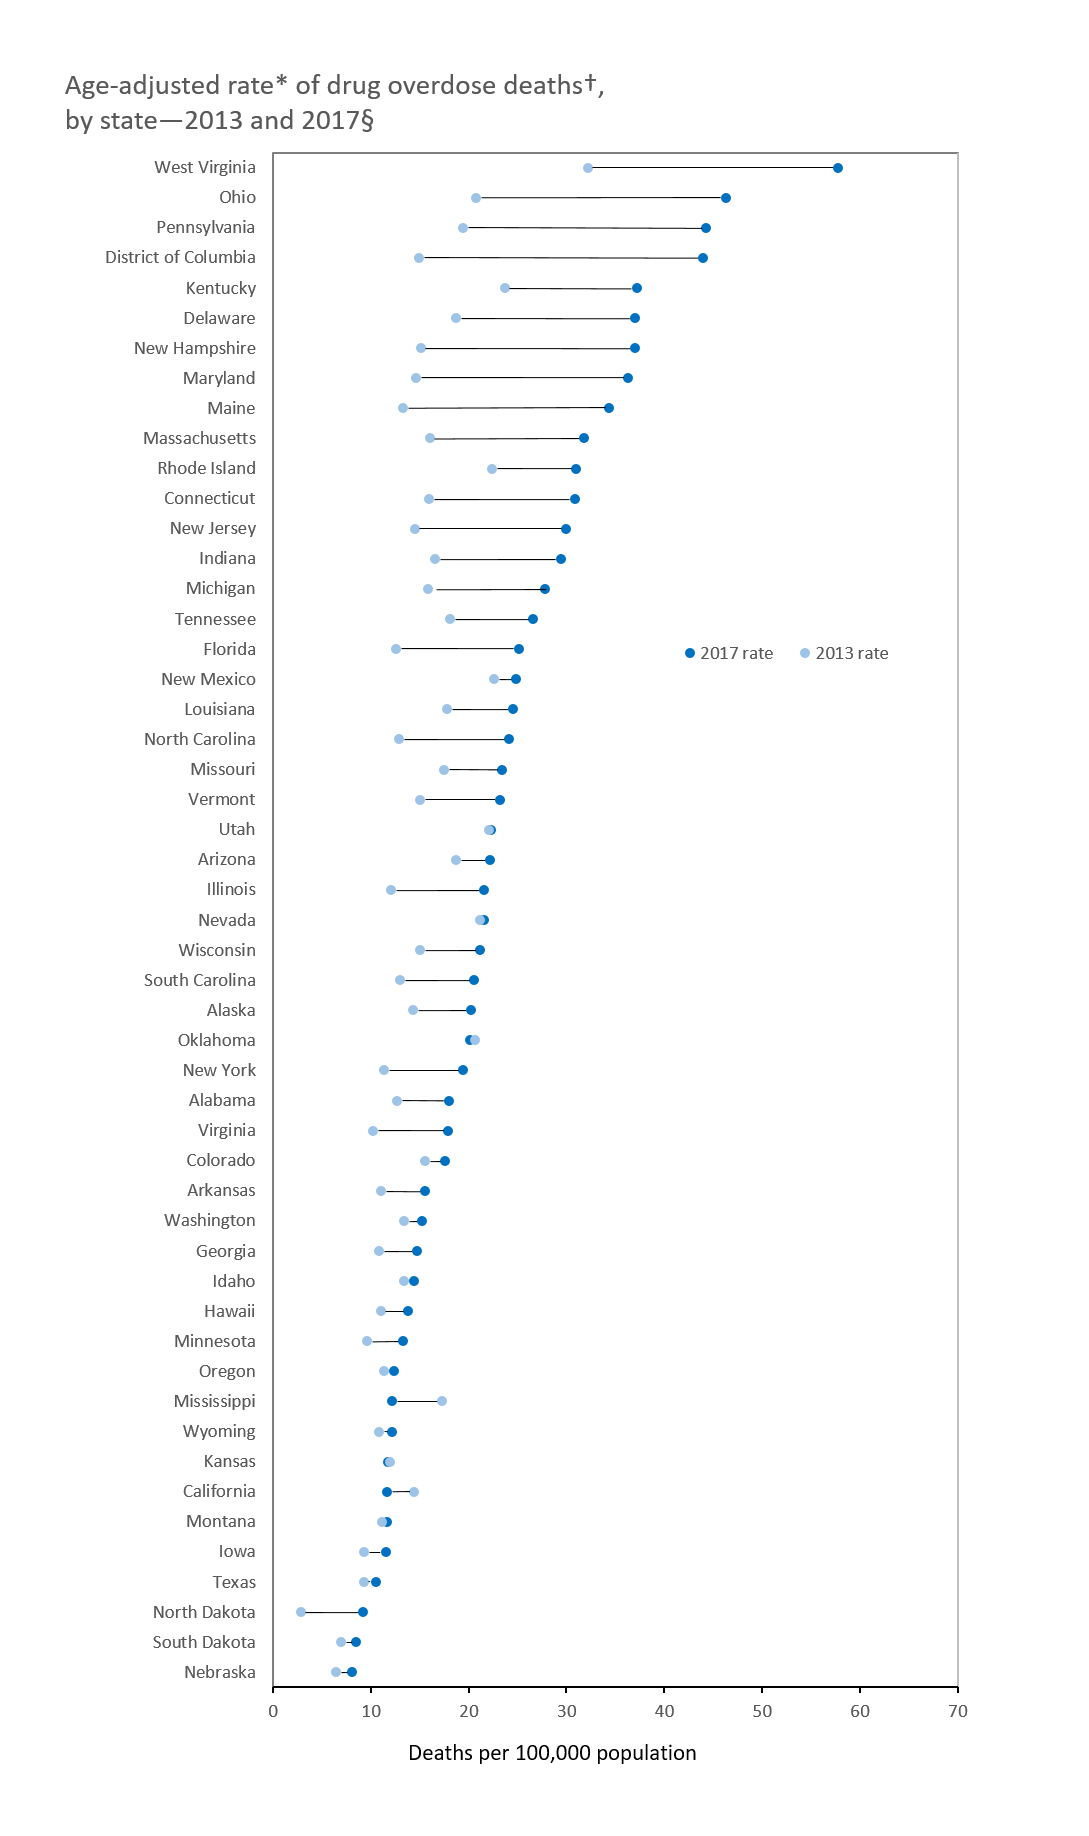
2013-2017 Drug Overdose Death Rate Increases Graph
* Rates shown are the number of deaths per 100,000 population. Age-adjusted death rates were calculated by applying age-specific death rates to the 2000 U.S. standard population age distribution.
† Deaths are classified using the International Classification of Diseases, Tenth Revision (ICD–10). Panel includes drug overdose deaths identified using underlying cause-of-death codes X40–X44, X60–X64, X85, and Y10–Y14.
§ Joinpoint regression examining changes in trends from 2013 to 2017 indicated that 35 states and the District of Columbia had significant increases in drug overdose death rates from 2013 to 2017 (Alabama, Alaska, Arizona, Arkansas, Connecticut, Delaware, District of Columbia, Florida, Georgia, Hawaii, Illinois, Indiana, Iowa, Kentucky, Louisiana, Maine, Maryland, Massachusetts, Michigan, Minnesota, Missouri, New Jersey, New York, North Carolina, Ohio, Pennsylvania, Rhode Island, South Carolina, South Dakota, Tennessee, Texas, Vermont, Virginia, Washington, West Virginia, and Wisconsin). All remaining states had nonsignificant trends during this period.


