Drowning Data
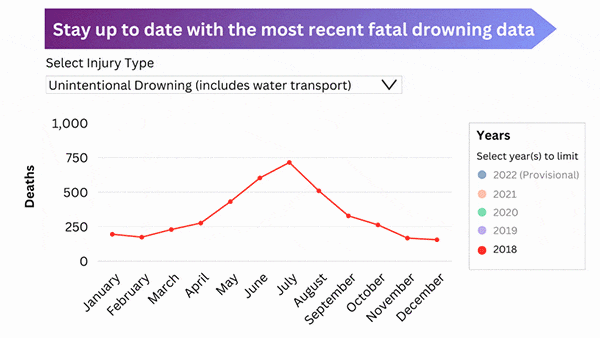
More children ages 1-4 die from drowning than any other cause of death and it’s the second leading cause of unintentional injury death for children ages 5-14. This chart shows the number of drowning deaths by month and year, including the most recent provisional data available. You can access the full interactive chart by clicking on the image or the button below.
Every year in the United States there are over 4,000* fatal unintentional drownings, including boating-related drowning.1
Drowning death rates vary from state to state. The annual age-adjusted drowning death rate in the United States during 2018-2021 was 1.31 deaths per 100,000 people (including boating-related drowning deaths). The map below shows annual age-adjusted unintentional drowning death rates during 2018-2021.
Learn more about drowning deaths in your state.
Data source: Centers for Disease Control and Prevention, National Center for Health Statistics. Wide-ranging Online Data for Epidemiologic Research (WONDER) [Online]. Available at https://wonder.cdc.gov. Accessed 31 May 2023.
*An average of 4,083 unintentional drowning deaths occurred each year from 2012–2021.1
Note: For the District of Columbia, the number of drowning deaths in 2018-2021 is too small to calculate a reliable drowning death rate.
- Centers for Disease Control and Prevention, National Center for Injury Prevention and Control. Web-based Injury Statistics Query and Reporting System (WISQARS) [Online]. Available at https://www.cdc.gov/injury/wisqars.