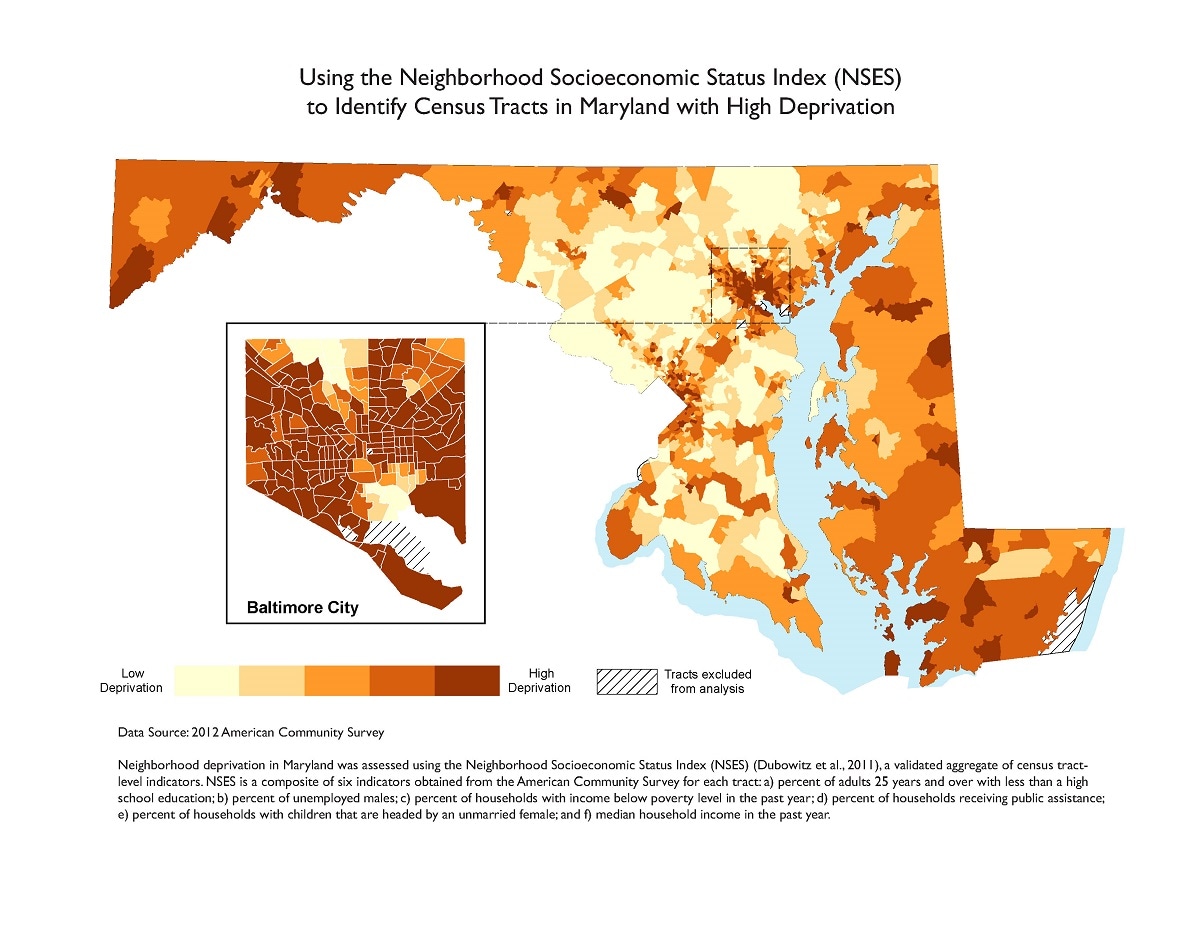
Map Details: Using the NSES to Identify High Deprivation in Maryland
Impact Statement
Living in high deprivation areas can decrease the quality and quantity of available community-based public health interventions, the availability of health care services and resources, and access to healthy food and physical activity (Shaw et al., Prev Chronic Dis 2016).

Key Points
Major Findings
Western Maryland, the Eastern Shore, and Baltimore City have the highest levels of neighborhood deprivation.
How the map will be used, or has been used
This map provides important insight into the location of vulnerable populations.