Recommendations for Fully Vaccinated People
COVID-19 Homepage
COVID-19Surge
COVID-19Surge is a spreadsheet-based tool that hospital administrators and public health officials can use to estimate the surge in demand for hospital-based services during the COVID-19 pandemic. A user of COVID-19Surge can produce estimates of the number of COVID-19 patients that need to be hospitalized, the number requiring ICU care, and the number requiring ventilator support. The user can then compare those estimates with hospital capacity, using either existing capacity or estimates of expanded capacity.
With COVID-19Surge, users define the population in the hospital “catchment area” or local jurisdiction. The user also enters the number of cases to date, and the available hospital resources (non-ICU beds, ICU beds, and mechanical ventilators). Users can assess up to three community mitigation strategies simultaneously and compare the impacts on hospital resources versus a “no intervention” scenario.
FAQ
Can COVID-19Surge be used to accurately estimate the impact of COVID-19?
The numbers generated through COVID-19Surge are estimates. They DO NOT reflect what will actually occur during the pandemic. Rather, they are estimates for a given set of scenarios. COVID-19Surge should be used to plan and prepare a response to a surge in demand for hospital-based resources due to the COVID-19 pandemic.
Can users change the input variables?
Yes. When you download and open the COVID-19Surge, all inputs are pre-populated with numbers and estimates based on published sources. Users can change the values in the tool that best illustrate the situation in their jurisdiction. Further, we encourage users to change input values and explore the impact of various scenarios. Explanations are provided in the accompanying manual.
System Requirements
COVID-19Surge uses the Windows* operating system (Microsoft Windows 2010 or higher) and Excel (Microsoft Office 2013 or higher). The full functionality of COVID-19Surge is supported in the desktop version of Microsoft Office® for Windows. Some functionality may not be available in Microsoft Office for Macs or in the browser version of Office 365.
*Microsoft Windows and Office are copyrighted products produced by Microsoft Corporation, WA. The use of trade names and commercial sources is for identification only and does not imply endorsement by the U.S. Department of Health and Human Services.
Download the Files
We recommend downloading and saving the COVID-19Surge spreadsheet to your computer, then open the spreadsheet from your computer. This will allow the spreadsheet to open in Excel instead of your web browser.
- COVID-19Surge Spreadsheet CDC [XLSM – 6 MB]
- Correction: This version of COVID19Surge.v1_2 spreadsheet tool corrects a minor coding error that occurred on the Case Count tab. The coding error had no impact on the primary results of the tool, but could have caused issues for one of the scenarios under certain user cases.
- COVID-19Surge Manual CDC [304 KB, 20 pages]
Load, Start, and Navigation
Open the COVID-19Surge spreadsheet and click the box at the top of the document that says, “Enable Macros,” or “Enable Content” (depending on version of Excel being used). After enabling macros, click the “Start” button on the cover page to start navigating the tool. If you encounter any issues, contact HEMU@cdc.gov with a subject line [COVID-19Surge tool inquiry].
Example Output
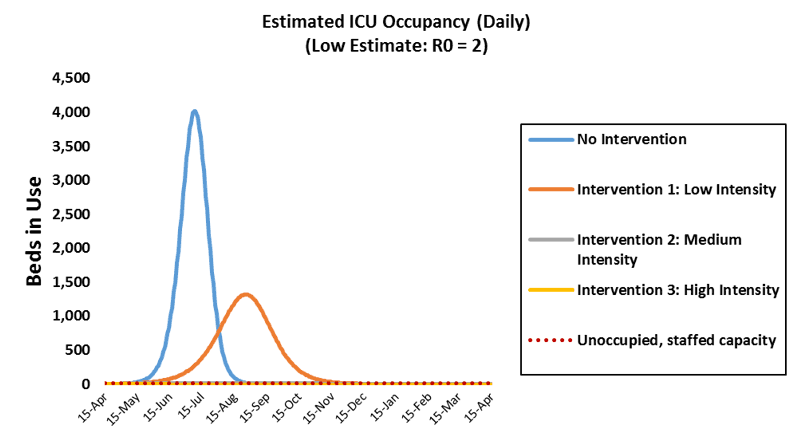
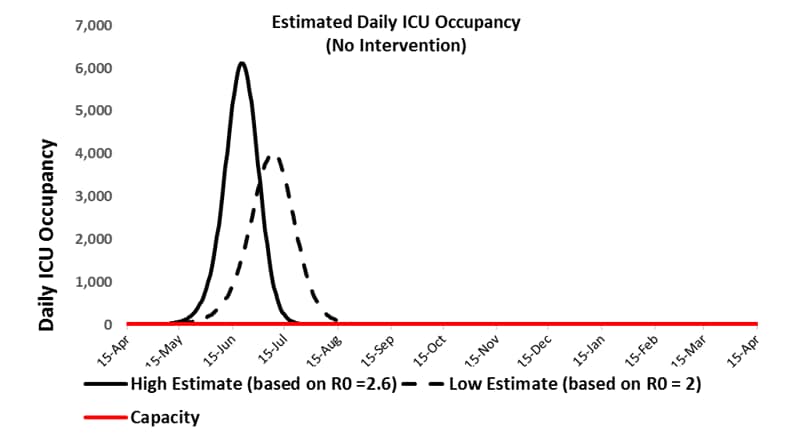
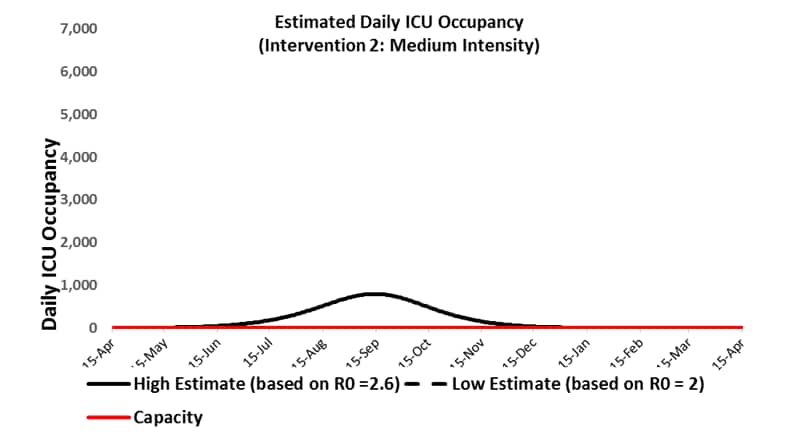
Below are some examples of the output produced by COVID-19Surge for a population of 1 million persons; results were calculated using the default values in the tool. The top graph shows the estimated number of daily ICU beds required under different intervention scenarios. The bottom two graphs provide additional, detailed estimates of the number of daily ICU beds needed, assuming no intervention (bottom left) and (bottom right) assuming a “medium intensity” intervention (50% reduction in infectiousness due to community interventions). The red lines shown in the two bottom graphs plot the available ICU beds. The black lines show daily cases requiring ICU admittance, with the solid lines estimated assuming 2.6 persons infected per infectious person, and the dotted lines estimated assuming 2.0 persons infected per infectious person (note: not all lines are visible due to the scale). A COVID-19Surge user can alter such output by readily changing one or more of the input values.
Example output: Estimated demand for ICU beds assuming different levels of effectiveness for community interventions
Example output: Details of estimated demand for ICU beds assuming different levels of: i) Numbers infected per infectious person (Ro); ii) effectiveness for community interventions
To receive email updates about COVID-19, enter your email address: