Liver Cancer Incidence in the American Indian and Alaska Native Population, United States—2012–2016 (Purchased/Referred Care Delivery Areas)
U.S. Cancer Statistics Data Briefs, No. 13
October 2019
This data brief uses the most recent data available at the time of publication. More recent data may be available in a newer data brief or in the U.S. Cancer Statistics Data Visualizations tool.
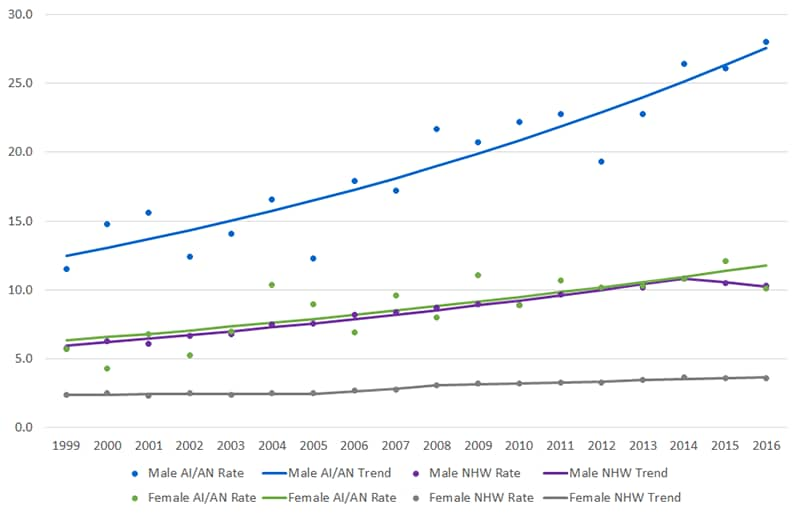
Rates of liver cancer increased significantly for both American Indian and Alaska Native (AI/AN) populations and White populations among males and females. Overall, the rates of liver cancer are significantly higher for AI/AN males compared with AI/AN females and the White population, and the disparities have grown larger over time.
Common risk factors for liver cancer include having hepatitis B or hepatitis C, cirrhosis, or hemochromatosis. Other risk factors are excessive alcohol consumption, lack of physical activity, non-alcoholic fatty liver disease, and excess weight gain.
The American Indian and Alaska Native (AI/AN) population has higher rates of liver cancer incidence than non-Hispanic White people in all regions. Efforts to reduce liver cancer rates include vaccinating against hepatitis B, testing for and treating hepatitis C, reducing excessive alcohol use, and promoting healthy eating and physical activity.
Purchased/Referred Care Delivery Areas (PRCDA) are counties that contain federally recognized tribal lands or are adjacent to tribal lands. Race classification for the AI/AN population is more accurate in these counties.
Rates by Sex and Region
Figure 1. Age-Adjusted Liver Cancer Incidence Ratesa by Sex and Region: PRCDA, 2012–2016
aRates are per 100,000 males or females, respectively, and age-adjusted to the 2000 US standard population.
bThe age-adjusted rates in the AI/AN population are significantly different than those in the non-Hispanic White (NHW) population living in PRCDA counties.
Summary
- Rates of liver cancer were much higher for AI/AN males compared with AI/AN females overall (24.7 vs. 10.7) and by region.
- There was distinct regional variation in the AI/AN population, with rates ranging from 15.3 to 29.5 for AI/AN males and 7.4 to 12.1 for AI/AN females. Regional variations were not as strongly observed in the White population.
- Liver cancer incidence rates were 50% to more than 3 times higher for AI/AN males and females compared with the White population.
Rates by Age Group, Sex, and Region
Figure 2. Age-Adjusted Liver Cancer Incidence Ratesa by Age Group, Sex, and Region, PRCDA, 2012–2016
aRates are per 100,000 males or females, respectively, and age-adjusted to the 2000 US standard population.
bThe age-adjusted rates in the AI/AN population are significantly different than those in the non-Hispanic White (NHW) population living in PRCDA counties.
Summary
- There were significant differences between the liver cancer incidence rates in the AI/AN population and in the White population, particularly in the oldest age groups, except in Alaska and the East (males only).
- Rates in the oldest age group were 2 to 3 times higher for AI/AN males and 2.5 to 4 times higher for AI/AN females compared with the White population.
Trends by Sex
Figure 3. Annual Age-Adjusted Liver Cancer Incidence Ratesa and Trend Lines,b AI/AN Population vs. White Population, by Sex, PRCDA, 1999–2016

- Male Non-Hispanic White (1999–2014: 4.1*; 2014–2016: -2.6)
- Male American Indian/Alaska Native (1999–2016: 4.8*)
- Female Non-Hispanic White (1999–2005: 0.5; 2005–2008: 7.6; 2008–2016: 2.3*)
- Female American Indian/Alaska Native (1999–2016: 3.7*)
aRates are per 100,000 people and age-adjusted to the 2000 US standard population.
bTrend lines were calculated using Joinpoint regression analysis: average annual percent change (AAPC).
cThe average annual percent change is significantly different from zero (P<0.5).
Data Source
Data are from the United States Cancer Statistics American Indian/Alaska Native Incidence Database (USCS AIAD). This database includes data from cancer registries participating in CDC’s National Program of Cancer Registries and the National Cancer Institute’s Surveillance, Epidemiology, and End Results program that have been linked with the Indian Health Service patient registration database. The USCS AIAD and PRCDA counties have been described previously.1
These linkages address racial misclassification of the AI/AN population in the central cancer registries. These data met quality criteria for 2012–2016.
Reference
1Espey DK, Wiggins CL, Jim MA, Miller BA, Johnson CJ, Becker TM. Methods for improving cancer surveillance data in American Indian and Alaska Native populations. Cancer 2008;113(5 Suppl):1120–1130.
- U.S. Cancer Statistics Data Visualizations Tool
- Liver Cancer
- National Comprehensive Cancer Control Program (NCCCP)The NCCCP funds all 50 states, the District of Columbia, 6 US Associated Pacific Island and Puerto Rico, and 8 tribes or tribal organizations to establish coalitions, assess the burden of cancer, determine priorities, and develop and implement comprehensive cancer control programs.
Centers for Disease Control and Prevention. Liver Cancer Incidence Among American Indian and Alaska Native Population, 2012–2016 (Purchased/Referred Care Delivery Areas). USCS Data Brief, no. 13. Atlanta, GA: Centers for Disease Control and Prevention, US Department of Health and Human Services; 2019.