Simulating and Evaluating Local Interventions to Improve Cardiovascular Health
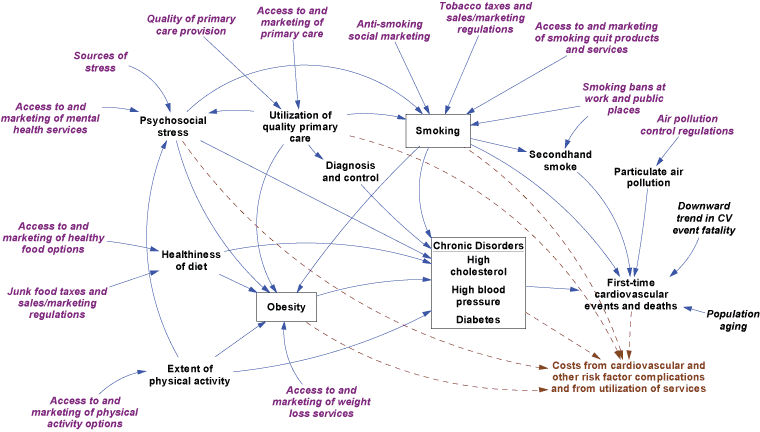
Figure 1. Simulation model for cardiovascular
disease (CVD) outcomes. This diagram depicts major health conditions related to
CVD and their causes. Boxes identify risk factor prevalences modeled as dynamic stocks. The population flows associated with
these stocks — including people entering the adult population, entering the
next age category, immigration, risk factor incidence, recovery,
cardiovascular event survival, and death — are not shown. This diagram consists of word phrases (representing model variables) connected by one-way arrows (representing causal linkages). These words and arrows are in different colors and styles whose meaning is explained in the title and key accompanying the figure. In the center of the diagram are several variables in plain black text, some in boxes representing dynamic stocks and all having both incoming and outgoing arrows. Proceeding from top to bottom and left to right, these variables are “psychosocial stress,” “healthiness of diet,” “extent of physical activity,” “utilization of quality primary care,” “diagnosis and control,” “obesity” (in a box), “smoking” (in a box), “chronic disorders” (with “high cholesterol,” “high blood pressure,” and “diabetes,” together in a box), “secondhand smoke,” “particulate air pollution,” and “first-time cardiovascular events and deaths.” Concepts in purple italic text (representing interventions) lie around the top and left edges of the diagram, having no arrows coming into them, but all having outgoing blue arrows linking into the plain black text variables listed above. The links (moving clockwise from lower left to upper right) are as follows: • “Access to and marketing of weight loss services” links to “obesity.” • “Access to and marketing of physical activity options” links to “extent of physical activity.” • “Access to and marketing of healthy food options” as well as “junk food taxes and sales/marketing regulations” link to “healthiness of diet.” • “Access to and marketing of mental health services” and “sources of stress” link to “psychosocial stress.” • “Quality of primary care provision” and “Access to and marketing of primary care” link to “utilization of quality primary care.” • “Anti-smoking social marketing,” “tobacco taxes and sales/marketing regulations,” “access to and marketing of smoking quit products and services,” and “smoking bans at work and public places” link to “smoking.” • “Smoking bans at work and public places” also links to “secondhand smoke.” • “Air pollution control regulations” links to “particulate air pollution.”
Blue-arrow links also indicate causal connections among the plain black text variables. The links are as follows: • “Extent of physical activity” and “utilization of quality primary care” link to “psychosocial stress.” • “Utilization of quality primary care” links to “diagnosis and control.” • “Psychosocial stress,” “healthiness of diet,” “extent of physical activity,” “utilization of quality primary care,” and “smoking” link to the “obesity” box. • “Utilization of quality primary care” and “psychosocial stress” link to the “smoking” box. • “Psychosocial stress,” “healthiness of diet,” “extent of physical activity,” “diagnosis and control,” “obesity,” and “smoking” link to the “chronic disorders” box. • “Smoking” links to “secondhand smoke.” • “Smoking,” “chronic disorders,” “secondhand smoke, and “particulate air pollution” link to “first-time cardiovascular events and deaths.” To the right of “first-time cardiovascular events and deaths” and leading to it with blue arrows are 2 variables in black italic text with no incoming arrows: “downward trend in CV event fatality” and “population aging.” In the lower right corner of the diagram, in plain brown text, is “costs from cardiovascular and other risk factor complications and from utilization of services.” Leading to this variable are brown arrows from “psychosocial stress,” “obesity,” “utilization of quality primary care,” “smoking,” “chronic disorders,” and “first-time cardiovascular events and deaths.” |
|
|
|
|
|
|
|