Mining Facts - 2014
Overall Mining
The Mine Safety and Health Administration (MSHA) maintains data collected under the Code of Federal Regulations (30 CFR Part 50) on accidents, fatal and nonfatal injuries, illnesses, employment, and coal production. Summary data were obtained from the MSHA data files for mine operators and independent contractors working on mine property. See Statistical Methodology for further information.
Mining Operations
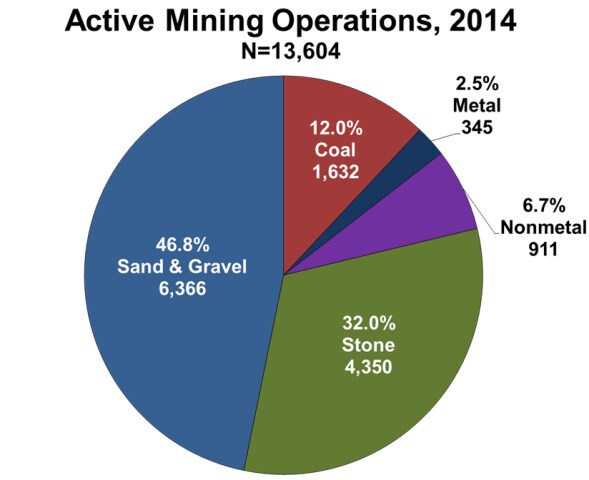
- In 2014, a total of 13,604 mining operations [1] reported employment to MSHA.
- Active mining operations were distributed among the coal (n=1,632; 12.0%), metal and nonmetal (n=1,256; 9.2%), and stone and sand & gravel (n=10,716; 78.8%) industry sectors. [2]
- The majority of the active mining operations were classified as surface (n=12,900; 94.8%). Underground mines accounted for the remainder of operations (n=704; 5.2%).
- The majority of the mining operations produced the primary commodity of sand & gravel (44.4%), followed by crushed and broken limestone (14.2%), and bituminous coal (10.9%).
- Mines reporting to MSHA are located in all 50 states, Puerto Rico, and the Virgin Islands. Pennsylvania had the most active mines in 2014 (n=880; 6.5%). Almost half (48.6%) of the active mining operations were located in the 13 states with the highest number of mining operations.
Click on the image to enlarge.
Data for the previous chart showing the number of active mining operations and percent of total by commodity in 2014 (N=13,604)
| Commodity | Number of Mines | Percentage of Total |
|---|---|---|
| Coal | 1,632 | 12.0 |
| Metal | 345 | 2.5 |
| Nonmetal | 911 | 6.7 |
| Stone | 4,350 | 32.0 |
| Sand & Gravel | 6,366 | 46.8 |
Employees
- A total of 366,535 employees, [3] corresponding to 311,476 full-time equivalent (FTE) [4] employees, were reported to MSHA by mine operators and independent contractors. [5]
- The average number of mine operator employees comprised 67.9% of the workforce compared to 32.1% for independent contractors.
- Within the mining commodities, [6] coal mine operator employees accounted for 27.6% of all employee hours reported, followed by stone operators (20.9%), metal operators (14.8%), noncoal contractors (13.0%), sand & gravel operators (8.5%), nonmetal operators (8.5%), and coal contractors (6.8%).
- The FTE employees reported for surface [7] work locations were higher (n=250,525; 80.4%) than those at underground work locations (n=60,951; 19.6%).
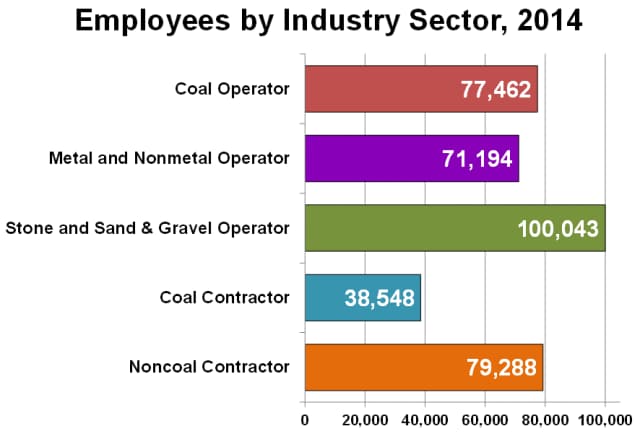
- The distribution of employees by industry sector included coal operators (n=77,462; 21.1%), metal and nonmetal operators (n=71,194; 19.4%), stone and sand & gravel operators (n=100,043; 27.3%), coal contractors (n=38,548; 10.5%), and noncoal contractors (n=79,288; 21.6%).
Click on the image to enlarge.
Data for the previous chart showing the average number of employees by industry sector in 2014
| Industry Sector | Number of Employees |
|---|---|
| Coal Operator | 77,462 |
| Metal and Nonmetal Operator | 71,194 |
| Stone and Sand & Gravel Operator | 100,043 |
| Coal Contractor | 38,548 |
| Noncoal Contractor | 79,288 |
Occupational Fatalities
- There were 43 occupational fatalities reported to MSHA in 2014. This compares to 41 in 2013.
- The number of fatalities reported by mine operators was 33 (76.7%) and independent contractors reported 10 (23.3%).
- Within the industry sectors, stone and sand & gravel had the highest number of fatalities (n=17; 39.5%), followed by the coal sector (n=15; 34.9%), and the metal and nonmetal sector (n=11; 25.6%).
- Fatalities occurred at surface work locations in 65.1% of the cases (n=28) with the remainder (n=15; 34.9%) occurring at underground work locations.
- The overall fatality rate was 15.1 [95% confidence interval (CI): 11.0, 20.4] per 100,000 FTE employees.
- The fatality rate of 24.6 [CI: 13.8, 40.6] for underground workers was higher than the surface worker rate of 12.6 [CI: 8.3, 18.1].
- The fatality rate for mine operators was 14.6 [CI: 10.1, 20.5] (n=33). Independent contractors had a fatality rate of 17.2 [CI: 8.3, 31.7] (n=10).
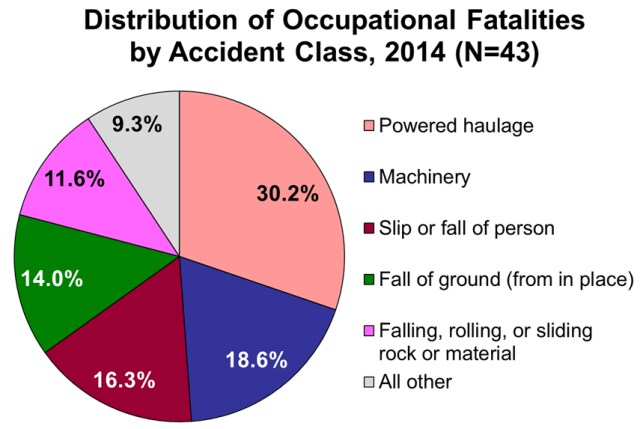
- The highest number of fatalities reported by accident classification was for powered haulage (n=13; 30.2%).
- The nature of injury most frequently reported for the fatalities was multiple injuries (n=18; 43.9%), followed by crushing (n=15; 34.9%).
- Nearly half (n=21; 48.8%) of the parts of body most frequently reported for fatalities was the category for multiple parts.
Click on the image to enlarge.
Data for the previous chart showing the distribution of occupational fatalities by accident class for 2014 (N=43)
| Accident Classification | Percentage of Total |
|---|---|
| Powered haulage | 30.2 |
| Machinery | 18.6 |
| Slip or fall of person | 16.3 |
| Fall of ground (from in place) | 14.0 |
| Falling, rolling, or sliding rock or material | 11.6 |
| All other | 9.3 |
Nonfatal Lost-time Injuries
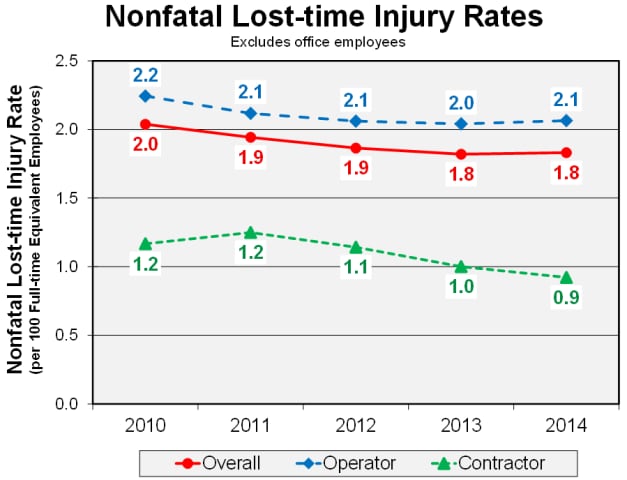
- In 2014, there were 5,199 nonfatal lost-time injuries occurring at an overall rate of 1.8 [CI: 1.8, 1.9] per 100 FTE employees. This compares to 5,258 nonfatal lost-time injuries in 2013 occurring at a matching rate.
- These injuries occurred at underground (n=1,853; 35.6%) and surface (n=3,346; 64.4%) work locations.
- A total of 340,430 days were lost from work [8] as a result of these injuries.
- The nonfatal lost-time injury rate for mine operators was 2.1 [CI: 2.0, 2.1] per 100 FTE employees, and the independent contractor injury rate was 0.9 [CI: 0.8, 1.0].
- Underground workers had a higher rate of nonfatal lost-time injuries at 3.0 [CI: 2.9, 3.2]. The rate for surface workers was 1.5 [CI: 1.4, 1.6) per 100 FTE employees.
- The most frequent accident classification of nonfatal lost-time injuries involved handling materials (n=1,911; 36.8%), followed by slip or fall of person (n=1,357; 26.1%).
- Sprains or strains was the most frequently reported nature of injury (n=2,311; 44.5%). This was followed by injuries involving fractures and chips (n=945; 18.2%); cuts, lacerations, and punctures (n=497; 9.6%); and contusions and bruises (n=471; 9.1%).
- The back was the most frequently reported body part injured (n=926; 17.8%) resulting in 59,796 days lost from work. This was followed by injuries to the finger (n=666; 12.8%; 30,869 days lost), knee (n=544; 10.5%; 34,274 days lost), and shoulder (n=496; 9.5%; 45,467 days lost).
Click on the image to enlarge.
Data for the previous chart showing the rate (per 100 full-time equivalent employees) of nonfatal lost-time injuries by year, 2010–2014 (excludes office employees)
| Year | Overall | Operator | Contractor |
|---|---|---|---|
| 2010 | 2.0 | 2.2 | 1.2 |
| 2011 | 1.9 | 2.1 | 1.2 |
| 2012 | 1.9 | 2.1 | 1.1 |
| 2013 | 1.8 | 2.0 | 1.0 |
| 2014 | 1.8 | 2.1 | 0.9 |
Coal Mine Operator Industry Sector
Mining Operations
- In 2014, a total of 1,632 coal mining operations reported employment to MSHA. This compares to 1,700 coal mining operations in 2013.
- Bituminous mines comprised 91.2% (n=1,488) and anthracite mines 8.8% (n=144) of all coal mining operations.
- The majority of coal mines are classified as surface mines (n=1,185; 72.6%).
- Approximately 71% of all coal mines were located in three states: Kentucky (n=418; 25.6%), Pennsylvania (n=381; 23.3%), and West Virginia (n=364; 22.3%).
Employees
- A total of 77,462 employees, corresponding to 85,829 FTE employees, were reported by coal mine operators.
- Within the mining commodity sectors, coal mine operator employees accounted for 21.1% of all employee hours reported.
- The average number of employees at underground work locations was reported as 38,172 (49.3%) and 39,290 (50.7%) employees were reported as working at surface locations.
Occupational Fatalities
- There were 13 occupational fatalities (10 occurring underground and 3 at surface work locations) reported among coal mine operator employees in 2014.
- The fatality rate was 15.7 [CI: 8.3, 26.8] per 100,000 FTE employees.
- The distribution of coal operator fatalities by accident classification was powered haulage (n=4; 30.8%), fall of ground (n=4; 30.8%), machinery (n=4; 30.8%), and electrical (n=1; 7.7%).
- The nature of injury for these coal mine operator fatalities was crushing (n=7; 53.8%), followed by multiple injuries (n=5; 38.5%) and electric shock and electrocution (n=1; 7.7%).
Nonfatal Lost-time Injuries
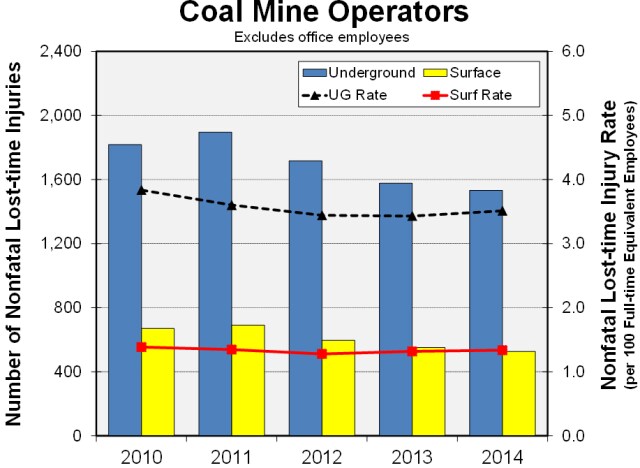
- There were 2,059 nonfatal lost-time injuries (1,532 at underground and 527 at surface work locations) among coal mine operators occurring at a rate of 2.5 [CI: 2.4, 2.6] per 100 FTE employees. A total of 159,895 days lost from work resulted from these injuries.
- The most frequent accident classification of nonfatal lost-time injuries for coal mine operator employees involved handling materials (n=730; 35.5%), followed by slip or fall of person (n=505; 24.5%).
- Sprains or strains was the most frequently reported nature of injury (n=983; 47.7%). This was followed by fractures or chips (n=415; 20.2%).
- The back was the most frequently reported body part injured (n=414; 20.1%). This was followed by injuries to the knee (n=227; 11.0%), fingers (n=209; 10.2%), and shoulders (n=202; 9.8%).
Click on the image to enlarge.
Data for the previous chart showing the number and rate (per 100 full-time equivalent employees) of coal mine operator nonfatal lost-time injuries by work location and year, 2010–2014 (excludes office employees)
| Year | Underground Number | Underground Rate | Surface Number | Surface Rate |
|---|---|---|---|---|
| 2010 | 1,818 | 3.8 | 670 | 1.4 |
| 2011 | 1,896 | 3.6 | 691 | 1.3 |
| 2012 | 1,717 | 3.4 | 596 | 1.3 |
| 2013 | 1,577 | 3.4 | 551 | 1.3 |
| 2014 | 1,532 | 3.5 | 527 | 1.3 |
Metal and Nonmetal Mine Operator Industry Sector
Mining Operations
- A total of 1,256 metal and nonmetal mining operations reported employment to MSHA in 2014. This compares to 1,231 mines reported in 2013.
- There were 1,116 surface and 140 underground metal and nonmetal mines.
- The primary commodity of “sand, industrial, ground silica/quartz” comprised the largest number of metal and nonmetal mining operations (n=285; 22.7%). This was followed by gold (n=191; 15.2%) and common clay (n=138; 11.0%).
- The leading Standard Industrial Classification for primary commodity mined at metal mining operations was gold (n=191; 55.4%). Nonmetal mining operations reported “sand, industrial, ground silica/quartz” as the primary commodity mined (n=285; 31.3%).
- Active metal and nonmetal mining operations are found throughout 48 states and Puerto Rico (no active mines in Hawaii, New Hampshire, or the Virgin Islands).
- The majority of metal and nonmetal mining operations are classified as surface mines (n=1,116; 88.9%).
- Nevada had the largest number of metal and nonmetal mines (n=114; 9.1%), followed by California (n=93; 7.4%), and Texas (n=85; 6.8%).
Employees
- Metal and nonmetal mine operators reported a total of 71,194 employees, corresponding to 72,428 FTE employees.
- Within the mining commodity sectors, metal and nonmetal mine operator employees accounted for 23.3% of all employee hours reported.
- Metal and nonmetal employees were reported for both underground (12.8%) and surface (87.2%) work locations.
Occupational Fatalities
- There were 8 occupational fatalities (2 occurring underground and 6 at surface work locations) reported among metal and nonmetal mine operator employees in 2014. This compares to 7 fatalities reported in 2013.
- The fatality rate was 12.5 [CI: 5.4, 24.7] per 100,000 FTE employees.
- The highest number of fatalities by accident classification was powered haulage (n=5; 62.5%).
- The nature of injury with the highest frequency was crushing (n=4; 50.0%).
Nonfatal Lost-time Injuries
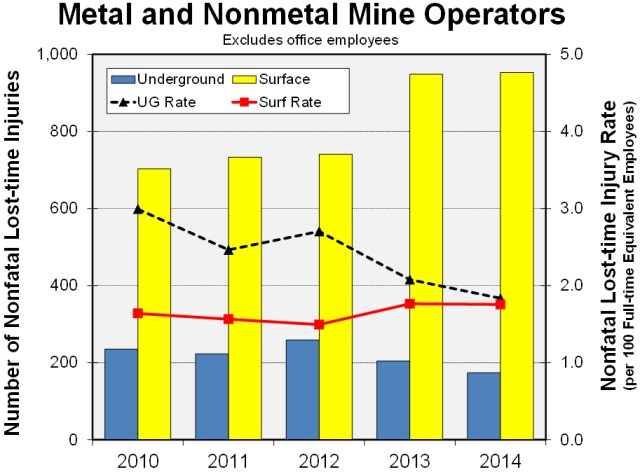
- There were 1,127 nonfatal lost-time injuries (174 at underground and 953 at surface work locations) among metal and nonmetal operators occurring at a rate of 1.8 [CI: 1.7, 1.9] per 100 FTE employees. A total of 56,633 days lost from work resulted from these injuries.
- The most frequent accident classification of nonfatal lost-time injuries for metal and nonmetal mine operator employees involved handling materials (n=409; 36.3%) followed by slip or fall of person (n=308; 27.3%).
- Sprains or strains was the most frequently reported nature of injury (n=550; 48.8%).
- The back was the most frequently reported body part injured (n=191; 16.9%). This was followed by injuries to fingers (n=143; 12.7%), knees (n=142; 12.6%), and shoulders (n=127; 11.3%).
 Click on the image to enlarge.
Data for the previous chart showing the number and rate (per 100 full-time equivalent employees) of metal and nonmetal mine operator nonfatal lost-time injuries by work location and year, 2010–2014 (excludes office employees)
| Year | Underground Number | Underground Rate | Surface Number | Surface Rate |
|---|---|---|---|---|
| 2010 | 235 | 3.0 | 703 | 1.6 |
| 2011 | 223 | 2.5 | 733 | 1.6 |
| 2012 | 259 | 2.7 | 741 | 1.5 |
| 2013 | 204 | 2.1 | 948 | 1.8 |
| 2014 | 174 | 1.8 | 953 | 1.8 |
Stone and Sand & Gravel Mine Operator Industry Sector
Mining Operations
- A total of 10,716 stone and sand & gravel mining operations reported employee hours to MSHA in 2014. This compares to 10,828 active mines in 2013.
- There were 10,599 surface stone and sand & gravel mining operations and 117 underground stone mining operations.
- Stone and sand & gravel mines were found throughout all 50 states, the Virgin Islands, and Puerto Rico.
- In stone mining, crushed and broken limestone was the primary commodity for the largest number of mining operations (n=1,926; 44.3%).
- Pennsylvania had the most stone mines (n=399; 9.2%), followed by Texas (n=382; 8.8%).
- Sand & gravel is the primary commodity mined at sand & gravel mines (n=6,038; 94.8%). The other primary commodity mined was construction sand & gravel and common sand (n=328; 5.2%).
- The states with the leading number of sand & gravel mines were Minnesota (n=496; 7.8%), New York (n=394; 6.2%), Wisconsin (n=380; 6.0%), and Michigan (n=348; 5.5%).
Employees
- There were 100,043 employees, corresponding to 91,581 FTE employees, reported by stone and sand & gravel mine operators.
- Within the mining commodity sectors, stone and sand & gravel mine operator employees accounted for 29.4% of all employee hours reported.
- All sand & gravel operator hours reported were for surface work locations. Stone operator hours were reported for both underground (3.2%) and surface (96.8%) work locations.
Occupational Fatalities
- In 2014, there were 12 occupational fatalities reported among stone and sand & gravel mine operators, the same number reported in 2013.
- Ten of these fatalities occurred at surface work areas of the mine and two occurred at underground work locations.
- The fatality rate was 15.2 [CI: 7.8, 26.5] per 100,000 FTE employees.
- Falling, rolling, or sliding rock or material was the accident classification with the most fatalities (n=4; 33.3%).
- The leading nature of injury for these fatalities was multiple injuries (n=6; 50.0%).
Nonfatal Lost-time Injuries
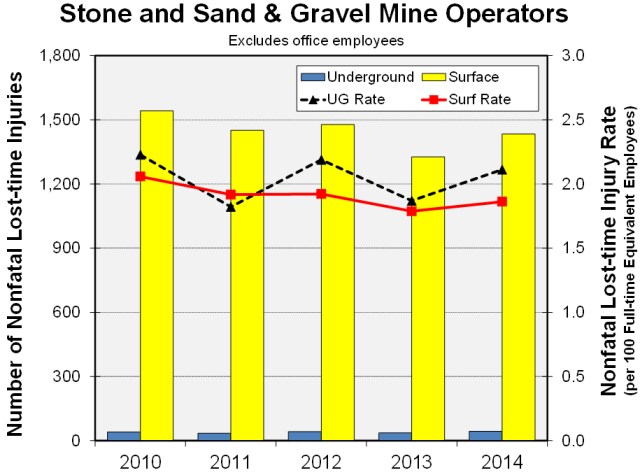
- There were 1,478 nonfatal lost-time injuries (44 at underground and 1,434 at surface work locations) among stone and sand & gravel operators occurring at a rate of 1.9 [CI: 1.8, 2.0] per 100 FTE employees. A total of 88,824 days lost from work resulted from these injuries.
- The leading accident classification of nonfatal lost-time injuries for stone and sand & gravel operator employees involved handling materials (n=593; 40.1%), followed by slip or fall of person (n=377; 25.5%).
- Sprains or strains was the most frequently reported nature of injury (n=615; 41.6%), followed by fractures and chips (n=254; 17.2%).
- The back was the most frequently reported body part injured (n=250; 16.9%). This was followed by injuries to fingers (n=235; 15.9%), the knee (n=141; 9.5%), and shoulders (n=129; 8.7%).
Click on the image to enlarge.
Data for the previous chart showing the number and rate (per 100 full-time equivalent employees) of stone and sand & gravel mine operator nonfatal lost-time injuries by work location and year, 2010–2014 (excludes office employees)
| Year | Underground Number | Underground Rate | Surface Number | Surface Rate |
|---|---|---|---|---|
| 2010 | 41 | 2.2 | 1,542 | 2.1 |
| 2011 | 35 | 1.8 | 1,451 | 1.9 |
| 2012 | 42 | 2.2 | 1,478 | 1.9 |
| 2013 | 36 | 1.9 | 1,327 | 1.8 |
| 2014 | 44 | 2.1 | 1,434 | 1.9 |
Coal and Noncoal Independent Contractors
An independent contractor is defined by MSHA as “any person, partnership, corporation, subsidiary of a corporation, firm, association or other organization that contracts to perform services or construction at a mine.” Contractors that perform specific types of work are required to report the number of employees who work at coal mines and noncoal mines.
Independent Contracting Companies
- A total of 10,042 independent contracting companies reported employee hours to MSHA.
- Coal contractors accounted for 3,006 of the companies (29.9%), and 7,036 (70.1%) were noncoal (metal, nonmetal, stone, and sand & gravel) contracting companies.
Employees
- Independent contractors reported a total of 117,836 employees, corresponding to 61,638 FTE employees.
- Coal contractor employees comprised 32.7% (n=38,548) of the contractor employment, and noncoal contractor employees represented 67.3% with 79,288 employees reported.
- The distribution of employee hours for coal contractors was 18.0% for underground work locations and 82.0% for surface locations.
- Noncoal contractor employee hours were reported at underground locations 4.8% of the time with 95.2% of the hours being worked at surface locations.
Occupational Fatalities
- In 2014, ten occupational fatalities occurred among independent contractor employees at a rate of 17.2 [CI: 8.3, 31.7] per 100,000 FTE employees. This compares to four occupational fatalities in 2013 (no fatality rates are calculated when the number of fatalities is less than five).
- Two of these fatalities were attributed to coal contractors and eight fatalities were for noncoal contractors.
- Nine of these fatalities occurred at surface areas of the mine and one fatality occurred underground.
- Of the contractor fatalities, four had an accident classification of slip or fall of person, three were powered haulage, two were machinery, and one fatality was classified as falling, rolling, or sliding rock or material.
Nonfatal Lost-time Injuries
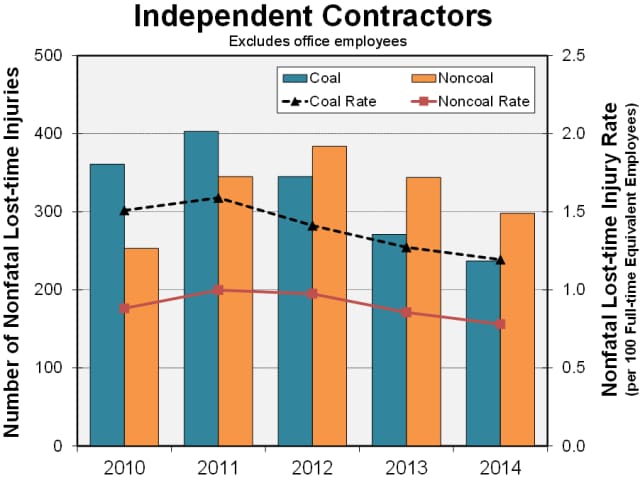
- There were 535 nonfatal lost-time injuries among contractor employees (103 at underground and 432 at surface work locations) with an overall rate of 0.9 [CI: 0.8, 1.0] injuries per 100 FTE employees.
- The underground nonfatal lost-time injury rate of 1.8 [CI: 1.4, 2.1] was greater than the surface injury rate of 0.8 [CI: 0.7, 0.9] per 100 FTE workers.
- Of the total injuries, 237 were attributed to coal contractors and 298 were for noncoal contractors.
- The leading contractor classification of nonfatal lost-time injuries involved handling materials (n=179; 33.5%), followed by slip or fall of person (n=167; 31.2%).
- The back was the most frequently reported part of body injured for coal contractors (n=33; 13.9%) followed by fingers (n=30; 12.7%). The leading parts of body injured for noncoal contractors were fingers (n=49; 16.4%) and the back (n=38; 12.8%).
- Sprains and strains was the most frequently reported nature of injury for coal contractors (n=82; 34.6%) and also for noncoal contractors (n=81; 27.2%).
Click on the image to enlarge.
Data for the previous chart showing the number and rate (per 100 full-time equivalent employees) of coal and noncoal contractor lost-time injuries by year, 2010–2014 (excludes office employees)
| Year | Coal Number | Coal Rate | Noncoal Number | Noncoal Rate |
|---|---|---|---|---|
| 2010 | 361 | 1.5 | 253 | 0.9 |
| 2011 | 403 | 1.6 | 345 | 1.0 |
| 2012 | 345 | 1.4 | 384 | 1.0 |
| 2013 | 271 | 1.3 | 344 | 0.9 |
| 2014 | 237 | 1.2 | 298 | 0.8 |
Notes
Publicly released employment and accident/injury/illness data were collected by the Mine Safety and Health Administration (MSHA) under the Code of Federal Regulations (30 CFR 50). All analyses of accident data exclude office employees. Occupational fatalities exclude all cases under 17 years of age. Caution should be used when interpreting rates based on a small number of events.
[1] Both mine operator and independent contractor employees work at mining operations. Active mines are those that report any mine o operator employment. Mines at which only independent contractors were working and did not show any operator employment were not counted.
[2] Mining industry sectors include: (1) coal, (2) metal and nonmetal, and (3) stone and sand & gravel.
[3] Average number of employees working at individual mines during calendar quarters of active operations (includes office workers).
[4] Full-time equivalent employees computed using reported employee hours (2,000 hours = 1 FTE; includes office workers).
[5] Independent contractors do not report mine-specific information for employment. The data they provide are summaries for all coal and all noncoal (metal, nonmetal, stone, and sand & gravel) mining operations. For this reason, contractors cannot be included when computing fatality and injury rates for either the metal and nonmetal or the stone and sand & gravel industry sectors.
[6] Mining commodity and type of employer classes include coal operators, metal operators, nonmetal operators, stone operators, sand & gravel operators, coal contractors, and noncoal (metal, nonmetal, stone, and sand & gravel) contractors.
[7] Surface work locations include surface operations at underground mines, surface operations (strip or open pit), dredge, other surface operations, independent shops and yards, and mills or preparation plants.
[8] Total days lost includes actual days away from work and/or days of restricted work activity. For permanently disabling injuries only, statutory days charged by MSHA were used if they exceeded the total lost workdays.
Data Tables
Active Mining Operations, 2014
| Commodity and Industry Sector | Underground | Surface | Total |
|---|---|---|---|
| Coal | 447 | 1,185 | 1,632 |
| Coal Sector | 447 | 1,185 | 1,632 |
| Metal | 96 | 249 | 345 |
| Nonmetal | 44 | 867 | 911 |
| Metal and Nonmetal Sector | 140 | 1,116 | 1,256 |
| Stone | 117 | 4,233 | 4,350 |
| Sand & Gravel | 0 | 6,366 | 6,366 |
| Stone and Sand & Gravel Sector | 117 | 10,599 | 10,716 |
| TOTAL | 704 | 12,900 | 13,604 |
Independent Contracting Companies, 2014
| Commodity | Companies |
|---|---|
| Coal | 3,006 |
| Noncoal | 7,036 |
| Total | 10,042 |
Employment Characteristics, 2014
| Commodity, Type of Employer, Industry Sector | Underground Employees |
Surface Employees | Total Employees |
Underground FTE Employees | Surface FTE Employees | Total FTE Employees |
|---|---|---|---|---|---|---|
| Coal Operator Sector | 38,172 | 39,290 | 77,462 | 43,623 | 42,206 | 85,829 |
| Metal Operator | 6,424 | 38,414 | 44,838 | 6,540 | 39,548 | 46,089 |
| Nonmetal Operator | 2,709 | 23,647 | 26,356 | 2,944 | 23,396 | 26,339 |
| Metal and Nonmetal Operator Sector | 9,133 | 62,061 | 71,194 | 9,484 | 62,944 | 72,428 |
| Stone Operator | 1,878 | 63,804 | 65,682 | 2,083 | 63,050 | 65,133 |
| Sand & Gravel Operator | 0 | 34,361 | 34,361 | 0 | 26,447 | 26,447 |
| Stone and Sand & Gravel Operator Sector | 1,878 | 98,165 | 100,043 | 2,083 | 89,498 | 91,581 |
| Operator Total | 49,183 | 199,516 | 248,699 | 55,190 | 194,648 | 249,838 |
| Coal Contractor | 6.068 | 32,480 | 38,548 | 3,805 | 17,356 | 21,161 |
| Noncoal Contractor | 2,826 | 76,462 | 79,288 | 1,955 | 38,522 | 40,477 |
| Contractor Total | 8,894 | 108,942 | 117,836 | 5,761 | 55,877 | 61,638 |
| TOTAL | 58,077 | 308,458 | 366,535 | 60,951 | 250,525 | 311,476 |
| Note: Components may not sum to totals due to rounding | ||||||
Occupational Fatalities, 2014
| Commodity, Type of Employer, Industry Sector | Total Number | Total Rate | Total Lower CI | Total Upper CI |
|---|---|---|---|---|
| Coal Operator Sector | 13 | 15.7 | 8.3 | 26.8 |
| Metal Operator | 3 | NC | NC | NC |
| Nonmetal Operator | 5 | 22.2 | 7.2 | 51.8 |
| Metal and Nonmetal Operator Sector | 8 | 12.5 | 5.4 | 24.7 |
| Stone Operator | 5 | 8.9 | 2.9 | 20.9 |
| Sand & Gravel Operator | 7 | 30.3 | 12.2 | 62.3 |
| Stone and Sand & Gravel Operator Sector | 12 | 15.2 | 7.8 | 26.5 |
| Operator Total | 33 | 14.6 | 10.1 | 20.5 |
| Coal Contractor | 2 | NC | NC | NC |
| Noncoal Contractor | 8 | 21.0 | 9.0 | 41.3 |
| Contractor Total | 10 | 17.2 | 8.3 | 31.7 |
| TOTAL | 43 | 15.1 | 11.0 | 20.4 |
| Note: NC–Not calculated when N is less than 5 | ||||
Occupational Fatalities (Underground), 2014
| Commodity, Type of Employer, Industry Sector | Underground Number |
Underground Rate |
Underground Lower CI |
Underground Upper CI |
|---|---|---|---|---|
| Coal Operator Sector | 10 | 22.9 | 11.0 | 42.2 |
| Metal Operator | 2 | NC | NC | NC |
| Nonmetal Operator | 0 | NC | NC | NC |
| Metal and Nonmetal Operator Sector | 2 | NC | NC | NC |
| Stone Operator | 2 | NC | NC | NC |
| Sand & Gravel Operator | NA | NA | NA | NA |
| Stone and Sand & Gravel Operator Sector | 2 | NC | NC | NC |
| Operator Total | 14 | 25.4 | 13.9 | 42.6 |
| Coal Contractor | 0 | NC | NC | NC |
| Noncoal Contractor | 1 | NC | NC | NC |
| Contractor Total | 1 | NC | NC | NC |
| TOTAL | 15 | 24.6 | 13.8 | 40.6 |
| Notes: NA–Not applicable; NC–Not calculated when N is less than 5 | ||||
Occupational Fatalities (Surface), 2014
| Commodity, Type of Employer, Industry Sector | Surface Number | Surface Rate | Surface Lower CI | Surface Upper CI |
|---|---|---|---|---|
| Coal Operator Sector | 3 | NC | NC | NC |
| Metal Operator | 1 | NC | NC | NC |
| Nonmetal Operator | 5 | 25.6 | 8.3 | 59.6 |
| Metal and Nonmetal Operator Sector | 6 | 11.1 | 4.1 | 24.1 |
| Stone Operator | 3 | NC | NC | NC |
| Sand & Gravel Operator | 7 | 30.3 | 12.2 | 62.3 |
| Stone and Sand & Gravel Operator Sector | 10 | 13.0 | 6.2 | 23.9 |
| Operator Total | 19 | 11.1 | 6.7 | 17.4 |
| Coal Contractor | 2 | NC | NC | NC |
| Noncoal Contractor | 7 | 19.3 | 7.8 | 39.8 |
| Contractor Total | 9 | 17.2 | 7.9 | 32.7 |
| TOTAL | 28 | 12.6 | 8.3 | 18.1 |
| Note: NC–Not calculated when N is less than 5 | ||||
Nonfatal Lost-time Injuries, 2014
| Commodity, Type of Employer, Industry Sector | Total Number | Total Rate | Total Lower CI | Total Upper CI |
|---|---|---|---|---|
| Coal Operator Sector | 2,059 | 2.5 | 2.4 | 2.6 |
| Metal Operator | 744 | 1.8 | 1.7 | 1.9 |
| Nonmetal Operator | 383 | 1.7 | 1.5 | 1.9 |
| Metal and Nonmetal Operator Sector | 1,127 | 1.8 | 1.7 | 1.9 |
| Stone Operator | 1,157 | 2.1 | 1.9 | 2.2 |
| Sand & Gravel Operator | 321 | 1.4 | 1.2 | 1.5 |
| Stone and Sand & Gravel Operator Sector | 1,478 | 1.9 | 1.8 | 2.0 |
| Operator Total | 4,664 | 2.1 | 2.0 | 2.1 |
| Coal Contractor | 237 | 1.2 | 1.0 | 1.3 |
| Noncoal Contractor | 298 | 0.8 | 0.7 | 0.9 |
| Contractor Total | 535 | 0.9 | 0.8 | 1.0 |
| TOTAL | 5,199 | 1.8 | 1.8 | 1.9 |
Nonfatal Lost-time Injuries (Underground), 2014
| Commodity, Type of Employer, Industry Sector | Underground Number |
Underground Rate |
Underground Lower CI |
Underground Upper CI |
|---|---|---|---|---|
| Coal Operator Sector | 1,532 | 3.5 | 3.3 | 3.7 |
| Metal Operator | 128 | 2.0 | 1.6 | 2.3 |
| Nonmetal Operator | 46 | 1.6 | 1.1 | 2.1 |
| Metal and Nonmetal Operator Sector | 174 | 1.8 | 1.6 | 2.1 |
| Stone Operator | 44 | 2.1 | 1.5 | 2.8 |
| Sand & Gravel Operator | NA | NA | NA | NA |
| Stone and Sand & Gravel Operator Sector | 44 | 2.1 | 1.5 | 2.8 |
| Operator Total | 1,750 | 3.2 | 3.0 | 3.3 |
| Coal Contractor | 86 | 2.3 | 1.8 | 2.8 |
| Noncoal Contractor | 17 | 0.9 | 0.5 | 1.4 |
| Contractor Total | 103 | 1.8 | 1.4 | 2.1 |
| TOTAL | 1,853 | 3.0 | 2.9 | 3.2 |
| Note: NA–Not applicable | ||||
Nonfatal Lost-time Injuries (Surface), 2014
| Commodity, Type of Employer, Industry Sector | Surface Number | Surface Rate | Surface Lower CI | Surface Upper CI |
|---|---|---|---|---|
| Coal Operator Sector | 527 | 1.3 | 1.2 | 1.5 |
| Metal Operator | 616 | 1.8 | 1.6 | 1.9 |
| Nonmetal Operator | 337 | 1.7 | 1.5 | 1.9 |
| Metal and Nonmetal Operator Sector | 953 | 1.8 | 1.6 | 1.9 |
| Stone Operator | 1,113 | 2.1 | 1.9 | 2.2 |
| Sand & Gravel Operator | 321 | 1.4 | 1.2 | 1.5 |
| Stone and Sand & Gravel Operator Sector | 1,434 | 1.9 | 1.8 | 2.0 |
| Operator Total | 2,914 | 1.7 | 1.6 | 1.8 |
| Coal Contractor | 151 | 0.9 | 0.8 | 1.1 |
| Noncoal Contractor | 281 | 0.8 | 0.7 | 0.9 |
| Contractor Total | 432 | 0.8 | 0.7 | 0.9 |
| TOTAL | 3,346 | 1.5 | 1.4 | 1.6 |
- Coal and metal/nonmetal mining facts - 2008
- Coal and Metal/Nonmetal Mining Facts - 2008 (HTML)
- Coal Contractor Mining Facts - 2001
- Coal Contractor Mining Facts - 2002
- Coal Contractor Mining Facts - 2003
- Coal Contractor Mining Facts - 2004
- Coal Contractor Mining Facts - 2005
- Coal Contractor Mining Facts - 2006
- Coal Contractor Mining Facts - 2007
- Data & Statistics
- Mining Fact Sheets
- Rib Falls: A Major Ground Control Issue
- Statistical Methodology
