 |
|
|
|
|
|
|
| ||||||||||
|
|
|
|
|
|
|
||||
| ||||||||||
|
|
|
|
|
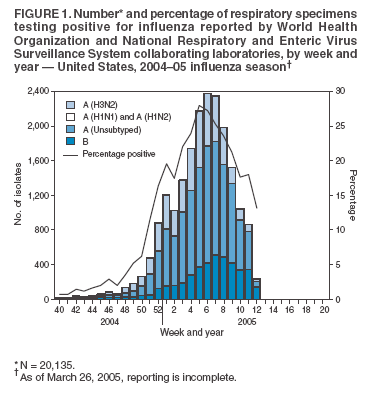
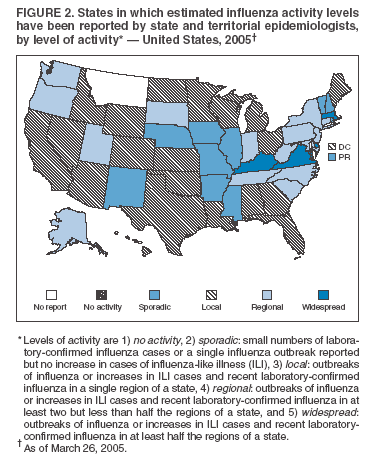
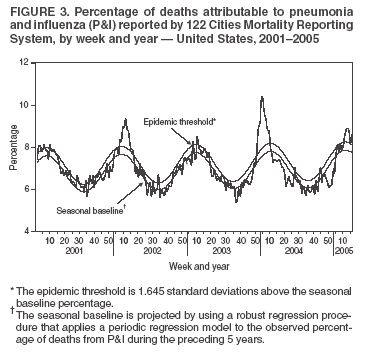
Persons using assistive technology might not be able to fully access information in this file. For assistance, please send e-mail to: mmwrq@cdc.gov. Type 508 Accommodation and the title of the report in the subject line of e-mail. Update: Influenza Activity --- United States, 2004--05 SeasonThis report summarizes influenza activity in the United States during October 3, 2004--March 26, 2005,* updates the previous summary (1), and describes the composition of the 2005--06 influenza vaccine. Influenza activity was moderate in the United States overall, but varied by region. Preliminary data collected through the seven components of the CDC Influenza Surveillance System† indicate that national influenza activity peaked in early-February. Influenza Viral Surveillance and CharacterizationAs of the week ending March 26, the World Health Organization (WHO) and National Respiratory and Enteric Virus Surveillance System collaborating laboratories in the United States had tested 121,373 respiratory specimens for influenza viruses; 20,135 (16.6%) were positive. The percentage of specimens that tested positive for influenza first exceeded 10.0% during the week ending December 25, 2004, and peaked at 27.8% (Figure 1) during the week ending February 5, 2005. During the 2001--02, 2002--03, and 2003--04 influenza seasons, peak percentages of specimens that tested positive for influenza ranged from 24.9% to 34.7% (CDC, unpublished data, 2004). The timing of the peaks varied from late November during the 2003--04 season to mid-to-late February during the 2001--02 season. During the weeks ending March 12--26, 2005, the percentage of specimens that tested positive for influenza ranged from 7.5% in the Pacific region to 28.5% in the South Atlantic region§. Of the 20,135 influenza viruses reported since October 3, 2004, a total of 15,932 (79.1%) were influenza A viruses, and 4,203 (20.9%) were influenza B viruses. Of the 5,083 influenza A viruses that were subtyped, 5,070 (99.7%) were influenza A (H3N2), and 13 (0.3%) were influenza A (H1)¶. Since October 3, 2004, a total of 68.5% and 55.6% of viruses reported from the Mountain and Pacific regions, respectively, were influenza type A. In the remaining seven surveillance regions, the proportion of influenza A viruses ranged from 78.5% in the South Atlantic region to 89.3% in the East South Central region. During the weeks ending March 12--26, 2005, influenza B viruses accounted for increasing proportions of influenza viruses in all nine surveillance regions, with the highest proportion (72.3%) reported from the New England region. In the Mid-Atlantic, East North Central, and Pacific regions, more than 60.0% of recent influenza isolates also were influenza B. Using hemagglutination-inhibition tests with postinfection ferret serum, CDC has antigenically characterized 638 influenza viruses collected by U.S. laboratories since October 1, 2004. Of these, 419 (65.7%) were influenza A (H3N2) viruses, six (0.9%) were influenza A (H1) viruses, and 213 (33.4%) were influenza B viruses. Of the 419 influenza A (H3N2) isolates, 151 (36.0%) were similar antigenically to A/Wyoming/3/2003, the A/Fujian/411/2002-like (H3N2) strain recommended for the 2004--05 influenza vaccine, and 268 (64.0%) were antigenically similar to A/California/7/2004 (H3N2), a recently characterized drift variant of A/Fujian/411/2002-like (H3N2) viruses. The hemagglutinin proteins of the influenza A (H1) viruses were similar antigenically to hemagglutinin of the vaccine strain A/New Caledonia/20/99. Current influenza B viruses fall into one of two antigenically and genetically distinct lineages represented by B/Yamagata/16/88 and B/Victoria/2/87 viruses (2). A total of 139 (65.3%) of the influenza B viruses belonged to the B/Yamagata lineage and were similar antigenically to B/Shanghai/361/2002-like viruses, the influenza B strain recommended for the 2004--05 influenza vaccine. Twenty-four (11.3%) viruses had reduced titers to B/Shanghai/361/2002 using ferret antisera, and 50 (23.5%) influenza B viruses belonged to the B/Victoria lineage. Influenza Activity Levels Reported by State and Territorial EpidemiologistsFor the week ending March 26, 2005, a total of four states reported widespread influenza activity**; 15 states reported regional activity; 20 states, New York City, and the District of Columbia reported local activity; and 10 states and Puerto Rico reported sporadic activity (Figure 2). One state did not report. Widespread influenza activity was first reported during the week ending November 13, 2004, by one state (Delaware), and since then, a total of 42 states and New York City have reported widespread activity for at least 1 week. Patient Visits for Influenza-Like IllnessFor the week ending March 26, 2005, the weekly percentage of patient visits for influenza-like illness (ILI)†† reported by approximately 1,400 U.S. sentinel providers was 2.6%. During the weeks ending October 9, 2004--March 26, 2005, the percentage of patient visits for ILI ranged from 1.0% to 5.4% and has exceeded the national baseline of 2.5%§§ for 11 consecutive weeks from the week ending January 15, 2005, through the week ending March 26, 2005. These patient visits peaked at 5.4% during the week ending February 19. During the 2001--02, 2002--03, and 2003--04 influenza seasons, national weekly peak percentages of patient visits for ILI ranged from 3.2% in mid-February during the 2001--02 and 2002--03 seasons to 7.6% in mid-to-late December during the 2003--04 season (CDC, unpublished data, 2004). Pediatric Hospitalizations Associated with Laboratory-Confirmed Influenza InfectionCDC monitors laboratory-confirmed influenza-associated pediatric hospitalizations by using two population-based surveillance networks: the Emerging Infections Program (EIP) and the New Vaccine Surveillance Network (NVSN)¶¶. Surveillance methods and case definitions differ slightly between the two systems***. During October 1, 2004--March 19, 2005, the preliminary influenza-associated hospitalization rates for children aged 0--4 years were 5.2 and 1.9 per 10,000 in the NVSN and EIP sites, respectively. EIP also monitors hospitalizations in children aged 5--17 years; the preliminary influenza-associated hospitalization rate for this age group was 0.3 per 10,000. The overall hospitalization rate reported by EIP for children aged 0--17 years was 0.9 per 10,000. During 2000--2004, the end-of-season hospitalization rate for NVSN ranged from 3.7 (2002--03) to 12 (2003--04) per 10,000 children. The 2003--04 end-of-season hospitalization rate for EIP was 7.8 per 10,000 for children aged 0--4 years and 0.8 per 10,000 for children aged 5--17 years. Influenza-Associated Mortality SurveillanceDuring the week ending March 26, 2005, an estimated 8.6% of deaths in the United States reported through the 122 Cities Mortality Reporting System were attributed to pneumonia and influenza (P&I), which was above the epidemic threshold††† of 8.1% for that week. The percentage of P&I deaths exceeded the epidemic threshold (Figure 3) for 6 consecutive weeks (weeks ending February 19--March 26, 2005). In October 2004, pediatric deaths associated with laboratory-confirmed influenza infection were made a nationally notifiable condition. As of March 26, a total of 24 pediatric deaths from 12 states (California, Colorado, Georgia, Iowa, Maine, Massachusetts, Mississippi, New Jersey, New York, Ohio, Pennsylvania, and Vermont) had been reported to CDC; all deaths were reported during January--March. Composition of the 2005--06 Influenza VaccineThe Food and Drug Administration's Vaccines and Related Biological Products Advisory Committee has recommended that the 2005--06 trivalent influenza vaccine for the United States contain A/New Caledonia/20/99-like (H1N1), A/California/7/2004-like (H3N2), and B/Shanghai/361/2002-like viruses (3). This recommendation was based on antigenic analyses of recently isolated influenza viruses, epidemiologic data, and postvaccination serologic studies in humans. Because of the growth properties of A/New Caledonia/20/99 (H1N1) and B/Jangsu/10/2003 viruses, U.S. vaccine manufacturers will retain these antigenically equivalent strains for the inactivated vaccine. B/Jilin/20/2003 will be used for the live attenuated vaccine. At this time, the most likely candidate for the A/California/7/2004-like (H3N2) component will be A/New York/55/2004 (H3N2). Reported by: S Wang, MPH, L Brammer, MPH, A Postema, MPH, K Teates, MPH, E Murray, MSPH, K Fukuda, MD, A Klimov, PhD, T Wallis, MS, N Cox, PhD, WHO Collaborating Center for Surveillance, Epidemiology, and Control of Influenza, Div of Viral and Rickettsial Diseases; R Seither, MPH, M Iwane, PhD, Epidemiology and Surveillance Div; J Copeland, MS, National Immunization Program, CDC. Editorial Note:Influenza activity during the 2004--05 season has been moderate in the United States. Activity steadily increased during January, peaked in mid-February, and has declined nationwide. Numerous influenza outbreaks associated with both influenza A and influenza B viruses have been reported in long-term--care facilities and among school children. Influenza B viruses have made up an increasing proportion of influenza isolates as the season has progressed, which is not unusual. Although influenza activity for the 2004--05 season in the United States is declining, influenza should continue to be considered as a cause of outbreaks of respiratory disease because viruses are still circulating and use of antiviral drugs and other infection-control measures can substantially reduce morbidity and mortality in such situations. Recommendations on the use of these drugs and measures are available at http://www.cdc.gov/flu/protect/antiviral/index.htm and http://www.cdc.gov/flu/professionals/infectioncontrol. Based on pediatric hospitalization and mortality data collected since October 1, 2004, hospitalization rates and the number of influenza-associated pediatric deaths this season appear to be lower than the 2003--04 influenza season. However, as new data become available, cumulative rates reported for pediatric hospitalizations and the number of pediatric deaths might continue to increase. Because data collection is currently ongoing, any comparison of the data from this season with the previous is premature. Influenza surveillance reports for the United States are published weekly during October--May and are available at http://www.cdc.gov/flu/weekly/fluactivity.htm or through the CDC voice (888-232-3228) and fax (888-232-3299, document number 361100) information systems. Acknowledgments The findings in this report are based, in part, on data contributed by participating state and territorial health departments and state public health laboratories, WHO collaborating laboratories, National Respiratory and Enteric Virus Surveillance System collaborating laboratories, the U.S. Influenza Sentinel Provider Surveillance System, the New Vaccine Surveillance Network, the Emerging Infections Program, and the 122 Cities Mortality Reporting System. References
* As of March 26, 2005, reporting is incomplete. † The CDC Influenza Surveillance System comprises the following seven components: 1) World Health Organization and National Respiratory and Enteric Virus Surveillance System collaborating laboratories, 2) U.S. Influenza Sentinel Providers Surveillance Network, 3) 122 Cities Mortality Reporting System, 4) State and Territorial Epidemiologists' Reports, 5) Influenza-associated pediatric mortality, 6) Emerging Infections Program, and 7) New Vaccine Surveillance Network. § Surveillance regions are New England: Connecticut, Maine, Massachusetts, New Hampshire, Vermont, and Rhode Island; Mid-Atlantic: New Jersey, New York City, Pennsylvania, and Upstate New York; East North Central: Illinois, Indiana, Michigan, Ohio, and Wisconsin; West North Central: Iowa, Kansas, Minnesota, Missouri, Nebraska, North Dakota, and South Dakota; South Atlantic: Delaware, District of Columbia, Florida, Georgia, Maryland, North Carolina, South Carolina, Virginia, and West Virginia; East South Central: Alabama, Kentucky, Mississippi, and Tennessee; West South Central: Arkansas, Louisiana, Oklahoma, and Texas; Mountain: Arizona, Colorado, Idaho, Montana, Nevada, New Mexico, Utah, and Wyoming; and Pacific: Alaska, California, Hawaii, Oregon, and Washington. ¶ Includes both the A (H1N1) and A (H1N2) influenza virus sybtypes. ** Levels of activity are 1) no activity, 2) sporadic: small numbers of laboratory-confirmed influenza cases or a single influenza outbreak reported but no increase in cases of influenza-like illness (ILI), 3) local: outbreaks of influenza or increases in ILI cases and recent laboratory-confirmed influenza in a single region of a state, 4) regional: outbreaks of influenza or increases in ILI cases and recent laboratory-confirmed influenza in at least two but less than half the regions of a state, and 5) widespread: outbreaks of influenza or increases in ILI cases and recent laboratory-confirmed influenza in at least half the regions of a state. †† Temperature of >100.0ºF (>37.8ºC) and either cough or sore throat in the absence of a known cause. §§ The national baseline was calculated as the mean weighted percentage of visits for ILI during noninfluenza weeks, plus two standard deviations. Wide variability in regional data precludes calculating region-specific baselines; applying the national baseline to regional data is inappropriate. ¶¶ EIP Influenza Project conducts surveillance in 57 counties associated with 11 metropolitan areas: San Francisco (CA), Denver (CO), New Haven (CT), Atlanta (GA), Baltimore (MD), Minneapolis/St. Paul (MN), Albuquerque (NM), Albany (NY), Rochester (NY), Portland (OR), and Nashville (TN). NVSN conducts surveillance in Monroe County (NY), Hamilton County (OH), and Davidson County (TN). *** NVSN provides population-based estimates of laboratory-confirmed influenza hospitalization rates in children aged <5 years admitted to NVSN hospitals with fever or respiratory symptoms. Children are prospectively enrolled, and respiratory samples are collected and tested by viral culture and reverse transcriptase-polymerase chain reaction (PCR). The EIP conducts surveillance for laboratory-confirmed influenza-related hospitalizations in person aged <18 years. Hospital laboratory and admission databases and infection-control logs are reviewed to identify children with a positive influenza test result (i.e., culture, direct or indirect fluorescent antibody assays, PCR, or a rapid test) from testing conducted as a part of their routine care. ††† The expected seasonal baseline proportion of P&I deaths reported by the 122 Cities Mortality Reporting System is projected by using a robust cyclical regression procedure in which a periodic regression model is applied to the observed percentage of deaths from P&I during the preceding 5 years. The epidemic threshold is 1.645 standard deviations above the seasonal baseline.
Figure 1
Disclaimer All MMWR HTML versions of articles are electronic conversions from ASCII text into HTML. This conversion may have resulted in character translation or format errors in the HTML version. Users should not rely on this HTML document, but are referred to the electronic PDF version and/or the original MMWR paper copy for the official text, figures, and tables. An original paper copy of this issue can be obtained from the Superintendent of Documents, U.S. Government Printing Office (GPO), Washington, DC 20402-9371; telephone: (202) 512-1800. Contact GPO for current prices. **Questions or messages regarding errors in formatting should be addressed to mmwrq@cdc.gov.Page converted: 4/7/2005 |
|||||||||
This page last reviewed 4/7/2005
|