 |
|
|
|
|
|
|
| ||||||||||
|
|
|
|
|
|
|
||||
| ||||||||||
|
|
|
|
|
Persons using assistive technology might not be able to fully access information in this file. For assistance, please send e-mail to: mmwrq@cdc.gov. Type 508 Accommodation and the title of the report in the subject line of e-mail. Brief Report: Vaccination Coverage Among Callers to a State Influenza Hotline --- Connecticut, 2004--05 Influenza SeasonIn response to the influenza vaccine shortage in the United States (1), the Connecticut Department of Public Health (DPH) operated a telephone hotline during October 22, 2004--January 15, 2005. The purpose of the hotline was to address questions from the public regarding the availability of influenza vaccine, reduce the number of telephone inquiries to physicians and local health departments (LHDs), and advise callers regarding which groups were most at risk and in need of influenza vaccination. Caller information was collected and shared daily with LHDs, which were encouraged to follow up with callers as their resources allowed. This report summarizes results of a retrospective survey of callers to the DPH influenza vaccine hotline during November 2004. The results indicated that vaccination coverage varied by age group and that persons receiving follow-up calls from LHDs were more likely to receive vaccination. State health departments might consider a hotline as a method for educating the public regarding influenza vaccination and a follow-up system as a means to improve vaccination coverage, especially among those at greatest risk. During December 9--17, DPH conducted a survey of persons who had called the state influenza hotline during November 1--24 to determine the proportion of persons vaccinated, identify barriers to vaccination, and obtain information on the usefulness of the influenza hotline. During the study period, 8,545 callers contacted the hotline, constituting 63% of all callers during October 22, 2004--January 15, 2005 (Figure). From the 8,545 names on the hotline list, 400 were randomly selected and interviewed via telephone. Interviews were completed with 358 (89%). Of the 358 participants, 279 (78%) had called the hotline themselves; 79 had someone else call on their behalf. Overall, 284 (79%; 95% confidence interval [CI] = 75%--83%) of the participants had received vaccination at the time of the survey. A total of 343 (97%; CI = 95%--98%) reported receiving vaccination during the preceding 2003--04 influenza season; status of four participants was unknown. Vaccination coverage during 2004--05 varied by age; coverage was 59% in persons aged <65 years and 84% in persons aged >65 years (p<0.0001). Vaccination coverage also varied by the population of the municipality of residence; coverage was 75% in persons who lived in municipalities with populations of <50,000, 84% in persons from municipalities with populations of 50,000--99,999, and 88% in persons from municipalities with populations of >100,000 (p<0.05). Coverage did not vary significantly by sex, race, or ethnicity. Persons who reported receiving a follow-up call from their LHDs with information regarding local vaccine availability or scheduling of vaccination appointments were more likely to be vaccinated (94% versus 64%; p<0.001) than those who did not receive a follow-up call. Among those who received vaccine, 29% (CI = 24%--34%) were vaccinated by a private physician, hospital, or other private medical clinic; 56% (CI = 50%--62%) were vaccinated at a Visiting Nurses Association site, an LHD, or another public health clinic. Among the 74 persons not vaccinated, the most common reasons for not receiving vaccine were as follows: 1) no vaccine available in the community (61%; CI = 49%--72%), 2) waiting to be contacted by an LHD (20%; CI = 12%--31%), 3) not in a group recommended for vaccination (12%; CI = 6%--22%), and 4) vaccination appointment scheduled for a future date (11%; CI = 5%--20%). Among the 279 survey participants who called the hotline themselves, 252 of the 273 who responded to the question (92%; CI = 88%--95%) said they were satisfied with their call; no variation by vaccination status was observed. A total of 229 out of 268 (85%; CI = 81%--89%) said their questions were answered, 220 out of 271 (81%; CI = 75%--86%) said the influenza priority groups were explained, and 164 out of 271 (61%; CI = 60%--72%) said influenza prevention measures other than vaccination were discussed. Vaccination coverage among the callers surveyed was greater than that reported previously for the general public in the United States during September--November 2004 (2). This disparity was likely an indication of greater motivation to receive influenza vaccine among callers to the Connecticut hotline, 97% of whom reported receiving vaccination during the 2003--04 season. Nonetheless, state and local health departments might consider reviewing the Connecticut hotline results as they plan how best to educate residents regarding influenza vaccination and how to maximize vaccination coverage among groups at greatest risk for influenza. Reported by: ML Cartter, MD, R Melchreit, MD, P Mshar, MPH, K Marshall, MPH, T Rabatsky-Ehr, MPH, D Rosen, JL Hadler, MD, Connecticut Dept of Public Health. Acknowledgment The findings in this report are based, in part, on data collected by Connecticut Dept of Public Health workers who staffed the influenza vaccination hotline and who contributed to the design and implementation of the follow-up survey. References
Figure 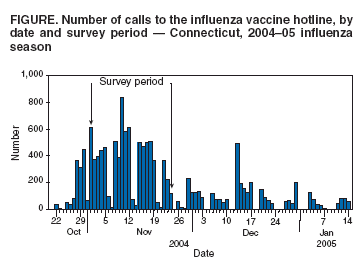 Return to top.
Disclaimer All MMWR HTML versions of articles are electronic conversions from ASCII text into HTML. This conversion may have resulted in character translation or format errors in the HTML version. Users should not rely on this HTML document, but are referred to the electronic PDF version and/or the original MMWR paper copy for the official text, figures, and tables. An original paper copy of this issue can be obtained from the Superintendent of Documents, U.S. Government Printing Office (GPO), Washington, DC 20402-9371; telephone: (202) 512-1800. Contact GPO for current prices. **Questions or messages regarding errors in formatting should be addressed to mmwrq@cdc.gov.Page converted: 3/3/2005 |
|||||||||
This page last reviewed 3/3/2005
|