 |
|
|
|
|
|
|
| ||||||||||
|
|
|
|
|
|
|
||||
| ||||||||||
|
|
|
|
|
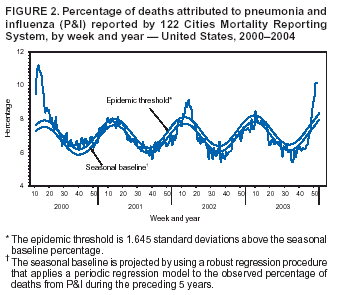
Persons using assistive technology might not be able to fully access information in this file. For assistance, please send e-mail to: mmwrq@cdc.gov. Type 508 Accommodation and the title of the report in the subject line of e-mail. Update: Influenza Activity --- United States, January 11--17, 2004The number of states reporting widespread influenza activity* continued to decrease during the reporting week of January 11--17, 2004†. Health departments in five states reported widespread influenza activity. A total of 31 states and New York City reported regional activity, eight states reported local activity, and sporadic activity was reported by six states, the District of Columbia, Guam, and Puerto Rico (Figure 1). The percentage of outpatient visits for influenza-like illness (ILI)§ continued to decrease in all surveillance regions during the week ending January 17. For the first time since the reporting week ending November 8, 2003, the national percentage for ILI (2.0%) declined below the national baseline¶ of 2.5%. The percentage of specimens testing positive for influenza also decreased, but the percentage of deaths attributed to pneumonia and influenza (P&I) was unchanged. Laboratory SurveillanceDuring the week ending January 17, World Health Organization (WHO) laboratories reported testing 1,544 specimens for influenza viruses, of which 123 (8.0%) were positive. Of these, 26 were influenza A (H3N2) viruses, 95 were influenza A viruses that were not subtyped, and two were influenza B viruses. Since September 28, WHO and NREVSS laboratories have tested 76,311 specimens for influenza viruses, of which 19,968 (26.2%) were positive. Of these, 19,853 (99.4%) were influenza A viruses, and 115 (0.6%) were influenza B viruses. Of the 19,853 influenza A viruses, 4,652 (23.4%) have been subtyped; 4,651 (99.9%) were influenza A (H3N2) viruses, and one (0.1%) was an influenza A (H1) virus. Antigenic CharacterizationOf the 573 influenza viruses collected by U.S. laboratories since October 1, 2003, and characterized antigenically by CDC, 565 were influenza A (H3N2) viruses, two were influenza A (H1) viruses, and six were influenza B viruses. The hemagglutinin proteins of the influenza A (H1) viruses were similar antigenically to the hemagglutinin of the vaccine strain A/New Caledonia/20/99. Of the 565 influenza A (H3N2) isolates that have been characterized, 106 (18.8%) were similar antigenically to the vaccine strain A/Panama/2007/99 (H3N2), and 459 (81.2%) were similar to a drift variant, A/Fujian/411/2002 (H3N2)**. Five influenza B viruses characterized were similar antigenically to B/Sichuan/379/99 and one was similar antigenically to B/Hong Kong/330/2001. P&I Mortality SurveillanceDuring the week ending January 17, P&I accounted for 10.3% of all deaths reported through the 122 Cities Mortality Reporting System. This percentage is again above the epidemic threshold†† of 8.1% (Figure 2). ILI SurveillanceThe percentage of patient visits§§ to approximately 1,000 U.S. sentinel providers nationwide for ILI decreased to 2.0% for the week ending January 17, which is below the national baseline of 2.5% (Figure 3). The percentage of patient visits for ILI continued to decrease in all nine surveillance regions¶¶, ranging from 2.5% in the Pacific region to 1.1% in the New England and West North Central regions. Activity Reported by State and Territorial EpidemiologistsDuring the week ending January 17, influenza activity was reported as widespread in five states (Delaware, Minnesota, New York, Pennsylvania, and Vermont). Regional activity was reported in 31 states (Colorado, Connecticut, Florida, Georgia, Hawaii, Idaho, Indiana, Iowa, Kentucky, Louisiana, Maine, Massachusetts, Michigan, Mississippi, Missouri, Montana, New Hampshire, New Jersey, North Carolina, North Dakota, Ohio, Oregon, Rhode Island, South Carolina, Tennessee, Texas, Utah, Virginia, West Virginia, Wisconsin, and Wyoming) and New York City. Local activity was reported in eight states (Alaska, Arizona, California, Illinois, Kansas, Maryland, Nebraska, and Washington). Sporadic activity was reported in six states (Alabama, Arkansas, Nevada, New Mexico, Oklahoma, and South Dakota), the District of Columbia, Guam, and Puerto Rico. Weekly updates on influenza activity will be published in MMWR during the influenza season. Additional information about influenza activity is available from CDC at http://www.cdc.gov/flu. Influenza-Associated Deaths in Children Aged <18 YearsAs of January 20, 2004, CDC had received reports of 111 influenza-associated deaths in U.S. residents aged <18 years. This update is based on preliminary data reported from 33 states (Table). All patients had evidence of influenza virus infection detected by rapid-antigen testing or other laboratory tests. Among reported deaths, 56 (50.5%) were male. The median age was 4 years (range: 1 month--17 years). Of the 64 children aged <5 years, 38 were aged 6 months--23 months. Twenty-one children had high-risk medical conditions that put them at increased risk for complications from influenza. Of the children whose influenza vaccination status was reported, three were vaccinated according to recommendations (1), and 49 were not vaccinated. Reference* Levels of activity are 1) no activity, 2) sporadic---small numbers of laboratory-confirmed influenza cases or a single influenza outbreak reported but no increase in cases of influenza-like illness (ILI), 3) local---outbreaks of influenza or increases in ILI cases and recent laboratory-confirmed influenza in a single region of a state, 4) regional---outbreaks of influenza or increases in ILI cases and recent laboratory-confirmed influenza in at least two but less than half the regions of a state, and 5) widespread---outbreaks of influenza or increases in ILI cases and recent laboratory-confirmed influenza in at least half the regions of a state. † Provisional data reported as of January 14. § Temperature of >100.0º F (>37.8º C) and cough and/or sore throat in the absence of a known cause other than influenza. ¶ Calculated as the mean percentage of visits for ILI during noninfluenza weeks, plus two standard deviations. Wide variability in regional data precludes calculating region-specific baselines and makes it inappropriate to apply the national baseline to regional data ** Although vaccine effectiveness against A/Fujian/411/2002-like viruses might be less than that against A/Panama/2007/99-like viruses, the current U.S. vaccine probably will offer some cross-protective immunity against the A/Fujian/411/2002-like viruses and reduce the severity of disease. †† The expected baseline proportion of P&I deaths reported by the 122 Cities Mortality Reporting System is projected by using a robust regression procedure that applies a periodic regression model to the observed percentage of deaths from P&I during the preceding 5 years; the epidemic threshold is 1.645 standard deviations above the seasonal baseline percentage. §§ National and regional percentage of patient visits for ILI are weighted on the basis of state population. ¶¶ New England=Connecticut, Maine, Massachusetts, New Hampshire, Rhode Island, and Vermont; Mid-Atlantic=New Jersey, New York City, Pennsylvania, and Upstate New York; East North Central=Illinois, Indiana, Michigan, Ohio, and Wisconsin; West North Central=Iowa, Kansas, Minnesota, Missouri, Nebraska, North Dakota, and South Dakota; South Atlantic=Delaware, District of Columbia, Florida, Georgia, Maryland, North Carolina, South Carolina, Virginia, and West Virginia; East South Central=Alabama, Kentucky, Mississippi, and Tennessee; West South Central=Arkansas, Louisiana, Oklahoma, and Texas; Mountain=Arizona, Colorado, Idaho, Montana, Nevada, New Mexico, Utah, and Wyoming; and Pacific=Alaska, California, Hawaii, Oregon, and Washington.
Disclaimer All MMWR HTML versions of articles are electronic conversions from ASCII text into HTML. This conversion may have resulted in character translation or format errors in the HTML version. Users should not rely on this HTML document, but are referred to the electronic PDF version and/or the original MMWR paper copy for the official text, figures, and tables. An original paper copy of this issue can be obtained from the Superintendent of Documents, U.S. Government Printing Office (GPO), Washington, DC 20402-9371; telephone: (202) 512-1800. Contact GPO for current prices. **Questions or messages regarding errors in formatting should be addressed to mmwrq@cdc.gov.Page converted: 1/22/2004 |
|||||||||
This page last reviewed 1/22/2004
|