Persons using assistive technology might not be able to fully access information in this file. For assistance, please send e-mail to: mmwrq@cdc.gov. Type 508 Accommodation and the title of the report in the subject line of e-mail.
Unemployment — United States, 2006 and 2010
Corresponding author: Heba M. Athar, Division of Epidemiology, Analysis and Library Services, Center for Surveillance, Epidemiology, and Laboratory Services, CDC. Telephone: 404-498-2216; E-mail: viv8@cdc.gov.
Introduction
The association between unemployment and poor physical and mental health is well established (1–7). Unemployed persons tend to have higher annual illness rates, lack health insurance and access to health care, and have an increased risk for death (1,2,8,9). Several studies indicate that employment status influences a person's health; however, poor health also affects a person's ability to obtain and retain employment (10). Poor health predisposes persons to a more uncertain position in the labor market and increases the risk for unemployment (5,6).
According to the Bureau of Labor Statistics (BLS), the unemployment prevalence in the United States increased from 4.7% in 2006 to 9.4% in 2010, yielding an estimated 14.5 million unemployed persons (11). Both the prevalence of unemployment and the health status of populations vary widely among and within communities by age, sex, and race/ethnicity. In 2010, the unemployment prevalence both for males and females was twice as high in the black and Hispanic populations as in the white population (11). The disparities in unemployment prevalence extend across the country and have increased from January 2008 to December 2010 (12). Because unemployment has historically been substantially higher in black and Hispanic populations during past decades and because unemployment has increased substantially from the start of the recession in December 2007 (13,14), associations between unemployment and health and between unemployment and minority status need to be further studied.
This report is part of the second CDC Health Disparities and Inequalities Report (CHDIR). The 2011 CHDIR (15) was the first CDC report to assess disparities across a wide range of diseases, behavioral risk factors, environmental exposures, social determinants, and health-care access. The topic presented in this report is based on criteria that are described in the 2013 CHDIR Introduction (16). This report is the first assessment of unemployment and health status in a CHDIR. The purposes of this unemployment and health analysis are to discuss and raise awareness of differences in the characteristics of persons who are unemployed and differences in health status by employment status and to prompt actions to reduce these disparities.
Methods
To assess changes in unemployment rates by several population characteristics, CDC analyzed 2006 and 2010 data from the Behavioral Risk Factor Surveillance System (BRFSS). The association between unemployment and self-reported health status, physical health, and mental health in 2010 also was examined. The 2010 state-specific unemployment prevalences were calculated and shown on a U.S. map using statistical software; prevalences were shown for men and women, non-Hispanic blacks, and non-Hispanic whites (17). All analyses were limited to persons aged 18–64 years.
BRFSS is a state population-based, telephone survey of noninstitutionalized U.S. adults aged ≥18 years collected in all states and selected territories. The BRFSS median response rate* for 2006 was 51.4% and for 2010 was 54.6%; the median cooperation rate† for 2006 was 74.5% and for 2010 was 76.9% (18,19). The same question from the BRFSS survey was used to assess employment status and unemployment status by asking participants whether they are currently 1) employed for wages; 2) self-employed; 3) out of work for >1 year; 4) out of work for <1 year; 5) a homemaker; 6) a student; 7) retired; or 8) unable to work. Persons who did not respond to this question were excluded from the analysis. The employment question responses were recategorized into the following groups: 1) employed (including employed for wages and self-employed), 2) unemployed (out of work for <1 year and out of work for >1 year), and 3) other (homemaker, student, retired, or unable to work).
Data were analyzed to assess disparities in unemployment prevalence for 2006 and 2010. To examine the association between unemployment and health status, data for the following three health outcomes were collected from the 2010 BRFSS data set: 1) health status, 2) number of physically unhealthy days, and 3) number of mentally unhealthy days. The related BRFSS questions were as follows: 1) "Would you say that in general your health is excellent, very good, good, fair, or poor?" 2) "Thinking about your physical health, which includes physical illness and injury, for how many days during the past 30 days was your physical health not good?" and 3) "Thinking about your mental health, which includes stress, depression, and problems with emotions, for how many days during the past 30 days was your mental health not good?" In this analysis, responses to the BRFSS health status question were recategorized into the following groups: excellent/very good, good, and fair/poor. Participants with the responses "do not know/not sure" or "refused to respond" to both the physical health and mental health questions were categorized as having missing values and were excluded from the analysis. Physically unhealthy days and mentally unhealthy days were categorized separately as 0 days, 1–15 days, and 16–30 days.
Disparities were measured as the deviations from a referent group, which was the group that had the most favorable estimate for the variables used to assess disparities during the time reported. Absolute difference was calculated by subtracting the unemployment prevalence for the group of interest from the referent group. The relative difference, a percentage, was calculated by dividing the absolute difference by the value in the referent category and multiplying by 100. All state and national estimates were weighted by BRFSS sample weights using statistical software to account for the complex design. For unemployment prevalence and health status prevalence, 95% confidence intervals (CIs) were calculated for the point estimates. CIs were used as measure of variability, and nonoverlapping CIs were considered statistically different. Using CIs in this way is a conservative evaluation of significance differences; infrequently, this might lead to a conclusion that estimates are similar when the point estimates do differ. All reported differences in this report are significant based on the CI comparison.
Results
Unemployment prevalence increased from 2006 to 2010 for all adults aged 18–64 years, particularly among adults aged 25–44 years (Table 1). In general, unemployment prevalence increased among both males and females (referent group); however, males reported higher unemployment prevalence than females in both 2006 and 2010, and this difference gradually increased to 2010. The highest unemployment prevalence among racial/ethnic groups was among non-Hispanic blacks (10.4% in 2006 and 16.5% in 2010), which was almost twofold that of non-Hispanic whites (4.7% in 2006 and 8.3% in 2010). The unemployment prevalence for American Indians/Alaska Natives increased substantially from 8.8% in 2006 to 15.8% in 2010. In both years, the unemployment prevalence among persons with no health insurance was approximately 4 times higher than that for persons with health insurance. The unemployment prevalence decreased as levels of education and income increased in both 2006 and 2010. The greatest change in unemployment prevalence for education and income from 2006 to 2010 occurred among those who did not graduate from high school and in households with an annual income of <$25,000 per year. In 2006 and 2010, persons with a disability had an unemployment prevalence (60%) that was higher than that of persons without a disability (40%).
In 2010, the highest prevalence of unemployment among men was in the Northeast and West (Figure 1) and among women was in the South and West (Figure 2). The Midwest region had the lowest unemployment prevalence for both sexes. The West region (e.g., Nevada, California, and Oregon) had the highest prevalence of unemployment both among non-Hispanic blacks and non-Hispanic whites (Figures 3, and 4), and the Midwest region (e.g., North Dakota and South Dakota) had the lowest prevalence of unemployment for both these groups.
In 2010, unemployed persons were less likely than employed persons to report their health as excellent or very good (Table 2). A higher percentage of employed persons reported that they were in excellent or very good health (62.7%) than did persons who were unemployed for <1 year (49.2%) or unemployed for >1 year (39.7%). Persons who were employed were more likely to report no physically unhealthy days (70.3%) and no mentally unhealthy days (67.3%) in the past 30 days than were persons who were unemployed for <1 year (no physically unhealthy days: 63.1%; no mentally unhealthy days: 54.2%). Persons who were unemployed for >1 year were even less likely to report having had no physically or mentally unhealthy days in the past 30 days.
Discussion
BRFSS defines unemployment differently from BLS, the agency that monitors unemployment in the United States. BLS defines an unemployed person as someone who does not have a job, has been actively looking for work in the past 4 weeks, and is currently available for work (12,20). This might contribute to the slight difference in unemployment estimates between BLS and BRFSS. BRFSS was selected for this analysis because the data set includes variables of interest that enable health status assessment and report on the disparities by employment.
The analysis in this report found an association between unemployment and overall health status and between unemployment and number of physically and mentally unhealthy days and also found that disparities by employment increased from 2006 to 2010 for certain population groups, including persons with less than a high school education, household income <$25,000, and no health insurance coverage, as well as for American Indians/Alaska Natives. The disparities in unemployment among demographic groups reported in this study are consistent with findings from several other national surveys (11,14,21,22).
Limitations
The findings in this report are subject to at least six limitations. First, the 2006 and 2010 surveys excluded certain populations, such as persons without landlines, persons in institutions, and homeless persons; therefore, the results of this study might not be generalizable to the entire U.S. adult population. Second, the low BRFSS median state response rates for 2006 and 2010 (18,19) increase the possibility of nonresponse bias in the results. Third, BRFSS health status data are self-reported and are therefore subject to recall bias and measurement error (23,24). Fourth, BRFSS is cross-sectional, and the timeframe used to define unemployment is limited to two categories (<1 year and >1 year); therefore, the directionality of the relations between short-term unemployment, longer-term unemployment, and health outcomes cannot be assessed. Fifth, the categorization of the BRFSS health status, physical health, and mental health responses is subjective. Finally, this analysis could neither address the reason that unemployment and health status are related nor determine whether these pathways altered substantially between 2006 and 2010.
Conclusion
This study supports existing findings on unemployment and health status (1–7). The relation between unemployment and health status is multifactorial and complex. Studies of health and unemployment disparities have identified associated intermediary factors, including health insurance coverage and access to health care (14,25–27). Similarly, the National Prevention Strategy notes that health disparities are often linked to social, economic, and environmental disadvantages (28). The federal government is implementing the Affordable Care Act and, beginning in 2014, the law will expand access to health insurance coverage for millions of previously uninsured persons in the United States (29).
References
- Rosenthal L, Caroll-Scott A, Earnshaw VA, et al. The importance of full-time work for urban adults' mental and physical health. Soc Sci Med 2012;75:1692–6.
- Dooley D, Fielding J, Levi L. Health and unemployment. Annu Rev Public Health 1996;17:449–65.
- Leach LS, Butterworth P, Strazdins L, et al. The limitations of employment as a tool for social inclusion. BMC Public Health 2010;10:621.
- Harris E, Harris MF. Reducing the impact of unemployment on health: revisiting the agenda for primary health care. Med J Aust 2009;191:119–22.
- Jefferis BJ, Nazareth I, Marstone L, et al. Associations between unemployment and major depressive disorder: evidence form an international, prospective study (the predict cohort). Soc Sci Med 2011;73:1627–34.
- Tefft N. Insights on unemployment, unemployment insurance, and mental health. J Health Econ 2011;30:258–64.
- Kroll LE, Lampert T. Unemployment, social support and health problems—results of the GEDA study in Germany, 2009. Dtsch Arztebl Int 2011;108:47–52.
- Freyer-Adam J, Gaertner B, Tobschall S, et al. Health risk factors and self-rated health among job-seekers. BMC Public Health 2011;11:659.
- Idler EL, Benyamini Y. Self-rated health and mortality; A review of twenty seven studies community studies. J Health Soc Behav 1997;38:21–37.
- Shavers VL. Measurement of socioeconomic status in health disparities research. J Natl Med Assoc 2007;99:1013–23.
- US Department of Labor, Bureau of Labor Statistics. Unemployment rates by race and ethnicity, 2010. Washington, DC: Bureau of Labor Statistics, US Department of Labor; 2011. Available at http://www.bls.gov/opub/ted/2011/ted_20111005.htm.
- US Department of Labor, Bureau of Labor Statistics. Unemployment in December 2010. Washington, DC: Bureau of Labor Statistics, US Department of Labor; 2011. Available at http://www.bls.gov/opub/ted/2011/ted_20110111.htm.
- Austin A. Unequal unemployment—racial disparities by state will worsen in 2010. Economic Policy Institute 2009;257.
- Austin A. Uneven pain: unemployment by metropolitan area and race. Economic Policy Institute 2010;278.
- CDC. CDC health disparities and inequalities report—United States, 2011. MMWR 2011;60(Suppl; January 14, 2011).
- CDC. Introduction. In: CDC health disparities and inequalities report—United States, 2013. MMWR 2013;62(No. Suppl 3).
- ArcGIS software version 10.1. ESRI. Available at http://www.esri.com.
- 2006 Behavioral Risk Factor Surveillance System summary data quality report, 2007. Division of Behavioral Surveillance, Public Health Surveillance and Informatics Program. Available at ftp://ftp.cdc.gov/pub/Data/Brfss/2006SummaryDataQualityReport.pdf.
- Behavioral Risk Factor Surveillance System 2010 Survey Data and Documentation Division of Behavioral Surveillance, Public Health Surveillance and Informatics Program. Available at http://www.cdc.gov/brfss/annual_data/annual_2010.htm.
- US Department of Labor, Bureau of Labor Statistics Labor Force. Statistics from Current Population Survey. Washington, DC: Bureau of Labor Statistics, US Department of Labor; 2012. Available at http://www.bls.gov/cps.
- Deaton A. The financial crisis and the well-being of Americans. Oxf Econ Pap 2012;64:1–26.
- Driscoll AK, Bernsetein AB. Health and access to care among employed and unemployed adults: U.S. NCHS Data Brief 2009–2010;2012:83. Available at http://www.cdc.gov/nchs/data/databriefs/db83.htm.
- CDC. Behavioral surveys. Atlanta, GA: CDC; 2007. Available at http://www.cdc.gov/hiv/topics/surveillance/resources/guidelines/epi-guideline/la_supp/appendix-a_behavioral.htm.
- US Department of Health and Human Services, Agency for Healthcare Research and Quality. Data. Understanding the foundation of quality improvement. Rockville, MD; US Department of Health and Human Services, Agency for Healthcare Research and Quality; 2008. Available at http://www.ahrq.gov/qual/diabqual/diabqguidemod2.htm.
- Jin RL, Shah PC, Svoboda TJ. The impact of unemployment on health: a review of the evidence. Can Med Assoc J 1995;153:529–40.
- Bambra C, Eikemo TA. Welfare state regimes, unemployment, and health: a comparative study of the relationship between unemployment and self-reported health in 23 European countries. J Epidemiol Community Health 2009;63:92–8.
- Harris JR, Huang Y, Hannon PA, et al. Low-socioeconomic status workers: their health risks and how to reach them. J Occup Environ Med 2011;53:132–8.
- US Department of Health and Human Services, National Prevention Council. National prevention strategy, Washington, DC: US Department of Health and Human Services; 2011. Available at http://www.healthcare.gov/prevention/nphpphc/strategy/report.pdf.
- HealthCare.gov. What is the health insurance marketplace? Baltimore, MD: Healthcare.gov. Available at https://www.healthcare.gov/what-is-the-health-insurance-marketplace.
* The perentage who completed interviews among all eligible persons, including those who were not contacted successfully.
† The perentage who completed interviews among all eligible persons who were contacted.
FIGURE 1. Unemployment prevalence among men aged 18–64 years, by state — Behavioral Risk Factor Surveillance System, United States, 2010
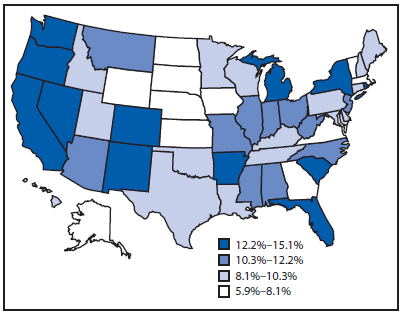
Alternate Text: The figure is a United States map that presents the prevalence of unemployment by state among men aged 18-64 years.
FIGURE 2. Unemployment prevalence among women aged 18–64 years, by state — Behavioral Risk Factor Surveillance System, United States, 2010
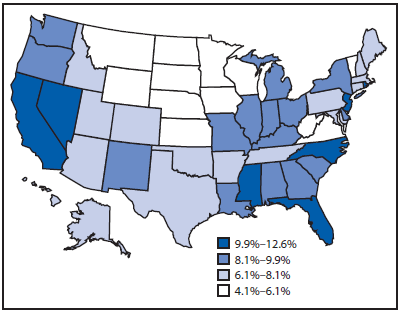
Alternate Text: The figure is a United States map that presents the prevalence of unemployment by state among women aged 18-64 years.
FIGURE 3. Unemployment prevalence among non-Hispanic white adults aged 18–64 years, by state — Behavioral Risk Factor Surveillance System, United States, 2010
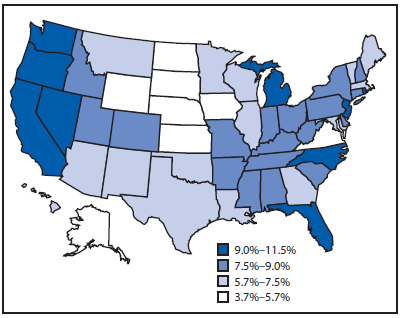
Alternate Text: The figure is a United States map that presents the prevalence of unemployment by state among non-Hispanic whites aged 18-64 years.
FIGURE 4. Unemployment prevalence among non-Hispanic black adults aged 18–64 years, by state — Behavioral Risk Factor Surveillance System, United States, 2010
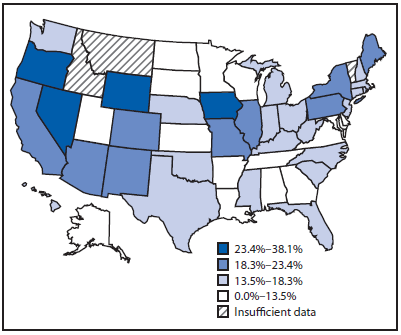
Alternate Text: The figure is a United States map that presents the prevalence of unemployment by state among non-Hispanic blacks aged 18-64 years.
Use of trade names and commercial sources is for identification only and does not imply endorsement by the U.S. Department of
Health and Human Services.
References to non-CDC sites on the Internet are
provided as a service to MMWR readers and do not constitute or imply
endorsement of these organizations or their programs by CDC or the U.S.
Department of Health and Human Services. CDC is not responsible for the content
of pages found at these sites. URL addresses listed in MMWR were current as of
the date of publication.
All MMWR HTML versions of articles are electronic conversions from typeset documents.
This conversion might result in character translation or format errors in the HTML version.
Users are referred to the electronic PDF version (http://www.cdc.gov/mmwr)
and/or the original MMWR paper copy for printable versions of official text, figures, and tables.
An original paper copy of this issue can be obtained from the Superintendent of Documents, U.S.
Government Printing Office (GPO), Washington, DC 20402-9371;
telephone: (202) 512-1800. Contact GPO for current prices.
**Questions or messages regarding errors in formatting should be addressed to
mmwrq@cdc.gov.
