|
|
|
|
|
|
|
| ||||||||||
|
|
|
|
|
|
|
||||
| ||||||||||
|
|
|
|
|
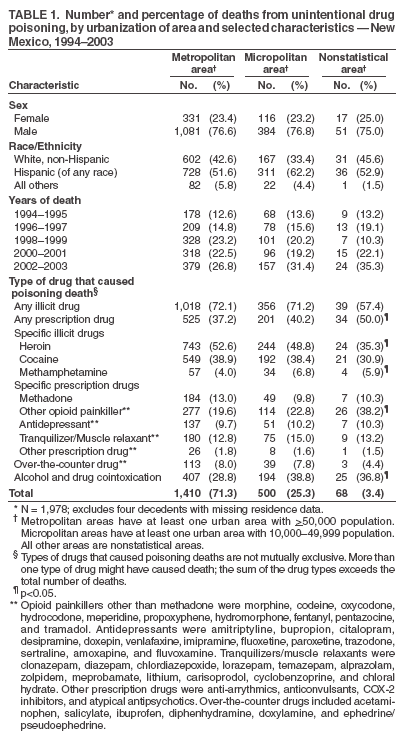
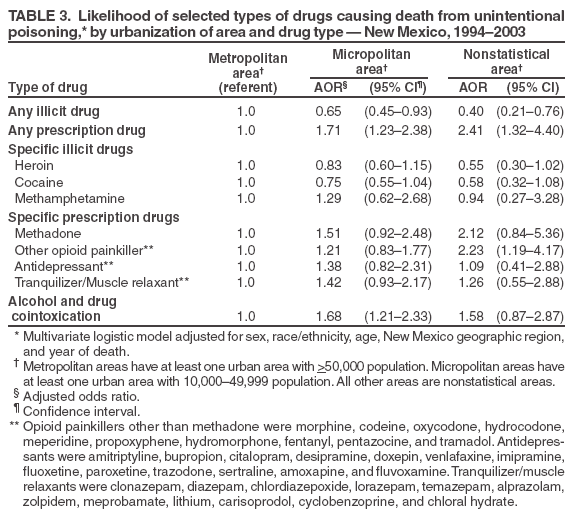
Persons using assistive technology might not be able to fully access information in this file. For assistance, please send e-mail to: mmwrq@cdc.gov. Type 508 Accommodation and the title of the report in the subject line of e-mail. Unintentional Deaths from Drug Poisoning by Urbanization of Area ---New Mexico, 1994--2003New Mexico experienced an increase in poisoning deaths during the 1990s (1) and in 2002 was the state with the highest death rate (14.1 per 100,000 population) from unintentional poisoning, more than twice the national rate (6.1) (2). The majority of these unintentional poisoning deaths were caused by ingestion of drugs, including illicit, prescription, and over-the-counter drugs. New Mexico is geographically diverse, with communities ranging from urban centers to sparsely populated counties. To examine the relationship between the types of drugs causing poisoning deaths and the levels of urbanization where the decedents resided, the New Mexico Department of Health analyzed data provided by the New Mexico Office of the Medical Investigator (OMI) for 1994--2003. All counties in New Mexico were classified as metropolitan or micropolitan statistical areas, or as nonstatistical areas, by using 2001--2002 population estimates in accordance with 2003 Office of Management and Budget (OMB) classifications* (3,4). This report summarizes the results of that analysis, which indicated that deaths from illicit-drug poisoning were twice as likely to occur in metropolitan areas as nonmetropolitan areas (i.e., micropolitan and nonstatistical areas combined). However, deaths from prescription-drug poisoning were most likely to occur in micropolitan and nonstatistical areas. Investigation of drug-poisoning deaths by level of urbanization can be useful to public health programs to prevent unintentional drug-poisoning deaths. OMI is authorized to investigate all deaths in New Mexico that are sudden, unexplained, suspicious, violent, or unattended, and also is contracted to investigate the majority of those types of deaths occurring in federal or tribal jurisdictions. Deaths were determined to have been caused by drugs or poisons on the basis of full autopsy, circumstances of death, investigation of death scene and medical background, and toxicologic evaluation indicating lethal blood concentration of one or more drugs, as evaluated by OMI board-certified forensic pathologists. An unintentional drug-poisoning death was a death ruled by OMI as accidental and caused by a single drug, a combination of drugs, or a combination of drugs and alcohol. Decedent characteristics (e.g., sex, race/ethnicity, and drugs causing death) were analyzed, and age-adjusted drug-poisoning death rates per 100,000 population by urbanization of area were calculated for 1994--2003. The population denominator for rates was the average population estimate from 1994--2003, calculated from 2000 U.S. standard census data for the year 2000 and from intercensal estimates for the other years (5). For all unintentional drug-poisoning deaths, bivariate and multivariate associations were assessed for urbanization level and selected covariates. Four metropolitan and 14 micropolitan statistical areas were identified; 12 sparsely populated counties that did not meet the OMB definition for metropolitan or micropolitan statistical areas were classified as nonstatistical areas.† Drugs causing death were categorized as illicit drugs (i.e., heroin, cocaine, or methamphetamine), over-the-counter drugs, or prescription drugs (i.e., methadone, other opioid painkiller, tranquilizer/muscle relaxant, antidepressant, barbiturate, or other prescription drug), according to American Hospital Formulary Service Pharmacologic-Therapeutic classifications (6). During 1994--2003, a total of 1,982 drug-poisoning deaths were identified in New Mexico; data on four deaths did not include county of decedent residence. Statewide, 71.3% of decedents resided in metropolitan areas, 25.3% in micropolitan areas, and 3.4% in nonstatistical areas (Table 1). Compared with decedents from micropolitan and nonstatistical areas, a significantly larger proportion from metropolitan areas died from heroin overdose (52.6% versus 48.8% and 35.3%, respectively). However, a larger proportion from nonstatistical areas than from metropolitan and micropolitan areas died from any prescription drug (50.0% versus 37.2% and 40.2%) or from opioid painkillers other than methadone (38.2% versus 19.6% and 22.8%). Illicit drug poisonings had the highest death rate (8.1 per 100,000 population), with a higher poisoning death rate from heroin than from cocaine or methamphetamine (5.8 versus 4.4 and 0.6) (Table 2). The death rate from any prescription drug was 4.4, with the highest rate among prescription drugs from opioid painkillers other than methadone (2.4). Metropolitan areas had the highest rates for all drug-poisoning deaths (12.6 versus 9.5 for micropolitan areas and 7.4 for nonstatistical areas), any illicit drug (9.0 versus 6.8 for micropolitan areas and 4.4 for nonstatistical areas), heroin (6.6 versus 4.7 for micropolitan areas and 2.6 for nonstatistical areas), and cocaine (4.8 versus 3.7 for micropolitan areas and 2.4 for nonstatistical areas). Metropolitan areas also had the highest death rates from methadone (1.6) and over-the-counter drugs (1.0). Nonstatistical areas had the highest death rate from opioid painkillers other than methadone (2.8); micropolitan areas had the highest death rate from alcohol and drug cointoxication (3.7). Multivariate models were used to assess the correlation between the three classifications of areas and types of drugs causing deaths, adjusting for sex, race/ethnicity, age, year of death, and geographic region (e.g., the heroin-poisoning death rate was highest in northern New Mexico) (Table 3). Compared with decedents residing in metropolitan areas, death from any illicit drug was less likely among decedents in nonmetropolitan areas (adjusted odds ratio [AOR] = 0.65, 95% confidence interval [CI] = 0.45--0.93 for micropolitan areas; AOR = 0.40, CI = 0.21--0.76 for nonstatistical areas); conversely, death from any prescription drug poisoning was more likely in micropolitan (AOR = 1.71, CI = 1.23--2.38) and nonstatistical areas (AOR = 2.41, CI = 1.32--4.40). Poisoning death from a prescription opioid painkiller other than methadone was twice as likely among decedents residing in nonstatistical areas (AOR = 2.23, CI = 1.19--4.17) compared with decedents in metropolitan areas. Alcohol and drug cointoxication was more likely among decedents in micropolitan areas than decedents in metropolitan areas (AOR = 1.68, CI = 1.32--2.33). Reported by: N Shah, MS, MG Landen, MD, New Mexico Dept of Health. Editorial Note:The findings in this report indicate that the poisoning death rate from opioid painkillers other than methadone was highest in nonstatistical areas of New Mexico and accounted for 38% of all deaths by drug poisoning in those areas. Adjusting for confounding effects of decedent and state regional characteristics by using multivariate logistic regression modeling revealed that deaths from illicit drug poisoning were most likely to occur in metropolitan areas, and deaths from prescription drugs were most common in micropolitan and nonstatistical areas. The nonmetropolitan area results of the New Mexico analysis are similar to results in previous reports from other areas. In Utah, a greater increase was observed from 1991--1998 to 1999--2003 in drug-poisoning death rates in rural counties than in urban counties (7). The same association was observed in North Carolina during 1997--2001 (8). The highest death rate and likelihood (OR = 3.4) from heroin overdose was observed in urban counties of North Carolina, and the highest death rates and likelihood from oxycodone overdose (OR = 2.6) was in rural counties. In New Mexico, poisoning death from prescription opioid painkillers (e.g., oxycodone) was 2.2 times more likely in nonstatistical areas than in metropolitan areas, also similar to the North Carolina findings. Nationally, deaths caused by opioid painkillers have increased in recent years, possibly because of increased retail distribution and changing physician prescribing practices (9). However, further study is needed to discern the reasons for higher death rates in rural areas and to determine whether certain deaths can be attributed to medical use or nonmedical use of opioids. The findings in this report are subject to at least three limitations. First, variability among medical examiner interpretations might have occurred, resulting in different interpretations regarding the drugs causing deaths. Second, statistical areas were classified by using current OMB definitions, although the analysis spanned from 1994 to 2003; micropolitan areas were not introduced into OMB classifications until 2000. Third, this analysis required 10 years of data to collect adequate sample sizes; therefore, trends for drug-poisoning deaths were not evaluated. Prevention, treatment, surveillance, and law enforcement are important factors in addressing the high rate of deaths from drug poisoning. Prevention programs in micropolitan and nonstatistical areas should focus on the abuse of opioid painkillers and prescription drugs, alongside programs to prevent and reduce use of illicit drugs, which caused the majority of deaths in each of the three areas considered. A universal goal for states is to improve access to and availability of substance-abuse treatment to persons in rural settings. Surveillance of drug-poisoning deaths by level of urbanization can provide data to public health agencies that can help them develop targeted programs and interventions. Acknowledgments This report is based, in part, on contributions by K Nolte, MD, S Lathrop, DVM, other staff members of the New Mexico Office of the Medical Investigator. K Kargacin, MA, Bur of Business and Economic Research, Univ of New Mexico. References
* OMB classifies statistical areas according to the population size of core urbanized areas, plus adjacent territory that has a high degree of social and economic integration with the core, as measured by commuting ties. Metropolitan areas have at least one urbanized area with >50,000 population. Micropolitan areas, newly defined in 2000, have at least one urban cluster with 10,000--49,999 population. In this report, all areas classified as neither metropolitan nor micropolitan are referred to as nonstatistical areas. † In 2003, the average population density was 105.0 persons per square mile for the four metropolitan areas, 22.8 for the 14 micropolitan areas, and 2.1 for the 12 nonstatistical areas.
|
Use of trade names and commercial sources is for identification only and does not imply endorsement by the U.S. Department of
Health and Human Services. |
Disclaimer All MMWR HTML versions of articles are electronic conversions from ASCII text into HTML. This conversion may have resulted in character translation or format errors in the HTML version. Users should not rely on this HTML document, but are referred to the electronic PDF version and/or the original MMWR paper copy for the official text, figures, and tables. An original paper copy of this issue can be obtained from the Superintendent of Documents, U.S. Government Printing Office (GPO), Washington, DC 20402-9371; telephone: (202) 512-1800. Contact GPO for current prices.
**Questions or messages regarding errors in formatting should be addressed to mmwrq@cdc.gov.Date last reviewed: 9/7/2005
|
|
|||||
|
HOME |
ABOUT MMWR |
MMWR SEARCH |
DOWNLOADS |
RSS
|
CONTACT
|
|||||
|
|
|||||
|