Influenza Vaccination in the Past 12 Months Among Children Aged 6 Months–17 Years: United States, 2019
NCHS Data Brief No. 407, April 2021
PDF Versionpdf icon (592 KB) | Visual Abstract
- Key findings
- The percentage of children who had an annual influenza vaccination decreased with increasing age.
- The percentage of children who had an annual influenza vaccination varied by race and Hispanic origin.
- The percentage of children who had an annual influenza vaccination varied by urbanization level.
- The percentage of children who had an annual influenza vaccination varied by region.
- Summary
Data from the National Health Interview Survey
- In 2019, just over one-half of children aged 6 months through 17 years (53.1%) had an influenza vaccination in the past 12 months.
- Overall, and for each race and Hispanic-origin group examined, influenza vaccination coverage was lower with increasing age.
- Across all age groups, children in more rural areas had lower influenza vaccination coverage than those in urban areas.
- The percentage of children who had received an influenza vaccination in the past 12 months ranged from 47.9% in the East South Central region to 65.3% in the New England region of the United States.
Increasing the proportion of persons, including children, who are vaccinated annually against seasonal influenza is a Healthy People 2030 Leading Health Indicator (1). Vaccination is effective in preventing influenza (2), and the Advisory Committee on Immunization Practices recommends an annual influenza vaccination for children aged 6 months and over (3). This report examines the percentage of children aged 6 months through 17 years who had an influenza vaccination in the past 12 months using data from the 2019 National Health Interview Survey.
Keywords: flu shot, prevention, National Health Interview Survey (NHIS)
The percentage of children who had an annual influenza vaccination decreased with increasing age.
In 2019, 53.1% of all children had an influenza vaccination in the past 12 months (Figure 1). Influenza vaccination decreased with increasing age.
Approximately three in five children aged 6 months–4 years (61.2%) had an influenza vaccination compared with just over one-half of children aged 5–11 years (53.6%), and less than one-half of children aged 12–17 years (46.7%).
Figure 1. Percentage of children aged 6 months–17 years who had an influenza vaccination in the past 12 months, by age group: United States, 2019
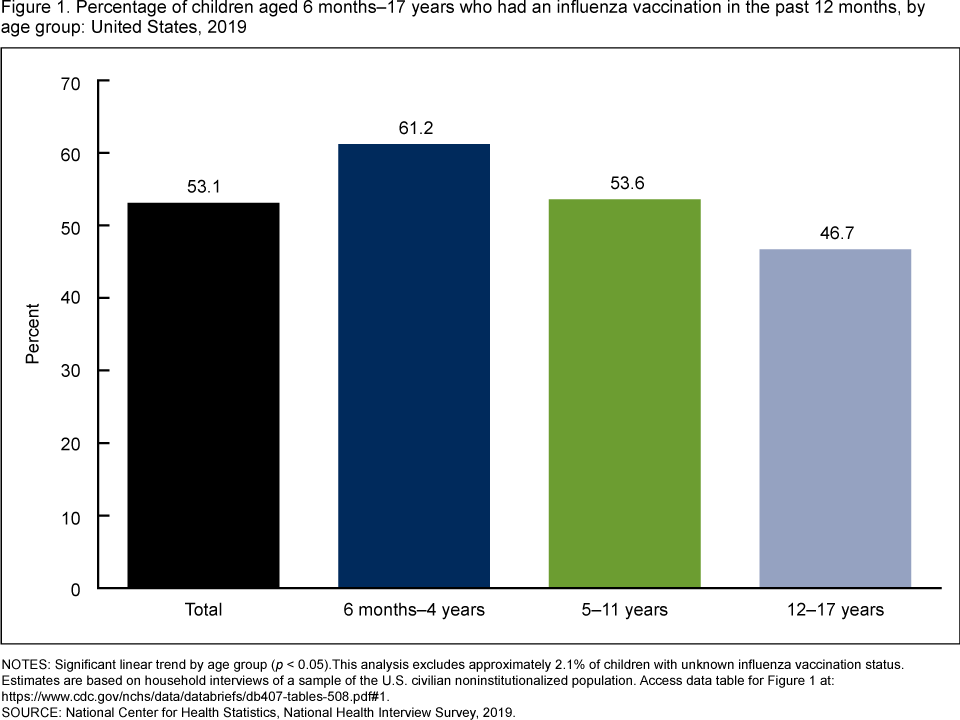 image icon
NOTES: Significant linear trend by age group (p < 0.05). This analysis excludes approximately 2.1% of children with unknown influenza vaccination status. Estimates are based on household interviews of a sample of the U.S. civilian noninstitutionalized population. Access data table for Figure 1pdf icon.
SOURCE: National Center for Health Statistics, National Health Interview Survey, 2019.
The percentage of children who had an annual influenza vaccination varied by race and Hispanic origin.
Influenza vaccination generally decreased with increasing age for each race and Hispanic-origin group, although percentages were similar for the two younger age groups among non-Hispanic black children (Figure 2). Among children aged 6 months–4 years, non-Hispanic black children (48.9%) had lower influenza vaccination coverage than non-Hispanic white (64.1%) and Hispanic (60.6%) children. The observed difference between non-Hispanic black children aged 5–11 years (47.8%) and non-Hispanic white (54.2%) and Hispanic (54.8%) children was not significant. Among children aged 12–17 years, non-Hispanic black children (37.7%) had lower influenza vaccination coverage than non-Hispanic white (45.8%) and Hispanic (49.8%) children.
Figure 2. Percentage of children aged 6 months–17 years who had an influenza vaccination in the past 12 months, by race and Hispanic origin and age group: United States, 2019
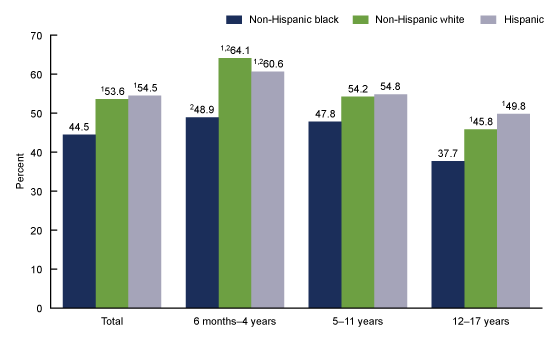 image icon
1Significantly different from non-Hispanic black children (p < 0.05).
2Significant linear trend by increasing age group (p < 0.05).
NOTES: This analysis excludes approximately 2.1% of children with unknown influenza vaccination status. Estimates are based on household interviews of a sample of the U.S. civilian noninstitutionalized population. Access data table for Figure 2pdf icon.
SOURCE: National Center for Health Statistics, National Health Interview Survey, 2019.
The percentage of children who had an annual influenza vaccination varied by urbanization level.
Influenza vaccination decreased with age for each urbanization level, although percentages of vaccination were similar for the two youngest age groups among children from nonmetropolitan areas (Figure 3). Among all age groups, influenza vaccination coverage decreased as place of residence became more rural. Among children aged 6 months–4 years, vaccination decreased from 64.7% in large central metropolitan areas and 64.6% in large fringe metropolitan areas to 59.5% in medium and small metropolitan areas and 51.8% in nonmetropolitan areas. Among those aged 5–11 years, the percentage decreased from 54.7% in large central metropolitan areas to 49.1% in nonmetropolitan areas. The percentage of children aged 12–17 years who had an influenza vaccination ranged from 49.6% in large central metropolitan areas to 40.3% in nonmetropolitan areas.
Figure 3. Percentage of children aged 6 months–17 years who had an influenza vaccination in the past 12 months, by urbanization level and age group: United States, 2019
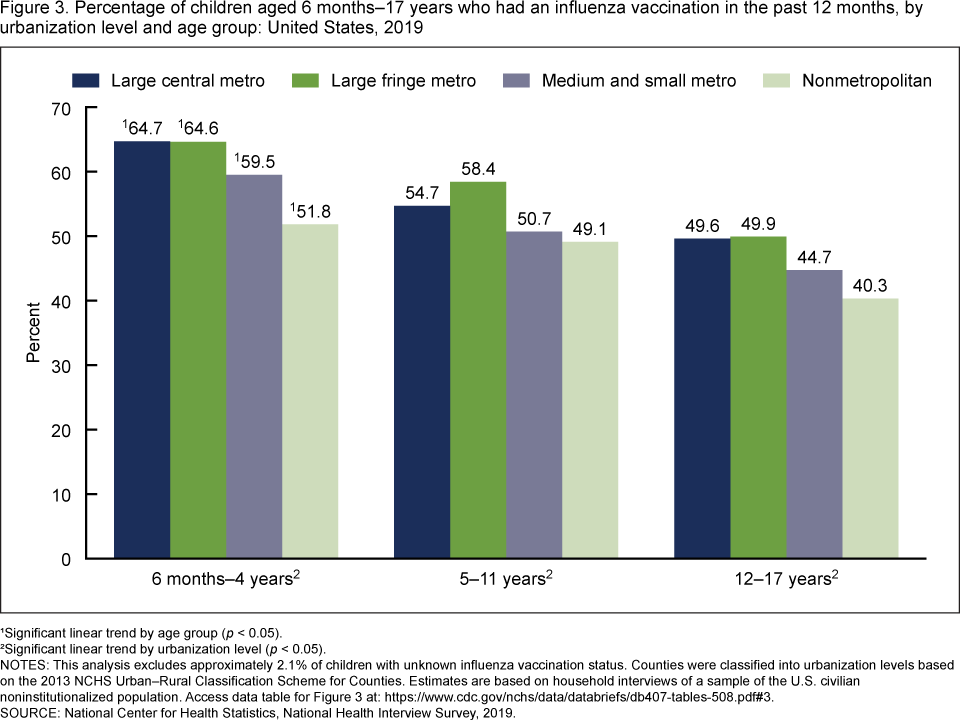 image icon
1Significant linear trend by age group (p < 0.05).
2Significant linear trend by urbanization level (p < 0.05).
NOTES: This analysis excludes approximately 2.1% of children with unknown influenza vaccination status. Counties were classified into urbanization levels based on the 2013 NCHS Urban–Rural Classification Scheme for Counties. Estimates are based on household interviews of a sample of the U.S. civilian noninstitutionalized population. Access data table for Figure 3pdf icon.
SOURCE: National Center for Health Statistics, National Health Interview Survey, 2019.
The percentage of children who had an annual influenza vaccination varied by region.
The percentage of children who had received an influenza vaccination in the past 12 months was significantly lower in the South Atlantic (49.6%) and East South Central (47.9%) regions compared with the national average (53.1%) (Figure 4). The percentage of children who had received an influenza vaccination was significantly higher in the West North Central (58.6%) and New England (65.3%) regions compared with the national average. The percentage of children who had received an influenza vaccination in the Pacific (54.5%), Mountain (51.6%), West South Central (51.6%), East North Central (51.7%), and Middle Atlantic (55.5%) regions was not significantly different from the national average.
Figure 4. Percentage of children aged 6 months–17 years who had an influenza vaccination in the past 12 months, by region: United States, 2019
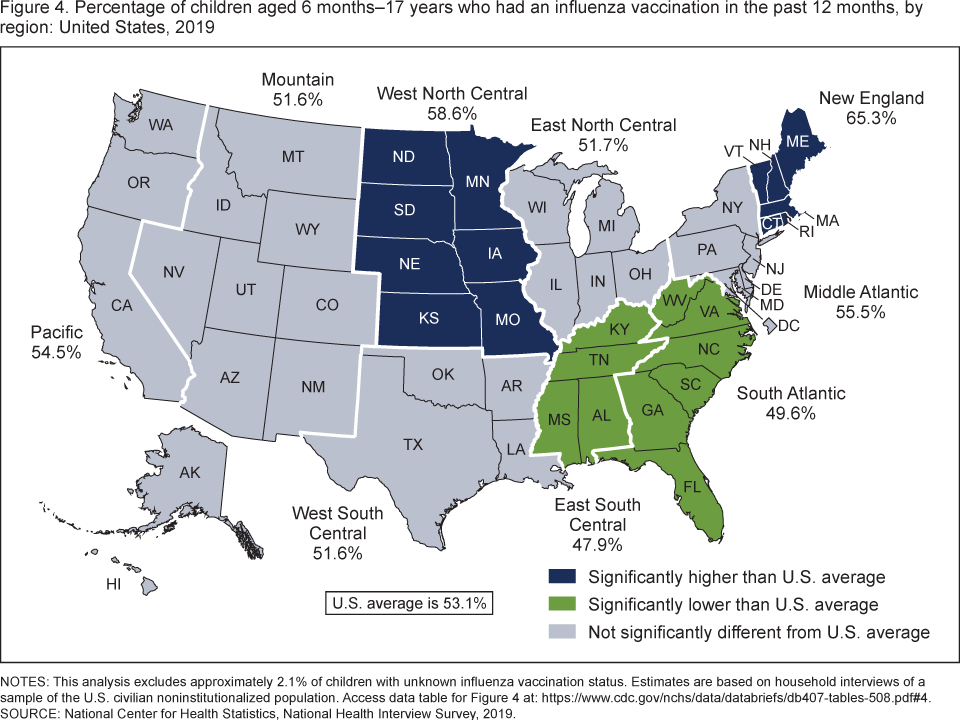 image icon
NOTES: This analysis excludes approximately 2.1% of children with unknown influenza vaccination status. Estimates are based on household interviews of a sample of the U.S. civilian noninstitutionalized population. Access data table for Figure 4pdf icon.
SOURCE: National Center for Health Statistics, National Health Interview Survey, 2019.
Summary
In 2019, 53.1% of children aged 6 months through 17 years received an influenza vaccination in the past 12 months. Influenza vaccination among children was lower for older children compared with younger children. Non-Hispanic black children had lower influenza vaccination coverage compared with non-Hispanic white and Hispanic children. Additionally, influenza vaccination was lower among children residing in more rural areas. Regional differences were also noted with lower percentages of vaccination in the South Atlantic and East South Central regions and higher percentages in the New England and West North Central regions. This report is consistent with previous research documenting demographic and geographic disparities receiving the influenza vaccination (4,5). This report looked at influenza vaccination in the past 12 months using interviews conducted January 2019 through December 2019, which could include vaccinations received during the 2018–2019 or the 2019–2020 influenza seasons. Therefore, these results may differ from other population-based estimates that measure more season-specific vaccination (6).
Definitions
Influenza vaccination: Based on a positive response to the survey question, “There are two types of flu vaccinations. One is a shot and the other is a spray, mist, or drop in the nose. During the past 12 months, has (Sample Child) had a flu vaccination?”
Race and Hispanic origin: Children categorized as Hispanic may be of any race or combination of races. Children categorized as non-Hispanic white or non-Hispanic black indicated one race only. Estimates for non-Hispanic children of races other than white only or black only, or of multiple races, are not shown.
Regions: Categories were slightly modified from the nine U.S. Census Bureau-designated divisions by moving Delaware, the District of Columbia, and Maryland into the Middle Atlantic region (7). Divisions include: New England—Connecticut, Maine, Massachusetts, New Hampshire, Rhode Island, Vermont; Middle Atlantic—Delaware, District of Columbia, Maryland, New Jersey, New York, Pennsylvania; East North Central—Illinois, Indiana, Michigan, Ohio, Wisconsin; West North Central—Iowa, Kansas, Minnesota, Missouri, Nebraska, North Dakota, South Dakota; South Atlantic—Florida, Georgia, North Carolina, South Carolina, Virginia, West Virginia; East South Central—Alabama, Kentucky, Mississippi, Tennessee; West South Central— Arkansas, Louisiana, Oklahoma, Texas; Mountain—Arizona, Colorado, Idaho, Montana, Nevada, New Mexico, Utah, Wyoming; and Pacific—Alaska, California, Hawaii, Oregon, Washington.
Urbanization level: Categories were determined using the 2013 NCHS urban–rural classification scheme for counties (8) and were assigned based on the county of household residence. Metropolitan (or urban) counties include large central counties (inner cities); the fringes of large counties (suburban); and medium and small counties. Nonmetropolitan (or rural) counties include micropolitan statistical areas and noncore areas, including open countryside, rural towns (populations of less than 2,500), and areas with populations of 2,500–49,999 that are not part of larger labor market areas (metropolitan areas).
Data source and methods
Data from the 2019 NHIS were used for this analysis. NHIS is a nationally representative household survey of the U.S. civilian noninstitutionalized population. It is conducted continuously throughout the year by the National Center for Health Statistics (NCHS). Interviews are conducted in respondents’ homes, but follow-ups to complete interviews may be conducted over the telephone. Questions about the child’s health are answered by a knowledgeable adult, usually a parent. For more information about NHIS, visit: https://www.cdc.gov/nchs/nhis.htm.
Information on influenza vaccination was collected during the Sample Child interview and is based on parent report. Estimates are of point prevalence and are considered calendar-year estimates of vaccinations for 2019. This report did not account for the month, year, or number of doses of vaccination. Therefore, estimates may differ from seasonal flu vaccination estimates, which reflect vaccinations received during the flu season.
Point estimates and corresponding confidence intervals for this analysis were calculated using SUDAAN software (9) to account for the complex sample design of NHIS. Differences between percentages were evaluated using two-sided significance tests at the 0.05 level. Linear and quadratic trends by age group and across urbanization levels were evaluated using Proc Descript, poly option. The estimated standard error of the difference between regional and national estimates accounted for nonindependence of regional and national estimates by incorporating their covariance. All estimates meet NCHS standards of reliability as specified in “National Center for Health Statistics Data Presentation Standards for Proportions” (10).
About the authors
Lindsey I. Black, Amanda E. Ng, and Benjamin Zablotsky are with the NCHS Division of Health Interview Statistics.
References
- Health and Human Services. Office of Disease Prevention and Health Promotion. Healthy People 2030external icon.
- Centers for Disease Control and Prevention. National Center for Immunization and Respiratory Diseases. Prevent seasonal flu.
- Grohskopf LA, Alyanak E, Broder KR, Blanton LH, Fry AM, Jernigan DB, Atmar RL. Prevention and control of seasonal influenza with vaccines: Recommendations of the Advisory Committee on Immunization Practices—United States, 2020–21 influenza season. MMWR Recomm Rep 69(8):1–24. 2020. DOI: http://dx.doi.org/10.15585/mmwr.rr6908a1external icon.
- Santibanez TA, Srivastav A, Zhai Y, Singleton JA. Trends in childhood influenza vaccination coverage, United States, 2012–2019. Public Health Rep 135(5):640–9. 2020.
- Schuller KA, Probst JC. Factors associated with influenza vaccination among US children in 2008. J Infect Public Health 6(2):80–8. 2013.
- Centers for Disease Control and Prevention. National Center for Immunization and Respiratory Diseases. Flu vaccination coverage, United States, 2019–20 influenza season.
- Holahan J, Buettgens M, Carroll C, Dorn S. The cost and coverage implications of the ACA Medicaid expansion: National and state-by-state analysis. The Kaiser Commission on Medicaid and the Uninsured. 2012.
- Ingram DD, Franco SJ. 2013 NCHS urban–rural classification scheme for counties. National Center for Health Statistics. Vital Health Stat 2(166). 2014.
- RTI International. SUDAAN (Release 11.0.3) [computer software]. 2018.
- Parker JD, Talih M, Malec DJ, Beresovsky V, Carroll M, Gonzalez JF Jr, et al. National Center for Health Statistics data presentation standards for proportions. National Center for Health Statistics. Vital Health Stat 2(175). 2017.
Suggested citation
Black LI, Ng AE, Zablotsky B. Influenza vaccination in the past 12 months among children aged 6 months–17 years: United States, 2019. NCHS Data Brief, no 407. Hyattsville, MD: National Center for Health Statistics. 2021. DOI: https://doi.org/10.15620/cdc:104187.external icon.
Copyright information
All material appearing in this report is in the public domain and may be reproduced or copied without permission; citation as to source, however, is appreciated.
National Center for Health Statistics
Brian C. Moyer, Ph.D., Director
Amy M. Branum, Ph.D., Acting Associate Director for Science
Division of Health Interview Statistics
Stephen J. Blumberg, Ph.D., Director
Anjel Vahratian, Ph.D., M.P.H., Acting Associate Director for Science