This Quick Learn lesson will take approximately 10 minutes to complete.
When you are finished, you will be able to determine the outbreak's likely mode of spread by analyzing an epidemic curve, or “epi curve.”
You can move through this lesson by using the NEXT and BACK icons below.
X and Y Axes
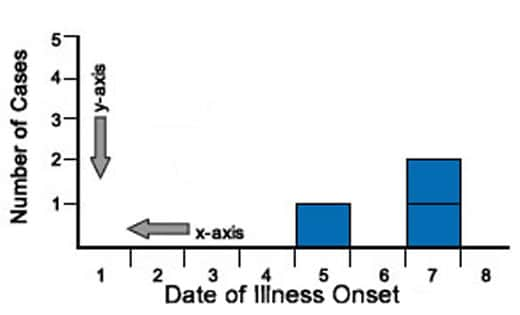
An epidemic curve, or “epi curve,” is a visual display of the onset of illness among cases associated with an outbreak. The epi curve is represented by a graph with two axes that intersect at right angles.
The horizontal x-axis is the date or time of illness onset among cases.
The vertical y-axis is the number of cases.
Each axis is divided into equally spaced intervals, although the intervals for the two axes may differ.
What an Epi Curve Can Tell You
An epi curve is a visual display of the onset of illness among cases associated with an outbreak.
You can learn a lot about an outbreak from an epi curve, such as
- Time trend of the outbreak, that is, the distribution of cases over time
- “Outliers,” or cases that stand apart from the overall pattern
- General sense of the outbreak's magnitude
- Inferences about the outbreak's pattern of spread
- Most likely time of exposure
What an Epi Curve Can Tell You,
continued
The magnitude of an outbreak can be assessed easily with a glance of the epi curve. Are there many cases or just a few?
The time trend, or the distribution of cases over time, will give an indication of where the outbreak is in its course. Are cases still rising or has the outbreak already peaked? Does it appear that the outbreak is over? How long has it been since the last case occurred?
Outliers are cases that stand apart from the other cases. Outliers include the index case, which might be the source of the outbreak, and cases that occur well after other cases, which might indicate secondary spread of the illness.
Index case: the first reported case in an outbreak
Secondary spread: the spread of disease to others from cases exposed through the original source of infection; others can include household members, roommates, and health-care providers by airborne, vehicleborne, and vectorborne direct and indirect transmission
Magnitude, Time Trend, and Outliers
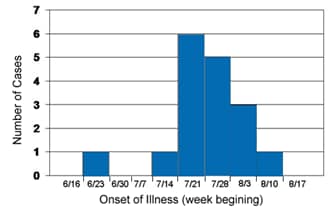
Below is the epi curve from an outbreak of hepatitis A. If today's date is August 17, what can you conclude about the outbreak?
Select a link below to learn more.
Note: The incubation period for hepatitis A is 25-30 days.
Hepatitis A Cases by Date of Onset in Port Yourtown, Washington, June - August 2010

Magnitude
Based on currently reported cases, the outbreak involves 17 total cases.
Hepatitis A cases by date of onset in Port Yourtown, Washington, June - August 2010
Time Trend
The first case of hepatitis A occurred during the third week of June, almost 3 weeks before the other cases. The majority of cases began the week of July 14 and peaked the week of July 21. The last case onset of symptoms appeared during the week of August 10.
Hepatitis A Cases by Date of Onset in Port Yourtown, Washington, June - August 2010

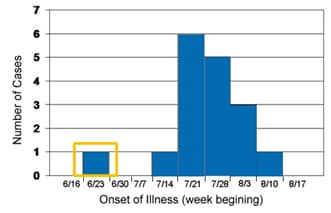
Outliers
The first case arouses suspicion because it occurs about one incubation period before the other cases. This could be the source of the outbreak.
Hepatitis A Cases by Date of Onset in Port Yourtown, Washington, June - August 2010
Mode of Spread: Point Source
An epi curve can also be used to make inferences about inferences about an outbreak's most likely mode of spread, suggesting how a disease is transmitted. Transmission occurs in the following ways:
- Point source
- Continuous common source
- Person-to-person spread (propagation)
In a point source outbreak, persons are exposed over a brief time to the same source, such as a single meal or an event. The number of cases rises rapidly to a peak and falls gradually. The majority of cases occur within one incubation period of the disease.
Cryptospordiosis Cases Associated with a Child Care Center by Date of Onset in Port Yourtown, Washington, June 1998
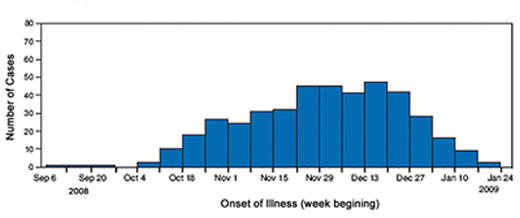
Mode of Spread: Continuous Common Source
In a continuous common source outbreak, persons are exposed to the same source but exposure is prolonged over a period of days, weeks, or longer. The epi curve rises gradually and might plateau.
Salmonellosis Cases Exposed to Contaminated Salami by Date of Onset, United States, December 2009 – January 2010
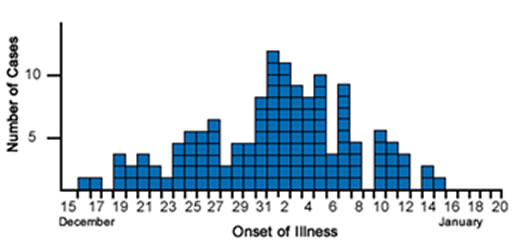
Mode of Spread: Propagated Outbreak
In a propagated outbreak, there is no common source because the outbreak spreads from person-to-person. The graph will assume the classic epi curve shape of progressively taller peaks, each being one incubation period apart.
Measles Cases by Date of Onset in Aberdeen, South Dakota, October 15, 1970 – January 16, 1971
Analyzing the Mode of Spread
Of course, the shape of an epi curve rarely fits any of these descriptions exactly. For propagated outbreaks, the shape might show overlapping waves of cases that obscure subsequent peaks, and peaks might diminish more slowly over time. You can, however, get a general sense about the mode of spread of an outbreak from its epi curve.
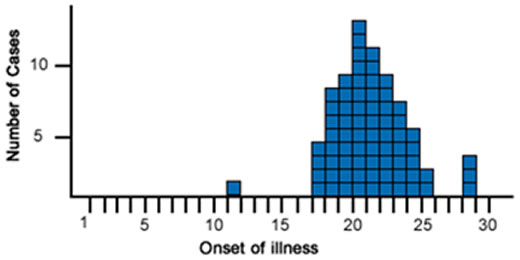
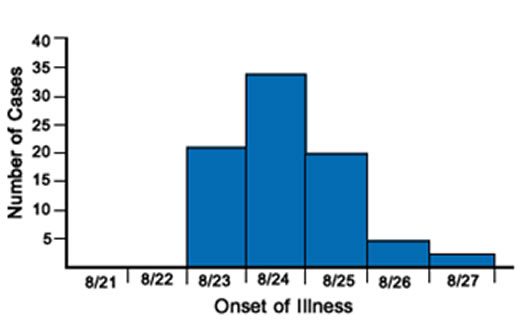
Your Turn: Exercise 1
The average incubation period for Salmonella is 12 to 36 hours and has a range of 6 hours to 10 days.
What do you think is the most likely mode of spread?
Exercise 1: Correct
This epi curve is an example of point source outbreak. The epi curve rises quickly to a peak around August 24-25 before slowly tapering off.
Salmonella Enteritidis Gastroenteritis Cases by Date of Onset in Maryland, August 2008
Exercise 1: Incorrect
This epi curve is an example of point source outbreak. The epi curve rises quickly to a peak around August 24-25 before slowly tapering off.
Salmonella Enteritidis Gastroenteritis Cases by Date of Onset in Maryland, August 2008
Exercise 1: Incorrect
This epi curve is an example of point source outbreak. The epi curve rises quickly to a peak around August 24-25 before slowly tapering off.
Salmonella Enteritidis Gastroenteritis Cases by Date of Onset in Maryland, August 2008
Salmonella Enteritidis Gastroenteritis Cases by Date of Onset in Maryland, August 2008
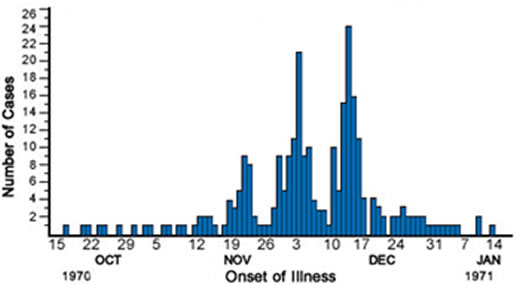
Your Turn: Exercise 2
Let’s look at the epi curve for another outbreak of salmonellosis. Remember, the average incubation period for Salmonella is 12 to 36 hours and has a range of 6 hours to 10 days. What do you think is the most likely mode of spread?
Select the most likely pattern of spread.
Exercise 2: Incorrect
This outbreak is a continuous common source outbreak, in which exposure to contaminated peanut butter continued over many months. Cases gradually rise and plateau from mid-October to mid-December.
Onset of Illness Among Cases of Salmonella Typhimurium Infection Associated with Peanut Butter, United States, 2008-2009.
Exercise 2: Correct
This outbreak is a continuous common source outbreak, in which exposure to contaminated peanut butter continued over many months. Cases gradually rise and plateau from mid-October to mid-December.
Onset of Illness Among Cases of Salmonella Typhimurium Infection Associated with Peanut Butter, United States, 2008-2009.
Exercise 2: Incorrect
This outbreak is a continuous common source outbreak, in which exposure to contaminated peanut butter continued over many months. Cases gradually rise and plateau from mid-October to mid-December.
Onset of Illness Among Cases of Salmonella Typhimurium Infection Associated with Peanut Butter, United States, 2008-2009.
Onset of Illness among Cases of Salmonella Typhimurium Infection Associated with Peanut Butter, United States, 2008-2009.
Summary
Congratulations!
Now you should be able to analyze an epi curve and determine an outbreak’s mode of spread.
To view other Quick Learns, visit CDC Learning Connection.