Chlamydia Screening Percentages Reported by Commercial and Medicaid Plans by State and Year
Table: Percentage of sexually active female enrollees aged 16-24 years who were screened for Chlamydia trachomatis infection by state and year – Healthcare Effectiveness Data and Information Set (HEDIS), United States, 2015†
| State | 2009 | 2010 | 2011 | 2012 | 2013 | 2014 | 2015 |
|---|---|---|---|---|---|---|---|
| USA | 47.0 | 48.1 | 49.6 | 49.2 | 49.3 | 49.9 | 49.8 |
| Alabama | — | — | — | — | — | — | — |
| Alaska | — | — | — | — | — | — | — |
| Arizona | 46.0 | 48.1 | 45.9 | 46.0 | 45.6 | 44.8 | 42.0 |
| Arkansas | — | — | — | — | — | 36.9 | 38.9 |
| California | 52.4 | 52.8 | 54.6 | 54.5 | 54.5 | 55.3 | 55.3 |
| Colorado | 49.2 | 46.7 | 46.9 | 45.6 | 43.0 | 47.6 | 46.9 |
| Connecticut | 55.3 | 56.0 | 55.3 | 57.7 | 57.3 | 58.6 | 58.9 |
| Delaware | 51.7 | 57.9 | 59.4 | 55.7 | 56.2 | 52.2 | 53.8 |
| District of Columbia | 52.1 | 52.3 | 53.3 | 52.3 | 51.9 | 55.7 | 52.9 |
| Florida | 47.2 | 50.3 | 51.2 | 51.4 | 51.9 | 51.3 | 52.6 |
| Georgia | 41.3 | 42.8 | 45.7 | 46.1 | 46.3 | 46.5 | 48.1 |
| Hawaii | 58.1 | 57.8 | 60.5 | 62.6 | 60.6 | 59.6 | 58.1 |
| Idaho | 34.7 | 35.7 | 36.5 | 36.6 | 36.8 | 38.7 | 36.9 |
| Illinois | 37.0 | 38.0 | 39.8 | 41.1 | 40.5 | 42.3 | 44.6 |
| Indiana | 37.3 | 41.0 | 43.6 | 42.4 | 43.1 | 43.7 | 44.2 |
| Iowa | 33.4 | 34.2 | 35.1 | 35.4 | 33.7 | 37.0 | 37.0 |
| Kansas | 36.6 | 36.8 | 38.2 | 36.4 | 40.1 | 40.2 | 38.8 |
| Kentucky | 37.4 | 38.7 | 41.6 | 43.2 | 41.6 | 45.1 | 45.5 |
| Louisiana | 33.5 | 33.6 | 35.3 | 40.3 | 47.7 | 50.7 | 55.1 |
| Maine | 48.2 | 48.9 | 50.9 | 51.6 | 53.3 | 51.6 | 52.6 |
| Maryland | 54.2 | 55.0 | 55.6 | 56.1 | 56.4 | 56.0 | 54.1 |
| Massachusetts | 59.7 | 61.7 | 63.9 | 65.9 | 68.0 | 69.4 | 70.6 |
| Michigan | 52.5 | 54.6 | 55.6 | 50.8 | 50.8 | 51.7 | 53.1 |
| Minnesota | 49.2 | 50.5 | 48.8 | 48.3 | 48.3 | 49.8 | 51.0 |
| Mississippi | — | — | — | 38.4 | 42.3 | 48.4 | 47.9 |
| Missouri | 43.2 | 45.9 | 44.3 | 42.8 | 43.1 | 42.7 | 41.4 |
| Montana | — | — | — | 34.2 | — | — | — |
| Nebraska | 37.2 | 36.0 | 38.7 | 35.1 | 29.4 | 29.1 | 29.3 |
| Nevada | 46.5 | 44.6 | 47.5 | 47.6 | 46.5 | 48.4 | 51.3 |
| New Hampshire | 50.0 | 49.5 | 45.3 | 47.3 | 50.7 | 49.1 | 48.8 |
| New Jersey | 50.5 | 51.3 | 52.9 | 53.1 | 54.6 | 55.1 | 44.8 |
| New Mexico | 48.3 | 47.7 | 47.7 | 46.2 | 44.9 | 45.4 | 45.8 |
| New York | 55.6 | 55.1 | 57.6 | 58.6 | 60.6 | 61.2 | 61.5 |
| North Carolina | 37.5 | 40.3 | 43.2 | 44.7 | 45.4 | 46.1 | 47.4 |
| North Dakota | — | — | — | — | — | — | — |
| Ohio | 40.9 | 42.4 | 44.9 | 44.2 | 43.8 | 44.6 | 45.4 |
| Oklahoma | 29.3 | 30.1 | 34.2 | 35.8 | 35.1 | 35.1 | 36.9 |
| Oregon | 42.9 | 45.9 | 45.7 | 46.6 | 43.3 | 44.3 | 44.1 |
| Pennsylvania | 49.3 | 51.3 | 52.9 | 46.9 | 46.3 | 47.2 | 46.0 |
| Rhode Island | 56.7 | 57.4 | 54.2 | 57.1 | 60.1 | 62.5 | 65.0 |
| South Carolina | 39.0 | 44.3 | 45.6 | 44.6 | 45.2 | 48.0 | 46.6 |
| South Dakota | — | — | — | 41.8 | 41.6 | 41.0 | 43.3 |
| Tennessee | 46.5 | 48.1 | 48.3 | 47.6 | 46.9 | 46.6 | 46.6 |
| Texas | 40.5 | 41.5 | 44.0 | 45.2 | 46.6 | 46.3 | 45.7 |
| Utah | 25.3 | 27.2 | 29.3 | 28.2 | 29.9 | 32.2 | 32.8 |
| Vermont | 45.1 | 44.7 | 47.3 | 47.4 | 49.3 | 50.7 | 51.1 |
| Virginia | 45.4 | 46.1 | 46.2 | 45.5 | 45.7 | 46.0 | 44.2 |
| Washington | 44.2 | 43.1 | 44.6 | 44.3 | 44.2 | 45.2 | 47.8 |
| West Virginia | 35.6 | 37.7 | 38.3 | 37.1 | 35.9 | 35.8 | 37.4 |
| Wisconsin | 42.0 | 42.9 | 42.2 | 42.3 | 42.5 | 42.3 | 43.3 |
| Wyoming | — | — | — | — | — | — | — |
† Data not available for states with less than 5 participating health plans
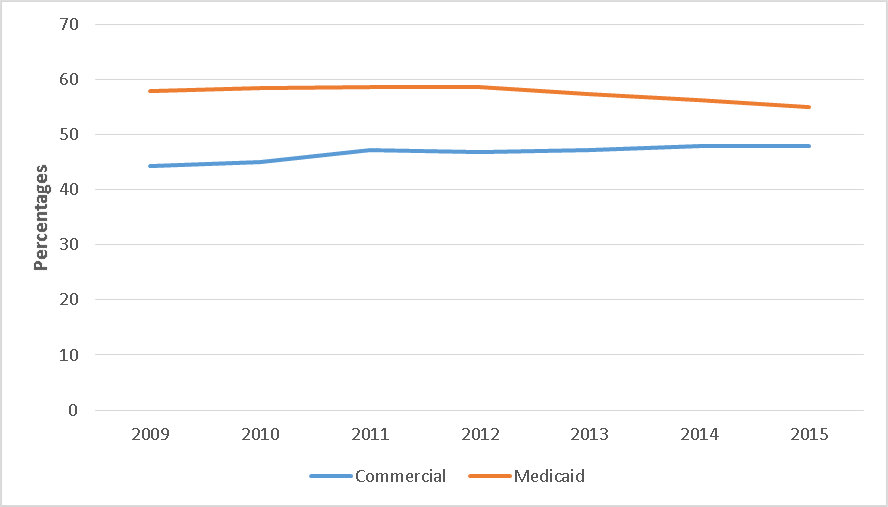
Figure: Percentage of sexually active female enrollees aged 16−24 years who were screened for Chlamydia trachomatis infection, by health plan type and year–‐Healthcare Effectiveness Data and Information Set, United States, 2009–2015
Page last reviewed: February 6, 2017