Skip directly to the search box, site navigation, or content.
NOTICE: The information on this page is no longer being updated and may have changed. The information is accurate only as of the last page update.
Investigation Announcement: Multistate Outbreak of Human Typhoid Fever Infections Associated with Frozen Mamey Fruit Pulp
Infections with the Outbreak Strain of Salmonella Typhi, by Week of Illness Onset (n=9 for whom information was reported as of 08/12/10)
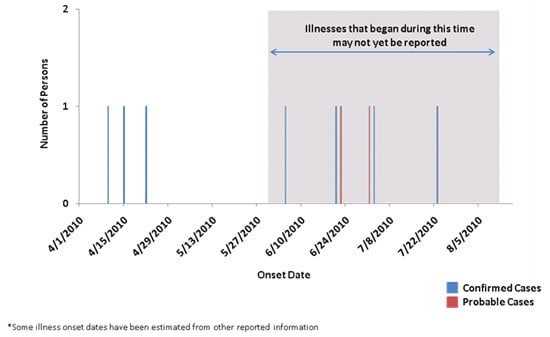
The outbreak can be visually described with a chart showing the number of persons who became ill each day. This chart is called an epidemic curve or epi curve. Illnesses that occurred after May 30, 2010, might not yet be reported due to the time it takes between when a person becomes ill, when laboratory testing is completed, when the diagnosis is confirmed, and when the illness is reported. For typhoid fever outbreaks, this takes an average of 8-10 weeks. This delay is denoted by the gray box on the epi curve.
NOTICE: The information on this page is no longer being updated and may have changed. The information is accurate only as of the last page update.
Content source: Centers for Disease Control and Prevention
National Center for Emerging and Zoonotic Infectious Diseases (NCEZID)
Division of Foodborne, Waterborne,and Environmental Diseases (DFWED)