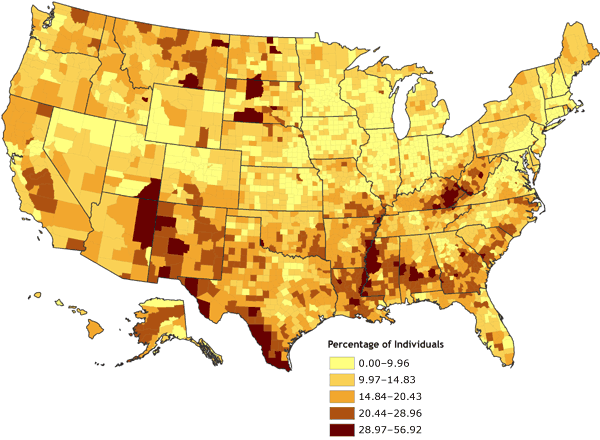
Figure 1. Percentage of individuals living in poverty, by county, 2000. Data are classified by Jenks’ optimal (natural breaks) algorithm (11,12). Data source: Community Health Status Indicators (1).
Map of the United States showing the percentage of individuals living in poverty, by county. Overall, the map gives the impression that the percentage of individuals living in poverty ranges from 0.00% to 20.43% in most counties. The highest percentage of individuals living in poverty is found in only a few counties.
| Range, Percentage | |||||
|---|---|---|---|---|---|
| 0.00-9.96 | 9.97-14.83 | 14.84-20.43 | 20.44-28.96 | 28.97-56.92 | |
| Number of counties in range | 885 | 1068 | 723 | 362 | 101 |
![]()
Volume 4: No. 4, October 2007