Mining Facts - 2011
Overall Mining
The Mine Safety and Health Administration (MSHA) maintains data collected under the Code of Federal Regulations (30 CFR Part 50) on accidents, fatal and nonfatal injuries, illnesses, employment, and coal production. Summary data were obtained from the MSHA data files for mine operators and independent contractors working on mine property. See Statistical Methodology for further information.
Mining Operations
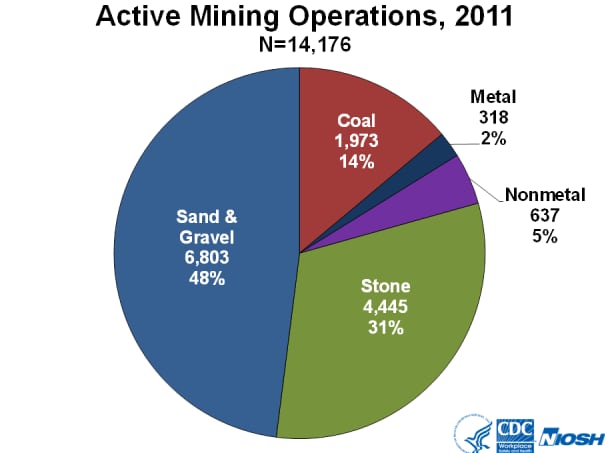
- In 2011, a total of 14,176 mining operations reported employment data to the Mine Safety and Health Administration (MSHA). [1]
- Almost half (48.0%) of the mines were sand and gravel mines, followed by stone mines (31.4%), coal mines (13.9%), nonmetal mines (4.5%), and metal mines (2.2%).
- Mines reporting to MSHA are located in all 50 states, Puerto Rico, and the Virgin Islands. Pennsylvania had the most mines (n=945; 6.7%) followed by Texas (n=711; 5.0%) and Kentucky (n=699; 4.9%). Almost half (49.2%) of the active mining operations are located in the 13 topmost states.
- The top primary commodities produced at mines were sand & gravel (n=6,803; 48.0%) followed by crushed and broken limestone (n=1,956; 13.8%) and bituminous coal (n=1,824; 12.9%).
Click on the image to enlarge.
Data for the previous chart showing the number of active mining operations and percent of total by commodity in 2011 (N=14,176)
| Commodity | Number of Mines | Percent of Total |
|---|---|---|
| Coal | 1,973 | 14 |
| Metal | 318 | 2 |
| Nonmetal | 637 | 5 |
| Stone | 4,445 | 31 |
| Sand & Gravel | 6,803 | 48 |
Independent Contracting Companies
- An independent contractor is defined by MSHA as “any person, partnership, corporation, subsidiary of a corporation, firm, association or other organization that contracts to perform services or construction at a mine.” Contractors that perform specific types of work are required to report the number of employees who work at coal mines and noncoal mines.
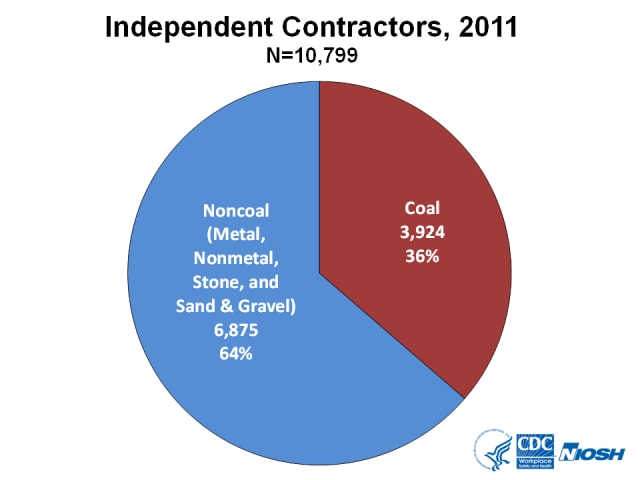
- In 2011, a total of 10,799 independent contractors reported employment data to MSHA.
- There were 3,924 (36.3%) contracting companies working at coal mines and 6,875 (63.7%) contracting companies working at noncoal (metal, nonmetal, stone, and sand & gravel) mines.
Click on the image to enlarge.
Data for the previous chart showing the number of independent contracting companies and percent of total by commodity in 2011 (N=10,799)
| Commodity | Number of Companies | Percent of Total |
|---|---|---|
| Coal | 3,924 | 36 |
| Noncoal (Metal, Nonmetal, Stone, and Sand & Gravel) | 6,875 | 64 |
Employees
- There were 259,330 mine operator employees, [2] or 261,935 full-time equivalent (FTE) [3] workers.
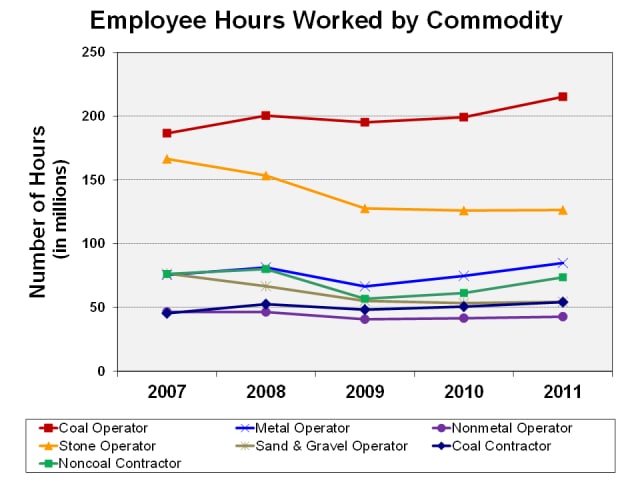
- Within the mining commodities, [4] coal operators reported the most employees (n=94,729; 24.8%), followed by noncoal contractors (n=73,163; 19.2%), stone operators (n=66,983; 17.6%), coal contractors (n=48,734; 12.8%), metal operators (n=40,353; 10.6%), sand & gravel operators (n=36,131; 9.5%), and nonmetal operators (n=21,134; 5.5%).
- For mine operators, 21.5% of the employee hours were for underground work locations, and 78.5% of the employee hours were for surface work locations. [5]
- Of the 121,897 independent contractor employees (or 63,999 FTE workers), 40.0% were coal contractor employees and 60.0% were noncoal (metal, nonmetal, stone, and sand and gravel) contractor employees.
Click on the image to enlarge.
Data for the previous chart showing the average number of employee hours (in millions) worked by commodity and year, 2007-2011
| Commodity | 2007 | 2008 | 2009 | 2010 | 2011 |
|---|---|---|---|---|---|
| Coal Operator | 186.5 | 200.4 | 195.2 | 199.2 | 215.2 |
| Metal Operator | 75.5 | 81.4 | 66.5 | 74.8 | 84.9 |
| Nonmetal Operator | 46.5 | 46.5 | 40.8 | 41.6 | 42.8 |
| Stone Operator | 166.5 | 153.5 | 127.7 | 126.0 | 126.5 |
| Sand & Gravel Operator | 76.7 | 66.7 | 55.2 | 53.5 | 54.5 |
| Coal Contractor | 45.5 | 52.6 | 48.3 | 50.7 | 54.3 |
| Noncoal Contractor | 76.3 | 80.2 | 56.9 | 61.4 | 73.7 |
Occupational Fatalities
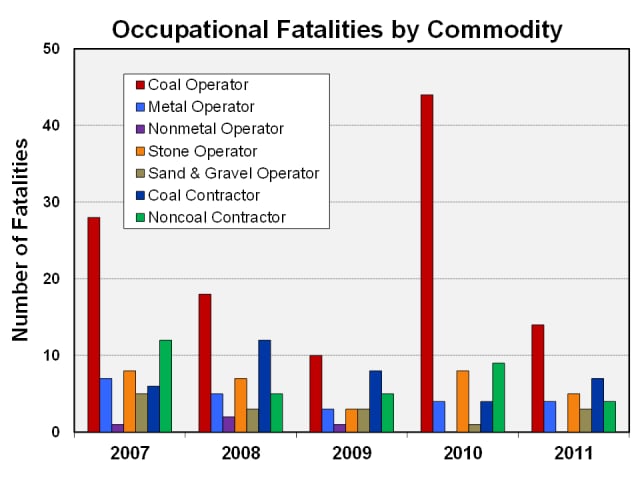
- In 2011, there were 37 occupational mining fatalities with a rate of 12.4 [95% confidence interval (CI): 8.8, 17.1] per 100,000 FTE workers. This compares to 70 fatalities with a rate of 25.4 [CI: 19.8, 32.1] in 2010.
- The fatality rate for mine operator employees was 10.9 [CI: 7.2, 16.0] (n=26), and the rate for contractor employees was 18.4 [CI: 9.2, 32.9] (n=11).
- Coal contractors had the highest fatality rate of 27.6 [CI: 11.1, 56.9] (n=7), followed by coal operators at 13.5 [CI: 7.4, 22.6] (n=14), and stone operators at 9.3 [CI: 3.0, 21.6] (n=5).
- The fatality rate at underground work locations was 20.0 [CI: 10.9, 33.5] per 100,000 FTE workers (n=14; 37.8%) compared to 10.1 [CI: 6.4, 15.2] (n=23; 62.2%) at surface work locations.
Click on the image to enlarge.
Data for the previous chart showing the number of occupational fatalities by commodity and year, 2007-2011 (excludes office employees)
| Commodity | 2007 | 2008 | 2009 | 2010 | 2011 |
|---|---|---|---|---|---|
| Coal Operator | 28 | 18 | 10 | 44 | 14 |
| Metal Operator | 7 | 5 | 3 | 4 | 4 |
| Nonmetal Operator | 1 | 2 | 1 | 0 | 0 |
| Stone Operator | 8 | 7 | 3 | 8 | 5 |
| Sand & Gravel Operator | 5 | 3 | 3 | 1 | 3 |
| Coal Contractor | 6 | 12 | 8 | 4 | 7 |
| Noncoal Contractor | 12 | 5 | 5 | 9 | 4 |
Nonfatal Lost-time Injuries
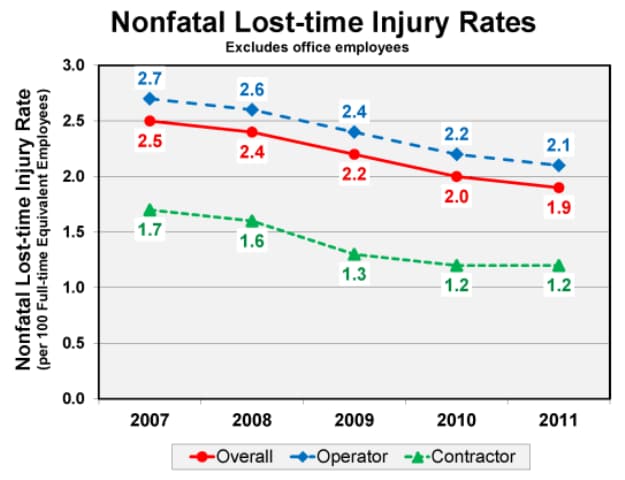
- There were 5,777 nonfatal lost-time injuries in 2011 (2,360 at underground and 3,417 at surface work locations). These injuries occurred at an overall rate of 1.9 [CI: 1.9, 2.0] per 100 FTE workers and resulted in a total of 347,207 days lost from work. [6]
- The underground nonfatal lost-time injury rate was greater than the surface injury rate (3.4 [CI: 3.2, 3.5] vs. 1.5 [CI: 1.5, 1.6] per 100 FTE workers).
Click on the image to enlarge.
Data for the previous chart showing the overall, operator, and contractor nonfatal lost-time injury rate (per 100 full-time equivalent employees) by year, 2007-2011 (excludes office employees)
| Year | Overall | Operator | Contractor |
|---|---|---|---|
| 2007 | 2.5 | 2.7 | 1.7 |
| 2008 | 2.4 | 2.6 | 1.6 |
| 2009 | 2.2 | 2.4 | 1.3 |
| 2010 | 2.0 | 2.2 | 1.2 |
| 2011 | 1.9 | 2.1 | 1.2 |
- The back was the most frequently reported body part injured, accounting for 953 nonfatal lost-time injuries, 49,112 days lost from work, and 14.1% of all days lost.
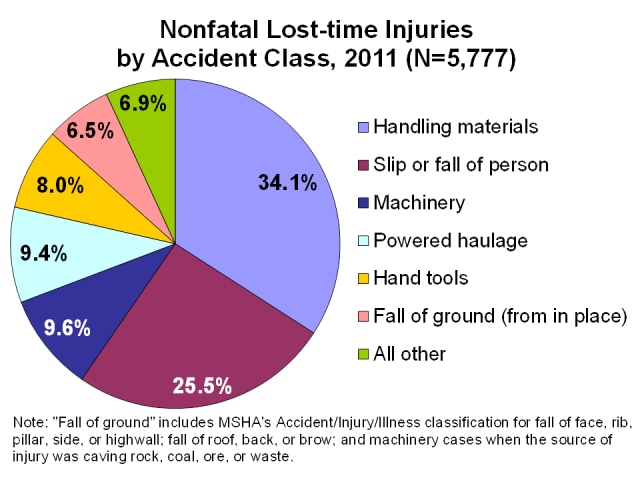
- Sprains or strains was the most frequently reported nature of injury (n=2,454; 42.5%).
Click on the image to enlarge.
Data for the previous chart showing the distribution of nonfatal lost-time injuries by accident class, 2011 (N=5,777)
| Accident Class | Percent |
|---|---|
| Handling materials | 34.1 |
| Slip or fall of person | 25.5 |
| Machinery | 9.6 |
| Powered haulage | 9.4 |
| Hand tools | 8.0 |
| Fall of ground (from in place) | 6.5 |
| All other | 6.9 |
Underground and Surface Mining
Mining Operations
- Data obtained from MSHA indicated a total of 851 underground (6.0%) and 13,325 surface (94.0%) mining operations.
- The commodity with the highest number of active mines was sand & gravel (n=6,803). All sand & gravel mining is performed at surface work locations.
Employees
- A total of 65,218 employees, or 70,136 FTE employees, were reported to MSHA as working at underground mining locations in 2011. This is in contrast to 316,009 employees (or 255,799 FTE employees) who were reported as working at surface locations.
- Surface work location employee hours accounted for 78.5% of all hours reported to MSHA, and 21.5% of employee hours were reported for underground work locations.
- The majority of surface employee hours were for mine operator employees (77.5%) as opposed to independent contractor employees (22.5%).
- The coal operator mining sector reported the most underground worker employee hours to MSHA (n=105,295,854; 75.1%).
Occupational Fatalities
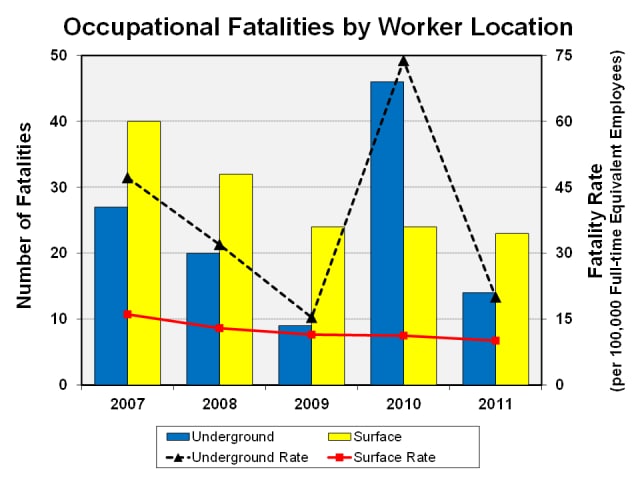
- Of the 37 occupational mining fatalities reported to MSHA in 2011, 14 occurred at underground work locations, while 23 occurred at surface locations.
- The rate of fatalities at underground work locations was 20.0 [CI: 10.9, 33.5] per 100,000 FTE employees. This compares to the lower fatality rate at surface work locations of 10.1 [CI: 6.4, 15.2].
Click on the image to enlarge.
Data for the previous chart showing the number and rate (per 100,000 full-time equivalent employees) of occupational fataltities by worker location and year, 2007-2011 (excludes office employees)
| Year | Underground Number | Underground Rate | Surface Number | Surface Rate |
|---|---|---|---|---|
| 2007 | 27 | 47.2 | 40 | 16.1 |
| 2008 | 20 | 32.0 | 32 | 12.9 |
| 2009 | 9 | 15.4 | 24 | 11.5 |
| 2010 | 46 | 73.9 | 24 | 11.2 |
| 2011 | 14 | 20.0 | 23 | 10.1 |
Nonfatal Lost-time Injuries
- Within underground work locations, 2,360 nonfatal lost-time injuries were reported, resulting in 154,642 days lost from work. This compares to 3,417 nonfatal lost-time injuries attributed to surface workers resulting in 192,565 days lost from work.
- The overall underground nonfatal lost-time injury rate was greater than the surface injury rate (3.4 [CI: 3.2, 3.5] vs. 1.5 [CI: 1.5, 1.6] per 100 FTE workers).
- The most frequent classification of nonfatal lost-time injuries involved handling materials for both underground (n=752; 31.9%) and surface (n=1,219; 35.7%) work locations.
- The back was the most frequently reported body part injured at both underground (n=350; 14.8%) and surface (n=603; 17.6%) work locations.
Coal and Metal/Nonmetal Mining
Mining Operations
- Data obtained from MSHA indicated 1,973 (13.9%) active coal and 12,203 (86.1%) metal/nonmetal (includes metal, nonmetal, stone, and sand & gravel sectors) mining operations.
- There were 26 states reporting coal mining operations. Approximately 72% of these mines were located in three states: Kentucky (n=568; 28.8%), West Virginia (n=440; 22.3%), and Pennsylvania (n=405; 20.5%).
- Metal/nonmetal mines were distributed across all states, Puerto Rico, and the Virgin Islands. Texas reported the most metal/nonmetal mines (n=696; 5.7%).
Employees
- A total of 143,463 mine operator and independent contractor employees (or 134,720 FTE employees) were reported to MSHA as working at coal mines.
- Metal/nonmetal mines reported 237,764 employees (or 191,214 FTE employees).
Occupational Fatalities
- Of the 37 occupational mining fatalities reported to MSHA in 2011, 21 occurred at coal mining operations, and 16 occurred at metal/nonmetal mines.
- The fatality rate of 16.2 [CI: 10.0, 24.8] per 100,000 FTE employees was higher at coal mining operations, compared to the rate of 9.5 [CI: 5.4, 15.5] for metal/nonmetal mines.
Nonfatal Lost-time Injuries
- There were 2,990 nonfatal lost-time injuries reported at coal mining operations, resulting in 199,969 days lost from work. This compares to 2,787 nonfatal lost-time injuries attributed to metal/nonmetal mine workers with 147,238 days lost from work.
- The coal mine nonfatal lost-time injury rate was greater than the metal/nonmetal mine rate (2.3 [CI: 2.2, 2.4] vs. 1.7 [CI: 1.6, 1.7] per 100 FTE workers).
- The most frequent accident classification of nonfatal lost-time injuries involved handling materials for both coal (n=919; 30.7%) and metal/nonmetal mines (n=1,052; 37.7%).
- Sprains or strains was the most frequently reported nature of injury for both coal (n=1,245; 41.6%) and metal/nonmetal (n=1,209; 43.4%) mining operations.
Coal Mine Operators
Mining Operations
- In 2011, a total of 1,973 coal mining operations reported employment to MSHA.
- Coal mines comprised 13.9% of all mining operations.
- Bituminous mines comprised 92.4% (n=1,824) and anthracite mines 7.6% (n=149) of coal mining operations.
- Approximately 72% of all coal mines were located in three states: Kentucky (n=568; 28.8%), West Virginia (n=440; 22.3%), and Pennsylvania (n=405; 20.5%).
Employees
- A total of 94,729 employees, corresponding to 107,590 FTE employees, were reported by coal mine operators.
- Within the mining sectors, coal operators comprised 33.0% of all employee hours reported.
- Underground work locations accounted for 48.9% of employee hours, and surface work locations accounted for 51.1%.
Occupational Fatalities
- In 2011, 14 occupational fatalities occurred among coal mine operator employees, compared to 44 in 2010.
- Fatalities among coal operator employees accounted for 37.8% of all mining fatalities.
- The coal operator fatality rate was 13.5 [CI: 7.4, 22.6] per 100,000 FTE employees. The underground fatality rate was 17.1 [CI: 7.8, 32.5] (n=9). There were 5 fatalities reported at surface work locations with a fatal injury rate per 100,000 FTE employees of 9.7 [CI: 3.2, 22.7].
Nonfatal Lost-time Injuries
- There were 2,587 nonfatal lost-time injuries (1,896 at underground and 691 at surface work locations) among coal operator employees occurring at an overall rate of 2.5 [CI: 2.4, 2.6] injuries per 100 FTE employees. These injuries resulted in 169,827 days lost from work, comprising 48.9% of days lost across all mining sectors.
- The underground nonfatal lost-time injury rate was greater than the surface injury rate (3.6 [CI: 3.4, 3.8] vs. 1.3 [CI: 1.2, 1.4] per 100 FTE workers).
- The most frequent classification of nonfatal lost-time injuries for coal operator employees involved handling materials (n=780; 30.2%).
- Sprains or strains was the most frequently reported nature of injury (n=1,117; 43.2%).
- The back was the most frequently reported body part injured (n=440; 17.0%) and accounted for 26,306 days lost from work.
Metal Mine Operators
Mining Operations
- In 2011, a total of 318 metal mining operations reported employment to MSHA. Metal mines were the smallest mining sector, comprising 2.2% of all mining operations.
- Gold mines comprised 51.3% (n=163) of all metal mining operations.
- Other common types of metal mines were copper ore (n=34; 10.7%) and iron ore (n=31; 9.7%).
- Nevada had the largest number of metal mines (n=59; 18.6%), followed by Alaska (n=38; 11.9%).
Employees
- A total of 40,353 employees, corresponding to 42,437 FTE employees, were reported by metal mine operators.
- Within the mining sectors, metal mine operator employees accounted for 13.0% of all employee hours reported to MSHA.
- Metal operator employee hours were reported for both underground (14.8%) and surface (85.2%) work locations.
Occupational Fatalities
- Four occupational fatalities occurred among metal mine operator employees in 2011. This compares to four occupational fatalities in 2010.
- Of these reported fatalities, three occurred at an underground work location, and one fatality occurred at a surface work location.
Nonfatal Lost-time Injuries
- There were 638 nonfatal lost-time injuries (159 at underground and 479 at surface work locations) among metal operator employees.
- The overall injury rate was 1.7 [CI: 1.6, 1.8] injuries per 100 FTE employees.
- A total of 32,561 days lost from work resulted from these injuries.
- The underground nonfatal lost-time injury rate was greater than the surface injury rate (2.5 [CI: 2.1, 2.9] vs. 1.5 [CI: 1.4, 1.7] per 100 FTE workers).
- The most frequent classification of nonfatal lost-time injuries involved handling materials (n=213; 33.4%), followed by slip or fall of person (n=179; 28.1%).
- Sprains or strains was the most frequently reported nature of injury (n=313; 49.1%).
- The back was the most frequently reported body part injured (n=113 17.7%) and accounted for 5,382 days lost from work.
Nonmetal Mine Operators
Mining Operations
- In 2011, a total of 637 nonmetal mining operations reported employment to the MSHA.
- Nonmetal mines comprised 4.5% of all mining operations.
- Mines producing clay (common) comprised 21.0% (n=134) of all nonmetal mining operations. This was followed by 88 nonmetal mines producing clay, ceramic, and refractory that are not elsewhere classified (13.8%).
- The states with the most nonmetal mining operations were Texas (n=59; 9.3%) and Georgia (n=48; 7.5%).
- Approximately 50% of the active nonmetal mining operations were located in the 9 topmost states of Texas, Georgia, North Carolina, Wyoming, California, New Mexico, Nevada, Oklahoma, and Florida.
Employees
- A total of 21,134 employees, corresponding to 21,419 FTE employees, were reported to MSHA by nonmetal mine operators.
- Within the mining sectors nonmetal mine operator employees accounted for 6.6% of all employee hours reported.
- Employee hours were reported at underground (12.9%) and surface (87.1%) work locations.
Occupational Fatalities
-
There were no occupational fatalities among nonmetal mine operators in 2011. There were also no fatalities reported in 2010.
Nonfatal Lost-time Injuries
- There were 318 nonfatal lost-time injuries (64 at underground and 254 at surface work locations) among nonmetal mine operator employees.
- The overall injury rate was 1.7 [CI: 1.6, 1.9] injuries per 100 FTE employees.
- A total of 19,030 days lost from work resulted from these injuries.
- The underground nonfatal lost-time injury rate was greater than the surface injury rate (2.3 [CI: 1.8, 3.0] vs. 1.6 [CI: 1.4, 1.8] per 100 FTE workers).
- The most frequent classification of nonfatal lost-time injuries involved handling materials (n=135; 42.5%), followed by slip or fall of person (n=79; 24.8%).
- Sprains or strains was the most frequently reported nature of injury (n=141; 44.3%), followed by fractures or chips (n=50; 15.7%), cuts, lacerations, or punctures (n=38; 11.9%), and contusions or bruises (n=28; 8.8%).
- The back was the most frequently reported body part injured (n=58; 18.2%) and accounted for 3,054 days lost from work. This was followed by fingers (n=43; 13.5%), shoulders (n=33; 10.4%), and knees (n=32; 10.1%).
Stone Mine Operators
Mining Operations
- In 2011, a total of 4,445 stone mining operations reported employment to MSHA. Stone mines comprised 31.4% of all mining operations.
- Mines producing the primary commodity of limestone (crushed and broken) comprised the largest number of operations (n=1,956; 44.0%).
- Stone mining operations were located in all states and territories except Delaware.
- Pennsylvania had the most stone mines (n=429; 9.7%), followed by Texas (n=353; 7.9%).
Employees
- A total of 66,983 employees, corresponding to 63,242 full-time equivalent (FTE) employees, were reported to MSHA by stone mine operators.
- Within the mining sectors, stone mine operator employees accounted for 19.4% of all employee hours reported.
- Stone operator employee hours were reported for both underground (3.0%) and surface (97.0%) work locations.
Occupational Fatalities
- There were five occupational fatalities reported among stone mine operator employees in 2011, compared to eight in 2010.
- The five fatalities had accident classifications of powered haulage (n=2), machinery (n=2), and fall of ground (from in place) (n=1).
Nonfatal Lost-time Injuries
- There were 1,115 nonfatal lost-time injuries (35 at underground and 1,080 at surface work locations) among stone operator employees
- The overall rate was 2.1 [CI: 1.9, 2.2] injuries per 100 FTE employees.
- A total of 58,174 days lost from work resulted from these injuries, comprising 16.8% of days lost across all sectors.
- The nonfatal lost-time injury rate was 1.8 [CI: 1.3, 2.5] for underground and 2.1 [CI: 2.0, 2.2] per 100 FTE for surface work locations.
- The most frequent classification of nonfatal lost-time injuries for stone operator employees involved handling materials (n=444; 39.8%).
- Sprains or strains was the most frequently reported nature of injury (n=512; 45.9%).
- The back was the most frequently reported body part injured (n=190, 17.0%) and accounted for 7,436 days lost from work.
Sand & Gravel Mine Operators
Mining Operations
- In 2011, a total of 6,803 sand & gravel mining operations reported employment to MSHA.
- Sand & gravel mines were the largest mining sector, comprising 48.0% of all mining operations.
- All sand & gravel mining is performed at surface work locations.
- Sand & gravel mines were found throughout all 50 states and Puerto Rico.
- Minnesota had the largest number of sand & gravel mines (n=497; 7.3%).
Employees
- A total of 36,131 employees, corresponding to 27,248 FTE employees, were reported by sand & gravel mine operators.
- Within the mining sectors, sand & gravel mine operator employees accounted for 8.4% of all employee hours reported to MSHA.
- All sand & gravel operator hours reported were for surface work locations.
- The total number of hours reported for mine operator employees working at sand & gravel mining operations was 54,495,415.
Occupational Fatalities
- Three occupational fatalities occurred among sand & gravel operator employees in 2011. This compared to one fatality in 2010.
Nonfatal Lost-time Injuries
- There were 371 nonfatal lost-time injuries among sand & gravel operator employees.
- The overall rate was 1.6 [CI: 1.4, 1.7] injuries per 100 FTE employees.
- A total of 16,174 days lost from work resulted from these injuries.
- The most frequent classifications of nonfatal lost-time injuries for sand & gravel operator employees involved handling materials (n=138; 37.2%) and slip or fall of person (n=105; 28.3%).
- Sprains or strains was the most frequently reported nature of injury (n=131; 35.3%), followed by fracture, chip (n=75; 20.2%).
- The fingers were the most frequently reported body part injured (n=53; 14.3%), followed by the back (n=48; 12.9%) and the knee (n=46; 12.4%).
Coal Contractors
Contracting Companies
- In 2011, a total of 3,924 independent contracting companies reported employment at coal mines, or 36.3% of all independent contracting companies.
Employees
- A total of 48,734 employees, corresponding to 27,130 FTE employees, were reported by coal contractors.
- Within the mining sectors, coal contractor employees comprised 8.3% of all employee hours.
- Coal contractor employee hours were reported for both underground (16.1%) and surface (83.9%) work locations.
Occupational Fatalities
- Seven occupational fatalities occurred among coal contractor employees in 2011. These coal fatalities accounted for 63.6% of all fatalities attributed to independent contractors.
- The coal contractor fatality rate was 27.6 [95% CI: 11.1, 56.9] per 100,000 FTE employees.
Nonfatal Lost-time Injuries
- There were 403 nonfatal lost-time injuries among coal contractor employees (172 at underground and 231 at surface work locations).
- The overall rate was 1.6 [CI: 1.4, 1.7] injuries per 100 FTE employees.
- Coal contractor injuries resulted in 30,142 days lost from work.
- The underground nonfatal lost-time injury rate was greater than the surface injury rate (3.9 [CI: 3.3, 4.5] vs. 1.1 [CI: 1.0, 1.2] per 100 FTE workers).
- The most frequent classification of nonfatal lost-time injuries involved handling materials (n=139; 34.5%), followed by slip or fall of person (n=100; 24.8%).
- Sprains or strains was the most frequently reported nature of injury (n=128; 31.8%).
- The back was the most frequently reported body part injured (n=64; 15.9%) and accounted for 3,421 days lost from work.
Noncoal Contractors
Contracting Companies
- In 2011, a total of 6,875 independent contracting companies reported employment at noncoal (metal, nonmetal, stone, and sand & gravel) mines, or 63.7% of all independent contracting companies.
Employees
- A total of 73,163 employees, corresponding to 36,869 FTE employees, were reported by noncoal contractors.
- Within the mining sectors, noncoal contractor employees comprised 11.3% of all employee hours.
- Noncoal contractor employee hours were reported for both underground (5.8%) and surface (94.2%) work locations.
Occupational Fatalities
- Four occupational fatalities occurred among noncoal contractor employees in 2011, accounting for 36.4% of all fatalities attributed to independent contractors.
- The noncoal contractor fatality rate was not calculated because the number of fatalities was less than 5 (n=4).
Nonfatal Lost-time Injuries
- There were 345 nonfatal lost-time injuries among noncoal contractor employees (34 at underground and 311 at surface work locations).
- The overall rate was 1.0 [CI: 0.9, 1.1] injuries per 100 FTE employees.
- Noncoal contractor injuries resulted in 21,299 days lost from work.
- The underground nonfatal lost-time injury rate was 1.6 [CI: 1.1, 2.2], and the surface rate was 1.0 [CI: 0.9, 1.1] per 100 FTE workers.
- The most frequent classification of nonfatal lost-time injuries involved handling materials (n=122; 35.4%), followed by slip or fall of person (n=94; 27.2%).
- Sprains or strains was the most frequently reported nature of injury (n=112; 32.5%) for noncoal contractor employees.
- The most frequently reported body part injured was the fingers (n=66; 19.1%) These injuries resulted in 5,533 days lost from work.
Notes
Publicly released employment and accident/injury/illness data collected by the Mine Safety and Health Administration (MSHA) under the Code of Federal Regulations (30 CFR 50). All analyses of accident data exclude office employees. Occupational fatalities exclude all cases under 17 years of age. Caution should be used when interpreting rates based on a small number of events.
[1] Both mine operator and independent contractor employees work at mining operations. Active mines are those that report any mine operator employment. Mines at which only independent contractors were working and did not show any operator employment were not counted.
[2] Average number of employees working at individual mines during calendar quarters of active operations (includes office workers).
[3] Full-time equivalent employees computed using reported employee hours (2,000 hours = 1 FTE; includes office workers).
[4] Mining commodity and type of employer classes include coal operators, metal operators, nonmetal operators, stone operators, sand & gravel operators, coal contractors, and noncoal (metal, nonmetal, stone, and sand & gravel) contractors.
[5] Surface work locations include surface operations at underground mines, surface operations (strip or open pit), dredge, other surface operations, independent shops and yards, and mills or preparation plants.
[6] Total days lost includes actual days away from work and/or days of restricted work activity. For permanently disabling injuries only, statutory days charged by MSHA were used if they exceeded the total lost workdays.
Data Tables
Active Mining Operations, 2011
| Commodity | Underground | Surface | Total |
|---|---|---|---|
| Coal | 585 | 1,388 | 1,973 |
| Metal | 115 | 203 | 318 |
| Nonmetal | 41 | 596 | 637 |
| Stone | 110 | 4,335 | 4,445 |
| Sand & Gravel | 0 | 6,803 | 6,803 |
| TOTAL | 851 | 13,325 | 14,176 |
Employment Characteristics, 2011
| Commodity and Type of Employer | Underground Employees | Surface Employees | Total Employees | Underground FTE Employees | Surface FTE Employees | Total FTE Employees |
|---|---|---|---|---|---|---|
| Coal Operator | 45,165 | 49,564 | 94,729 | 52,648 | 54,942 | 107,590 |
| Metal Operator | 6,116 | 34,237 | 40,353 | 6,284 | 36,152 | 42,437 |
| Nonmetal Operator | 2,611 | 18,523 | 21,134 | 2,769 | 18,649 | 21,419 |
| Stone Operator | 1,792 | 65,191 | 66,983 | 1,921 | 61,321 | 63,242 |
| Sand & Gravel Operator | 0 | 36,131 | 36,131 | 0 | 27,248 | 27,248 |
| Operator Total | 55,684 | 203,646 | 259,330 | 63,623 | 198,312 | 261,935 |
| Coal Contractor | 6,440 | 42,294 | 48,734 | 4,376 | 22,755 | 27,130 |
| Noncoal Contractor | 3,094 | 70,069 | 73,163 | 2,137 | 34,732 | 36,869 |
| Contractor Total | 9,534 | 112,363 | 121,897 | 6,513 | 57,486 | 63,999 |
| TOTAL | 65,218 | 316,009 | 381,227 | 70,136 | 255,799 | 325,934 |
Note: Components may not sum to totals due to rounding
Occupational Fatalities, 2011
Rate per 100,000 full-time equivalent employees; 95% confidence interval
| Commodity and Type of Employer | Total Number | Total Rate | Total Lower CI | Total Upper CI |
|---|---|---|---|---|
| Coal Operator | 14 | 13.5 | 7.4 | 22.6 |
| Metal Operator | 4 | NC | NC | NC |
| Nonmetal Operator | 0 | NC | NC | NC |
| Stone Operator | 5 | 9.3 | 3.0 | 21.6 |
| Sand & Gravel Operator | 3 | NC | NC | NC |
| Operator Total | 26 | 10.9 | 7.2 | 16.0 |
| Coal Contractor | 7 | 27.6 | 11.1 | 56.9 |
| Noncoal Contractor | 4 | NC | NC | NC |
| Contractor Total | 11 | 18.4 | 9.2 | 32.9 |
| TOTAL | 37 | 12.4 | 8.8 | 17.1 |
Note: NC–Not calculated when N is less than 5
Occupational Fatalities (Underground), 2011
Rate per 100,000 full-time equivalent employees; 95% confidence interval
| Commodity and Type of Employer | Underground Number | Underground Rate | Underground Lower CI | Underground Upper CI |
|---|---|---|---|---|
| Coal Operator | 9 | 17.1 | 7.8 | 32.5 |
| Metal Operator | 3 | NC | NC | NC |
| Nonmetal Operator | 0 | NC | NC | NC |
| Stone Operator | 1 | NC | NC | NC |
| Sand & Gravel Operator | NA | NA | NA | NA |
| Operator Total | 13 | 20.4 | 10.9 | 34.9 |
| Coal Contractor | 0 | NC | NC | NC |
| Noncoal Contractor | 1 | NC | NC | NC |
| Contractor Total | 1 | NC | NC | NC |
| TOTAL | 14 | 20.0 | 10.9 | 33.5 |
Notes: NA–Not applicable; NC–Not calculated when N is less than 5
Occupational Fatalities (Surface), 2011
Rate per 100,000 full-time equivalent employees; 95% confidence interval
| Commodity and Type of Employer | Surface Number | Surface Rate | Surface Lower CI | Surface Upper CI |
|---|---|---|---|---|
| Coal Operator | 5 | 9.7 | 3.2 | 22.7 |
| Metal Operator | 1 | NC | NC | NC |
| Nonmetal Operator | 0 | NC | NC | NC |
| Stone Operator | 4 | NC | NC | NC |
| Sand & Gravel Operator | 3 | NC | NC | NC |
| Operator Total | 13 | 7.5 | 4.0 | 12.8 |
| Coal Contractor | 7 | 33.4 | 13.4 | 68.8 |
| Noncoal Contractor | 3 | NC | NC | NC |
| Contractor Total | 10 | 18.7 | 9.0 | 34.5 |
| TOTAL | 23 | 10.1 | 6.4 | 15.2 |
Note: NC–Not calculated when N is less than 5
Nonfatal Lost-time Injuries, 2011
Rate per 100 full-time equivalent employees; 95% confidence interval
| Commodity and Type of Employer | Total Number | Total Rate | Total Lower CI | Total Upper CI |
|---|---|---|---|---|
| Coal Operator | 2,587 | 2.5 | 2.4 | 2.6 |
| Metal Operator | 638 | 1.7 | 1.6 | 1.8 |
| Nonmetal Operator | 318 | 1.7 | 1.6 | 1.9 |
| Stone Operator | 1,115 | 2.1 | 1.9 | 2.2 |
| Sand & Gravel Operator | 371 | 1.6 | 1.4 | 1.7 |
| Operator Total | 5,029 | 2.1 | 2.1 | 2.2 |
| Coal Contractor | 403 | 1.6 | 1.4 | 1.7 |
| Noncoal Contractor | 345 | 1.0 | 0.9 | 1.1 |
| Contractor Total | 748 | 1.2 | 1.2 | 1.3 |
| TOTAL | 5,777 | 1.9 | 1.9 | 2.0 |
Nonfatal Lost-time Injuries (Underground), 2011
Rate per 100 full-time equivalent employees; 95% confidence interval
| Commodity and Type of Employer | Underground Number | Underground Rate | Underground Lower CI | Underground Upper CI |
|---|---|---|---|---|
| Coal Operator | 1,896 | 3.6 | 3.4 | 3.8 |
| Metal Operator | 159 | 2.5 | 2.1 | 2.9 |
| Nonmetal Operator | 64 | 2.3 | 1.8 | 3.0 |
| Stone Operator | 35 | 1.8 | 1.3 | 2.5 |
| Sand & Gravel Operator | NA | NA | NA | NA |
| Operator Total | 2,154 | 3.4 | 3.2 | 3.5 |
| Coal Contractor | 172 | 3.9 | 3.3 | 4.5 |
| Noncoal Contractor | 34 | 1.6 | 1.1 | 2.2 |
| Contractor Total | 206 | 3.2 | 2.7 | 3.6 |
| TOTAL | 2,360 | 3.4 | 3.2 | 3.5 |
Note: NA–Not applicable
Nonfatal Lost-time Injuries (Surface), 2011
Rate per 100 full-time equivalent employees; 95% confidence interval
| Commodity and Type of Employer | Surface Number | Surface Rate | Surface Lower CI | Surface Upper CI |
|---|---|---|---|---|
| Coal Operator | 691 | 1.3 | 1.2 | 1.4 |
| Metal Operator | 479 | 1.5 | 1.4 | 1.7 |
| Nonmetal Operator | 254 | 1.6 | 1.4 | 1.8 |
| Stone Operator | 1,080 | 2.1 | 2.0 | 2.2 |
| Sand & Gravel Operator | 371 | 1.6 | 1.4 | 1.7 |
| Operator Total | 2,875 | 1.7 | 1.6 | 1.7 |
| Coal Contractor | 231 | 1.1 | 1.0 | 1.2 |
| Noncoal Contractor | 311 | 1.0 | 0.9 | 1.1 |
| Contractor Total | 542 | 1.0 | 0.9 | 1.1 |
| TOTAL | 3,417 | 1.5 | 1.5 | 1.6 |
- Coal and metal/nonmetal mining facts - 2008
- Coal and Metal/Nonmetal Mining Facts - 2008 (HTML)
- Coal Contractor Mining Facts - 2001
- Coal Contractor Mining Facts - 2002
- Coal Contractor Mining Facts - 2003
- Coal Contractor Mining Facts - 2004
- Coal Contractor Mining Facts - 2005
- Coal Contractor Mining Facts - 2006
- Coal Contractor Mining Facts - 2007
- Data & Statistics
- Mining Fact Sheets
- Rib Falls: A Major Ground Control Issue
- Statistical Methodology
