Mining Publication: Mining Facts - 2008
Original creation date: March 2011
Authors: National Institute for Occupational Safety and Health
NIOSHTIC2 Number: 20039157
Pittsburgh, PA: U. S. Department of Health and Human Services, Public Health Service, Centers for Disease Control and Prevention, National Institute for Occupational Safety and Health, DHHS (NIOSH) Publication No. 2011-161, 2011 Mar; :1-2
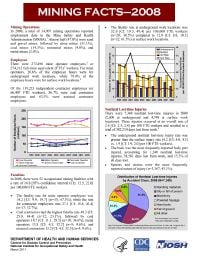
Mining Operations: In 2008, a total of 14,907 mining operations reported employment data to the Mine Safety and Health Administration (MSHA). Almost half (47.8%) were sand and gravel mines, followed by stone mines (31.1 %), coal mines (14.3%), nonmetal mines (4.8%), and metal mines (2.0%). Employees: There were 273,496 mine operator employees, or 274,212 full-time equivalent (FTE) workers. For mine operators, 20.6% of the employee hours were for underground work locations, while 79.4% of the employee hours were for surface work locations. Of the 119,223 independent contractor employees (or 66,407 FTE workers), 36.7% were coal contractor employees and 63.3% were noncoal contractor employees. Fatalities: In 2008, there were 52 occupational mining fatalities with a rate of 16.8 [95% confidence interval (CI): 12.5, 22.0] per 100,000 FTE workers. 1. The fatality rate for mine operator employees was 14.2 [CI: 9.9, 19.7] (n=35 ; 67.3%), while the rate for contractor employees was 27.1 [CI: 15.8, 43.4] (n=17; 32.7%). 2. Coal contractors had the highest fatality rate 48.3 [CI: 25.0, 84.4] (n=12; 23. 1%), followed by coal operators 18.7 [C!: 11.1 , 29.5] (n=18; 34.6%), metal operators 13.8 [C!: 4.5, 32.2] (n=5; 9.6%), and noncoal contractors 13.2 [CI: 4.5, 32.5] (n=5; 9.6%). 3. The fatality rate at underground work locations was 32.0 [CI : 19 .5, 49.4] per 100,000 FTE workers (n=20 ; 38.5%) compared to 12.9 [CI: 8.8, 18.3] (n=32; 61.5%) at surface work locations. Nonfatal Lost-time Injuries: There were 7,348 nonfatal lost-time injuries in 2008 (2,600 at underground and 4,748 at surface work locations). These injuries occurred at an overall rate of 2.4 [CI: 2.3, 2.4] per 100 FTE workers and resulted in a total of 382,210 days lost from work. 1. The underground nonfatal lost-time injury rate was greater than the surface injury rate (4.2 [CI: 4.0, 4.3] vs. 1.9 [CI: 1.9, 2.0] per 100 FTE workers). 2. The back was the most frequently reported body part injured, accounting for 1,240 nonfatal lost-time injuries, 58,561 days lost from work, and 15.3% of all days lost. 3. Sprains and strains were the most frequently reported nature of injury (n=3,167; 43.1 %).
NIOSHTIC2 Number: 20039157
Pittsburgh, PA: U. S. Department of Health and Human Services, Public Health Service, Centers for Disease Control and Prevention, National Institute for Occupational Safety and Health, DHHS (NIOSH) Publication No. 2011-161, 2011 Mar; :1-2
- Coal and metal/nonmetal mining facts - 2008
- Coal and Metal/Nonmetal Mining Facts - 2008 (HTML)
- Coal Contractor Mining Facts - 2001
- Coal Contractor Mining Facts - 2002
- Coal Contractor Mining Facts - 2003
- Coal Contractor Mining Facts - 2004
- Coal Contractor Mining Facts - 2005
- Coal Contractor Mining Facts - 2006
- Mining Fact Sheets
- Rib Falls: A Major Ground Control Issue