Mining Publication: Mining Facts - 2006
Original creation date: September 2008
Authors: National Institute for Occupational Safety and Health
NIOSHTIC2 Number: 20034741
Pittsburgh, PA: U.S. Department of Health and Human Services, Public Health Service, Centers for Disease Control and Prevention, National Institute for Occupational Safety and Health, DHHS (NIOSH) Publication No. 2008-158, 2008 Sep; :1-2
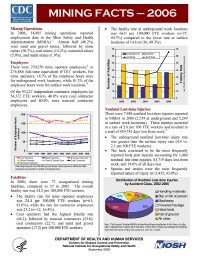
Mining Operations: In 2006, 14,885 mining operations reported employment data to the Mine Safety and Health Administration (MSHA). Almost half (48.2%) were sand and gravel mines, followed by stone mines (30.7%), coal mines (14.2%), nonmetal mines (5.0%), and metal mines (1.9%). Employees: There were 270,270 mine operator employees, or 276,886 full-time equivalent (FTE) workers. For mine operators, 18.7% of the employee hours were for underground work locations, while 81.3% of the employee hours were for surface work locations. Of the 93,227 independent contractor employees (or 54,372 FTE workers), 40.0% were coal contractor employees and 60.0% were noncoal contractor employees. Fatalities: In 2006, there were 73 occupational mining fatalities, compared to 57 in 2005. The overall fatality rate was 24.2 per 100,000 FTE workers. The fatality rate for mine operator employees was 24.4 per 100,000 FTE workers (n=61; 83.6%), while the rate for contractor employees was 23.2 (n=12; 16.4%). Coal operators had the highest fatality rate (46.2), followed by noncoal contractors (23.6), coal contractors (22.7), and sand and gravel operators (17.2) per 100,000 FTE workers. The fatality rate at underground work locations was 66.0 per 100,000 FTE workers (n=37; 50.7%) compared to the lower rate at surface locations of 14.6 (n=36; 49.3%). Nonfatal Lost-time Injuries: There were 7,988 nonfatal lost-time injuries reported to MSHA in 2006 (2,739 at underground and 5,249 at surface work locations). These injuries occurred at a rate of 2.6 per 100 FTE workers and resulted in a total of 439,742 days lost from work. The underground nonfatal lost-time injury rate was greater than the surface injury rate (4.9 vs. 2.1 per 100 FTE workers). The back continued to be the most frequently reported body part injured, accounting for 1,484 nonfatal lost-time injuries, 83,719 days lost from work, and 19.0% of all days lost. Sprains and strains were the most frequently reported nature of injury (n=3,435; 43.0%).
NIOSHTIC2 Number: 20034741
Pittsburgh, PA: U.S. Department of Health and Human Services, Public Health Service, Centers for Disease Control and Prevention, National Institute for Occupational Safety and Health, DHHS (NIOSH) Publication No. 2008-158, 2008 Sep; :1-2
- Coal and metal/nonmetal mining facts - 2008
- Coal and Metal/Nonmetal Mining Facts - 2008 (HTML)
- Coal Contractor Mining Facts - 2001
- Coal Contractor Mining Facts - 2002
- Coal Contractor Mining Facts - 2003
- Coal Contractor Mining Facts - 2004
- Coal Contractor Mining Facts - 2005
- Coal Contractor Mining Facts - 2006
- Mining Fact Sheets
- Rib Falls: A Major Ground Control Issue