Mining Publication: Sand and Gravel Operator Mining Facts - 2008
Original creation date: March 2011
Authors: National Institute for Occupational Safety and Health
NIOSHTIC2 Number: 20039163
Pittsburgh, PA: U. S. Department of Health and Human Services, Public Health Service, Centers for Disease Control and Prevention, National Institute for Occupational Safety and Health, DHHS (NIOSH) Publication No. 2011-167, 2011 Mar; :1-2
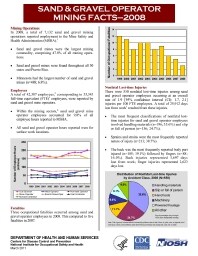
Mining Operations: In 2008, a total of 7,132 sand and gravel mining operations reported employment to the Mine Safety and Health Administration (MSHA). 1. Sand and gravel mines were the largest mining commodity, comprising 47.8% of all mining operations. 2. Sand and gravel mines were found throughout all 50 states and Puerto Rico. 3. Minnesota had the largest number of sand and gravel mines (n=488; 6.8%). Employees: A total of 42,307 employees, corresponding to 33,343 full-time equivalent (FTE) employees, were reported by sand and gravel mine operators. 1. Within the mining sectors, sand and gravel mine operator employees accounted for 9.8% of all employee hours reported to MSHA. 2. All sand and gravel operator hours reported were for surface work locations. Fatalities: Three occupational fatalities occurred among sand and gravel operator employees in 2008. This compared to five fatalities in 2007. Nonfatal Lost-time Injuries: There were 550 nonfatal lost-time injuries among sand and gravel operator employees occurring at an overall rate of 1.9 [95% confidence interval (CI): 1.7, 2.1] injuries per 100 FTE employees. A total of 25,912 days lost from work' resulted from these injuries. 1. The most frequent classifications of nonfatal lost-time injuries for sand and gravel operator employees involved handling materials (n=196; 35.6%) and slip or fall of person (n= 136; 24.7%). 2. Sprains and strains were the most frequently reported nature of injury (n=213; 38.7%). 3. The back was the most frequently reported body part injured (n=105; 19.1%) followed by fingers (n=88; 16.0%). Back injuries represented 3,697 days lost from work; finger injuries represented 2,623 days lost.
NIOSHTIC2 Number: 20039163
Pittsburgh, PA: U. S. Department of Health and Human Services, Public Health Service, Centers for Disease Control and Prevention, National Institute for Occupational Safety and Health, DHHS (NIOSH) Publication No. 2011-167, 2011 Mar; :1-2
- Coal and metal/nonmetal mining facts - 2008
- Coal and Metal/Nonmetal Mining Facts - 2008 (HTML)
- Coal Contractor Mining Facts - 2001
- Coal Contractor Mining Facts - 2002
- Coal Contractor Mining Facts - 2003
- Coal Contractor Mining Facts - 2004
- Coal Contractor Mining Facts - 2005
- Coal Contractor Mining Facts - 2006
- Mining Fact Sheets
- Rib Falls: A Major Ground Control Issue