Low-fat Milk Consumption Among Children and Adolescents in the United States, 2007–2008
- Key findings
- Introduction
- How frequently do children and adolescents drink milk?
- What type of milk, by fat content, do children and adolescents consume?
- Are there differences by age in low-fat milk consumption?
- Are there differences by race/ethnicity in low-fat milk consumption?
- Are there differences by income in low-fat milk consumption?
- Summary
- Definitions
- Data source and methods
- About the authors
- References
- Suggested citation
NCHS Data Brief No. 75, September 2011
PDF Versionpdf icon (706 KB)
Brian K. Kit, M.D., M.P.H.; Margaret D. Carroll, M.S.P.H.; and Cynthia L. Ogden, Ph.D., M.R.P.
Key findings
Data from the National Health and Nutrition Examination Survey, 2007–2008
- Approximately 20% of children and adolescents reported low-fat milk as the type of milk usually consumed. Two-percent milk was reported as the type of milk usually consumed by 45.4% of children and adolescents.
- Adolescents aged 12–19 years reported low-fat milk as their usual milk type more often than younger children aged 2–5 years.
- Non-Hispanic black and Hispanic children and adolescents reported low-fat milk as their usual milk type less frequently than their non-Hispanic white counterparts.
- Children and adolescents in higher-income categories reported low-fat milk as their usual milk type more frequently than children in lower-income categories.
Introduction
Milk and milk products are recommended in Dietary Guidelines for Americans, 2010 because of their positive contribution to dietary intake of calcium, vitamin D, and other nutrients (1). Milk consumption during childhood is particularly important for achieving optimal lifetime bone health (2,3). To obtain the nutritional benefits of milk while limiting caloric and fat intake, low-fat milk and milk products are recommended by Dietary Guidelines for Americans, 2010 and the American Academy of Pediatrics (4) for all individuals aged 2 years and over. This report presents recent national data on the frequency and type of milk consumed by youth in the United States.
Keywords: nutrition, child health, calcium, National Health and Nutrition Examination Survey
How frequently do children and adolescents drink milk?
During the preceding 30 days, girls reported daily milk consumption less frequently than boys (67.4% compared with 77.7%). Among girls, 7.0% reported never drinking milk and 3.4% of boys reported never drinking milk (Figure 1). Overall, 72.6% of children and adolescents consumed milk daily, 15.6% weekly, 6.5% rarely, and 5.1% never (results not shown).
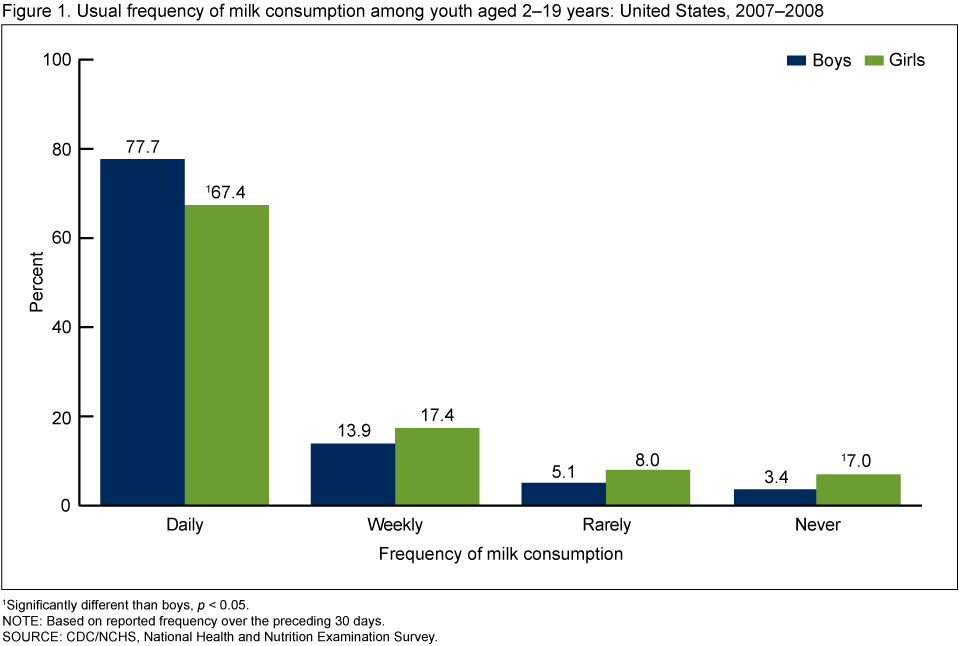 image icon
What type of milk, by fat content, do children and adolescents consume?
Among children who reported milk consumption, 20.2% reported low-fat milk, 45.4% reported two-percent milk, and almost one-third (32.4%) reported whole milk as the type of milk usually consumed (Figure 2). Boys and girls did not differ significantly in low-fat milk consumption (p > 0.05, results not shown).
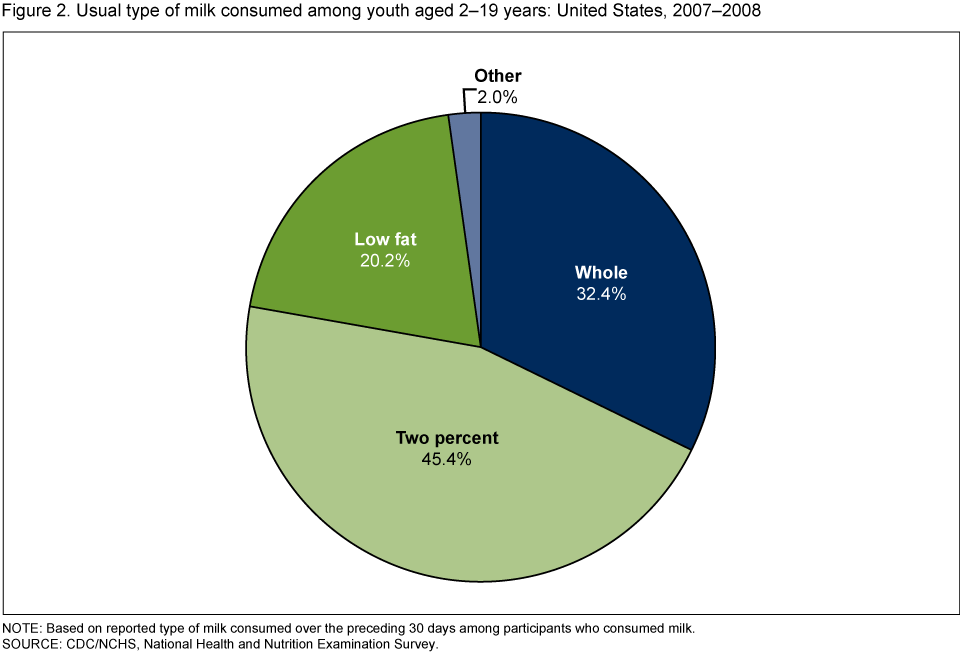 image icon
Are there differences by age in low-fat milk consumption?
Children in older age groups reported consuming low-fat milk more often than children in younger age groups. Among children aged 2–5 years, 13.0% reported usually consuming low-fat milk. Among children aged 6–11 years and adolescents aged 12–19 years, 21.1% and 23.3%, respectively, reported low-fat milk as the usual type of milk consumed (Figure 3).
 image icon
Are there differences by race/ethnicity in low-fat milk consumption?
Non-Hispanic black and Hispanic youth reported low-fat milk as their usual milk type less often than their non-Hispanic white counterparts (Figure 4). Low-fat milk was reported as the usual milk type by approximately 28% of non-Hispanic white children and adolescents. Approximately 5% of non-Hispanic black and 10% of Hispanic children and adolescents reported low-fat milk as their usual type of milk.
 image icon
Are there differences by income in low-fat milk consumption?
Children and adolescents in the highest income category reported low-fat milk as the usual milk type more frequently than those in the lowest income category (Figure 5). For example, among children and adolescents living in households below 130% of the poverty level, less than 10% reported low-fat milk as the usual milk type. Among children and adolescents living in households at or above 350% of the poverty level, 38.1% reported low-fat milk as the usual milk type.
 image icon
Summary
In 2007–2008, among children and adolescents aged 2–19 years, 77.7% of boys and 67.4% of girls reported daily consumption of milk. Fewer than 10% of children and adolescents reported never consuming milk over the preceding 30 days. Among children and adolescents who reported milk consumption, two-percent milk was reported as the usual type of milk consumed more often than other milk types. Only 20.2% of children and adolescents reported consuming low-fat milk as their usual type of milk; low-fat milk consumption was particularly low among non-Hispanic black, Hispanic, and low-income children and adolescents.
The overall low consumption of low-fat milk suggests the majority of children and adolescents do not adhere to recommendations by Dietary Guidelines for Americans, 2010 and the American Academy of Pediatrics for all children aged 2 years and over to drink low-fat milk. Recently, First Lady Michelle Obama’s “Let’s Move!” campaign (5) and “The Surgeon General’s Vision for a Healthy and Fit Nation 2010” (6) have recommended promoting water and low-fat milk and reducing sugar-sweetened beverages as components of comprehensive obesity prevention strategies.
Definitions
Frequency of milk consumption: During an in-home interview, participants were asked, “In the past 30 days, how often did you have milk to drink or on cereal?” Participants were asked to include chocolate and other flavored milks as well as hot cocoa made with milk but not to include milk added to coffee or tea. Frequency of milk consumption was categorized as: daily (once a day or more), weekly (once a week or more but less than once a day), rarely (less than once a week), never, and varied. Fewer than 1% of participants in this analysis reported a frequency of “varied” (results not shown).
Usual type of milk consumed: Participants who reported drinking milk in the preceding 30 days were asked to report the usual type of milk consumed. Responses for milk type were categorized for this analysis into mutually exclusive categories: whole, two percent, low fat (includes one percent and skim/fat free), and other. Approximately 5% of children and adolescents reported more than one milk type. In this report, individuals reporting multiple milk types were classified as consuming milk with the lowest fat content of the milks selected.
Low-fat milk: Includes skim/fat-free and one-percent milk. Milk with two-percent milkfat is reduced-fat, rather than low-fat, milk.
Poverty income ratio (PIR): Refers to the ratio of household income to the poverty threshold after accounting for inflation and family size. In 2008, a PIR of 350% was equivalent to approximately $77,000 for a family of four while a PIR of 130% was equivalent to approximately $29,000 for a family of four. The income eligibility criteria for the Supplemental Nutrition Assistance Program and free school lunches in the National School Lunch Program is a PIR of 130% (7).
Race/ethnicity: Was self- or proxy-reported. For this analysis, race/ethnicity was categorized as non-Hispanic white, non-Hispanic black, Hispanic, and “other,” which includes Asian and multiracial. The “other” category is included in total estimates but results are not separately reported for this group.
Data source and methods
Data from the National Health and Nutrition Examination Survey (NHANES) were used for these analyses. NHANES is a cross-sectional survey designed to monitor the health and nutritional status of the civilian noninstitutionalized U.S. population. The survey consists of interviews conducted in participants’ homes, standardized physical examinations in mobile examination centers, and laboratory tests utilizing blood and urine specimens provided by participants during the physical examination. All data for this report were collected during the in-home interview.
The NHANES sample is selected through a complex, multistage design that includes selection of primary sampling units (counties), household segments within the counties, households within segments, and finally, sample persons from selected households. The sample design includes oversampling to obtain reliable estimates of health and nutritional measures for population subgroups. In 2007–2008, African-American and Hispanic persons were oversampled. In 1999, NHANES became a continuous survey, fielded on an ongoing basis. Each year of data collection is based on a representative sample covering all ages of the civilian noninstitutionalized population. Public-use data files are released in 2-year cycles. Sample weights, which account for the differential probabilities of selection, nonresponse, and noncoverage, were incorporated into the estimation process. The standard errors of the percentages were estimated using Taylor series linearization, a method that incorporates the sample weights and sample design.
Differences between groups were evaluated using a t statistic at the p < 0.05 significance level with the appropriate degrees of freedom. All differences reported are statistically significant unless otherwise indicated. To test for linear trends within age and income groups, the null hypothesis of nonlinear trend was examined using orthogonal polynomials. Statistical analyses were conducted using the SAS System for Windows release 9.2 (SAS Institute, Cary, N.C.) and SUDAAN release 10.0 (Research Triangle Institute, Research Triangle Park, N.C.).
About the authors
Brian K. Kit, Margaret D. Carroll, and Cynthia L. Ogden are with the Centers for Disease Control and Prevention’s National Center for Health Statistics, Division of Health and Nutrition Examination Surveys.
References
- U.S. Department of Agriculture and U.S. Department of Health and Human Services. Dietary guidelines for Americans, 2010. 7th edition. Washington, DC: U.S. Government Printing Office. 2010.
- Greer FR, Krebs NF. Optimizing bone health and calcium intakes of infants, children, and adolescents. Pediatrics 117(2):578–85. 2006.
- Bailey DA, Martin AD, McKay HA, Whiting S, Mirwald R. Calcium accretion in girls and boys during puberty: A longitudinal analysis. J Bone Miner Res 15(11):2245–50. 2000.
- Gidding SS, Dennison BA, Birch LL, Daniels SR, Gillman MW, Lichtenstein AH, et al. Dietary recommendations for children and adolescents: A guide for practitioners. Pediatrics 117(2):544–59. 2006.
- White House Task Force on Childhood Obesity. Solving the problem of childhood obesity within a generationexternal icon. 2010. [Accessed 8/25/11].
- Benjamin RM. The Surgeon General’s vision for a healthy and fit nation. Public Health Rep 125(4):514–5. 2010.
- U.S. Department of Agriculture, Food and Nutrition Service. Child nutrition programs—Income eligibility guidelines pdf icon[PDF – 260 KB]external icon. Fed Regist 74(58):13410–12. 2009.
Suggested citation
Kit BK, Carroll MD, Ogden CL. Low-fat milk consumption among children and adolescents in the United States, 2007–2008. NCHS data brief, no 75. Hyattsville, MD: National Center for Health Statistics. 2011.
Copyright information
All material appearing in this report is in the public domain and may be reproduced or copied without permission; citation as to source, however, is appreciated.
National Center for Health Statistics
Edward J. Sondik, Ph.D., Director
Jennifer H. Madans, Ph.D., Associate Director for Science
Division of Health and Nutrition Examination Surveys
Clifford L. Johnson, M.S.P.H., Director