Prevalence of Complex Activity Limitations Among Racial/Ethnic Groups and Hispanic Subgroups of Adults: United States, 2003–2009
- Key findings
- Does the prevalence of complex activity limitations differ by race/ethnicity among adults?
- Does the prevalence of complex activity limitations differ by Hispanic subgroup among adults?
- Does the prevalence of one or more complex activity limitations differ by race/ethnicity and sex among adults?
- Does the prevalence of one or more complex activity limitations differ by Hispanic subgroup and sex among adults?
- Does the prevalence of one or more complex activity limitations differ by race/ethnicity and age group among adults?
- Does the prevalence of one or more complex activity limitations differ by Hispanic subgroup and age group among adults?
- Summary
- Definitions
- Data sources and methods
- About the authors
- References
- Suggested citation
NCHS Data Brief No. 73, September 2011
PDF Versionpdf icon (713 KB)
Brian W. Ward, Ph.D.; and Jeannine S. Schiller, M.P.H.
Key findings
Data from the National Health Interview Survey, 2003–2009
- Non-Hispanic black adults (17.5%) were the most likely to have one or more complex activity limitations, followed by non-Hispanic white (15.5%) and Hispanic (10.0%) adults.
- Puerto Rican (17.9%) and other Hispanic (15.8%) adults were more likely to have a complex activity limitation than Cuban (12.8%), Mexican (8.9%), and Central or South American (6.2%) adults.
- Among Hispanic, non-Hispanic white, and non-Hispanic black persons, men were less likely than women to have one or more complex activity limitations.
- There was at least a 14 percentage point difference in the prevalence of having a complex activity limitation among adults aged 65–74 compared with those aged 75 and over, for all race/ethnicity categories.
Despite declines in disability in some racial/ethnic groups during the past several decades, disparities among some groups remain (1,2). Given these disparities and the rapid growth of the U.S. Hispanic population (3,4), studying disability within the Hispanic population is important. This brief focuses on one measure of disability—differences in complex activity limitations—among Hispanic, non-Hispanic white, and non-Hispanic black adults and in five Hispanic subgroups. Complex activity limitations, introduced in Disability and Health in the United States, 2001–2005 (5), are limitations in “the tasks and organized activities that, when executed, make up numerous social roles,” such as working and attending school. The three types of complex activity limitations analyzed in this brief are self-care, social, and work limitations.
Keywords: disability, National Health Interview Survey
Does the prevalence of complex activity limitations differ by race/ethnicity among adults?
- Non-Hispanic black adults (17.5%) were the most likely to have one or more complex activity limitations, followed by non-Hispanic white (15.5%) and Hispanic (10.0%) adults (Figure 1).
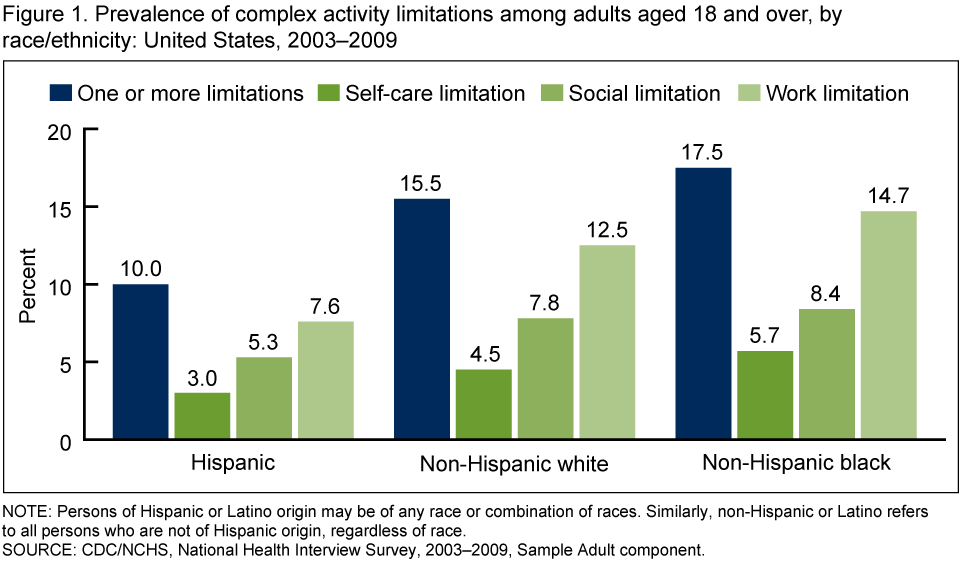 image icon
- Hispanic adults were less likely than non-Hispanic white and non-Hispanic black adults—and non-Hispanic white adults were less likely than non-Hispanic black adults—to have each type of complex activity limitation.
- For each race/ethnicity, work limitations were the most prevalent type of complex activity limitation, followed by social limitations and self-care limitations.
Does the prevalence of complex activity limitations differ by Hispanic subgroup among adults?
- Puerto Rican (17.9%) and other Hispanic (15.8%) adults were more likely to have one or more complex activity limitations than Cuban (12.8%), Mexican (8.9%), and Central or South American (6.2%) adults (Figure 2).
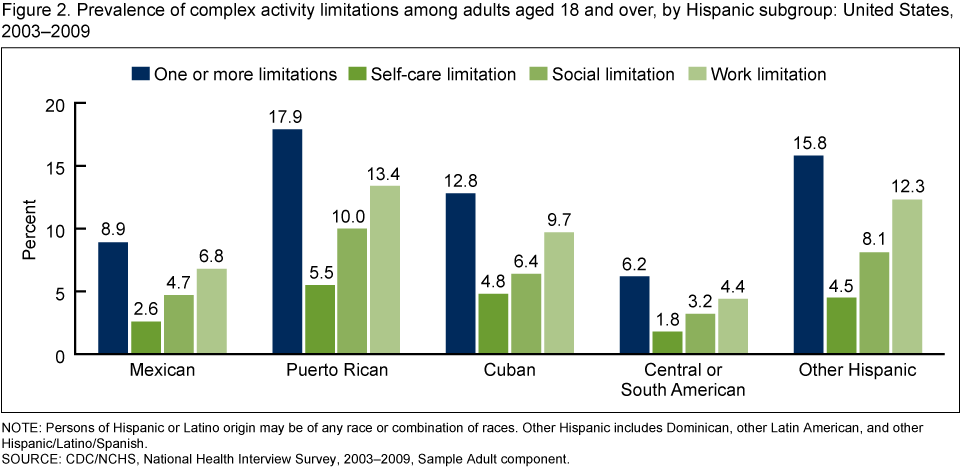 image icon
- Puerto Rican adults were more likely to have a social limitation and more likely to have a work limitation than Mexican, Cuban, and Central or South American adults. Other Hispanic adults were more likely to have a social limitation and more likely to have a work limitation than Mexican and Central or South American adults and more likely to have a work limitation than Cuban adults.
- Puerto Rican (5.5%), Cuban (4.8%), and other Hispanic (4.5%) adults were more likely to have a self-care limitation than Mexican (2.6%) and Central or South American (1.8%) adults.
- Among all five Hispanic subgroups, work limitations were more prevalent than self-care and social limitations.
Does the prevalence of one or more complex activity limitations differ by race/ethnicity and sex among adults?
- Among Hispanic, non-Hispanic white, and non-Hispanic black adults, men were less likely than women to have one or more complex activity limitations (Figure 3).
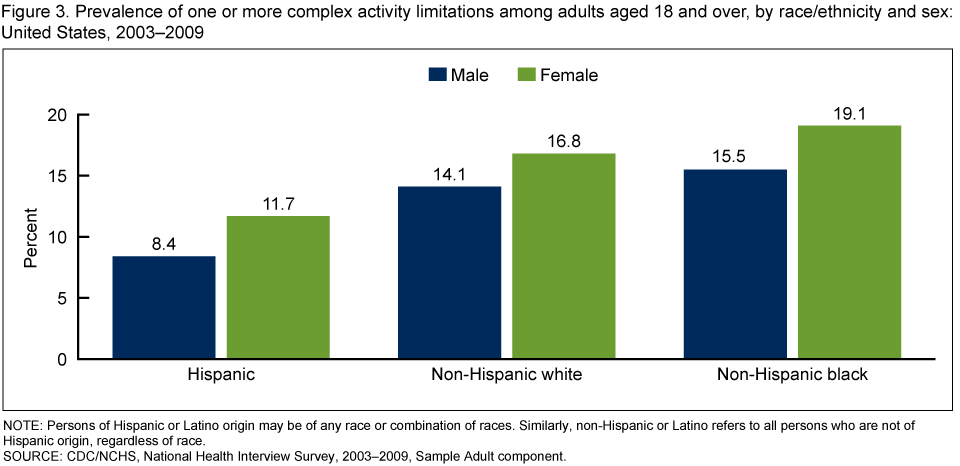 image icon
- Among men, non-Hispanic black adults (15.5%) were the most likely to have a complex activity limitation, followed by non-Hispanic white (14.1%) and Hispanic (8.4%) adults.
- Among women, non-Hispanic black adults (19.1%) were more likely to have a complex activity limitation than non-Hispanic white (16.8%) and Hispanic (11.7%) adults.
Does the prevalence of one or more complex activity limitations differ by Hispanic subgroup and sex among adults?
- Among Mexican (7.3%) and Central or South American (5.0%) adults, men were less likely to have one or more complex activity limitations than women. Differences by sex for the other Hispanic subgroups were not statistically significant (Figure 4).
- Among both men and women, Central or South American adults were least likely to have a complex activity limitation; Puerto Rican adults were more likely to have a complex activity limitation than Mexican, Cuban, and Central or South American adults; and Cuban and other Hispanic adults were more likely to have a complex activity limitation than Mexican and Central or South American adults.
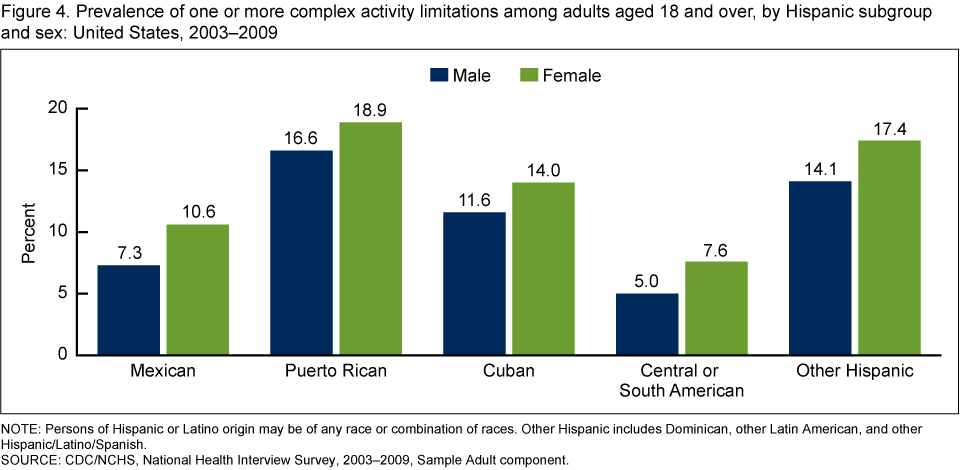 image icon
Does the prevalence of one or more complex activity limitations differ by race/ethnicity and age group among adults?
- As age increases, so do the percentages of Hispanic, non-Hispanic white, and non-Hispanic black adults who have one or more complex activity limitations (Figure 5).
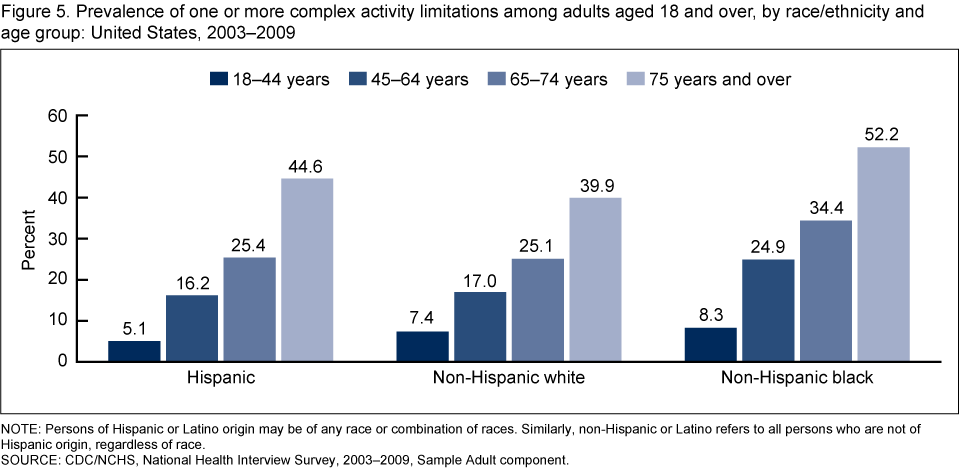 image icon
- For all age groups, non-Hispanic black adults were more likely than Hispanic and non-Hispanic white adults to have a complex activity limitation.
- Hispanic adults aged 18–44 (5.1%) were less likely to have a complex activity limitation than non-Hispanic white (7.4%) and non-Hispanic black adults (8.3%) in that age group; however, Hispanic adults aged 75 and over (44.6%) were more likely to have a complex activity limitation than non-Hispanic white adults (39.9%) in the same age group.
- There was at least a 14 percentage point difference in the prevalence of having a complex activity limitation among adults aged 65–74 compared with those aged 75 years and over, for all race/ethnicity categories.
Does the prevalence of one or more complex activity limitations differ by Hispanic subgroup and age group among adults?
- For each of the five Hispanic subgroups, as age increased so did the percentage of adults who had one or more complex activity limitations (Figure 6).
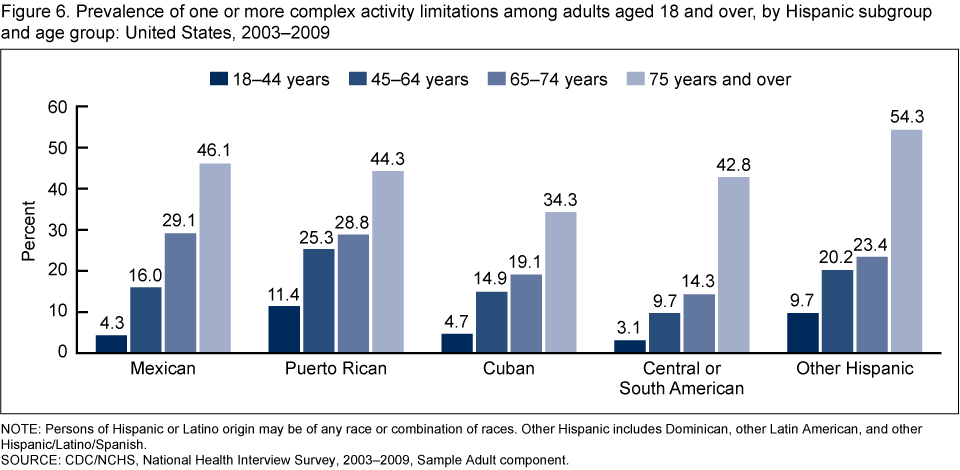 image icon
- There was at least a 15 percentage point difference in the prevalence of having a complex activity limitation among adults aged 65–74 compared with those aged 75 years and over, for all Hispanic subgroups.
- Among adults aged 45–64, Puerto Rican adults were the most likely (25.3%) and Central or South American adults the least likely (9.7%) to have a complex activity limitation.
- Among adults aged 65–74, Mexican (29.1%) and Puerto Rican (28.8%) adults were the most likely and Central or South American adults (14.3%) the least likely to have a complex activity limitation.
- Among adults aged 75 and over, other Hispanic adults were the most likely (54.3%) and Cuban adults the least likely (34.3%) to have a complex activity limitation.
Summary
This brief has shown that racial and ethnic differences exist in the prevalence of complex activity limitations among adults. Further, within the U.S. Hispanic adult population, a number of significant differences were found in complex activity limitations among Mexican, Puerto Rican, Cuban, Central or South American, and other Hispanic adults—differences that would likely go unnoticed if the Hispanic population were treated as a single group. These disparities in the prevalence of complex activity limitations are further influenced by sex and age.
Definitions
Complex activity limitation: A limitation in an activity that “consists of the tasks and organized activities that, when executed, make up numerous social roles,” such as working and attending school (5). The three types of complex activity limitations examined in this brief are self-care activity limitations, social activity limitations, and work activity limitations.
- Self-care activity limitation: An activity limitation based on whether a person has difficulty with any activities of daily living (ADLs) or instrumental activities of daily living (IADLs) (5). For ADLs, respondents to the National Health Interview Survey (NHIS) are asked whether they or family members aged 3 years and over need the help of another person with personal care because of a physical, mental, or emotional problem. For IADLs, respondents are asked whether they or family members aged 18 and over need the help of another person for handling routine IADL needs because of a physical, mental, or emotional problem. People are considered to have an ADL or IADL limitation if they respond affirmatively to any of the ADL or IADL questions (5).
-
Social activity limitation: Identified on the basis of three NHIS questions:
“By yourself, and without using any special equipment, how difficult is it for you to
– Go out to things like shopping, movies, or sporting events?
– Participate in social activities such as visiting friends, attending clubs and meetings, going to parties?
– Do things to relax at home or for leisure (reading, watching TV, sewing, listening to music)?”Social activity limitation is defined as a response of “somewhat difficult,” “very difficult,” or “cannot do at all” for any of the three questions. Respondents who did not do the activity, refused to answer, or didn’t know were treated as missing data in the analyses (5).
-
Work activity limitation: Indicated as either a respondent-defined limitation in the kind or amount of work the person in question can do, or as a complete inability to work. Identified on the basis of two NHIS questions:
“Does a physical, mental, or emotional problem NOW keep {you/anyone in the family (age 18+)} from working at a job or business?”
If not “yes”:
“{Are/any of these family members} limited in the kind OR amount of work {you/they} can do because of a physical, mental or emotional problem?”
A positive answer to either question identifies the person as having a work activity limitation (5).
Data sources and methods
Data from the 2003–2009 NHIS were used in this analysis. NHIS data are collected continuously throughout the year for the Centers for Disease Control and Prevention’s (CDC) National Center for Health Statistics (NCHS). NHIS collects information about the health and health care of the civilian noninstitutionalized U.S. population. Interviews are conducted in respondents’ homes, but follow-ups to complete interviews may be conducted over the telephone. The Family Core component collects information on all family members; the Sample Adult Core component collects additional data on a randomly selected adult (the “Sample Adult”); and the Sample Child Core component collects additional data about a randomly selected child (the “Sample Child”).
Questions used to create the self-care and work limitation measures, and questions asking about family members’ sex, age, and race/ethnicity, are asked of a family respondent in the Family Core component of the survey. Other questions used to create the social limitation measure are from the Sample Adult component. In 2003–2009, information was collected on a total of 629,039 persons in the Family Core component and 190,786 persons in the Sample Adult component of the survey. There were 33,762 Hispanic, 118,005 non-Hispanic white, and 27,904 non-Hispanic black adults in the Sample Adult files. Among the Hispanic adults in the Sample Adult files, there were 20,899 Mexican, 3,393 Puerto Rican, 1,741 Cuban, 5,072 Central or South American, and 2,657 other Hispanic adults. For further information about NHIS, and to view the survey questionnaire, visit the NHIS website.
NHIS is designed to yield a sample that is representative of the civilian noninstitutionalized population of the United States, and the analysis in this brief uses weights to produce national estimates. Data weighting procedures are described in more detail elsewhere (6). Point estimates, and estimates of their variances, were calculated using SUDAAN software (7) to account for the complex sampling design of NHIS. The Taylor series linearization method was chosen for variance estimation. All estimates shown meet the NCHS standard of reliability (relative standard error less than or equal to 30%). Differences between percentages were evaluated using two-sided significance tests at the 0.05 level. Terms such as “higher than” and “less than” indicate statistically significant differences. Terms such as “similar” and “no difference” indicate that the statistics being compared were not significantly different. Lack of comment regarding the difference between any two statistics does not necessarily suggest that the difference was tested and found not to be significant.
About the authors
Brian Ward and Jeannine Schiller are with the Centers for Disease Control and Prevention’s National Center for Health Statistics, Division of Health Interview Statistics.
References
- Schoeni RF, Martin LG, Andreski PM, Freedman VA. Persistent and growing socioeconomic disparities in disability among the elderly: 1982–2002. Am J Public Health 95(11):2065–70. 2005.
- Waidmann TA, Liu K. Disability trends among elderly persons and implications for the future. J Gerontol B Psychol Sci Soc Sci 55(5):S298–307. 2000.
- CDC. Public health and aging: Trends in aging—United States and worldwide. MMWR 52(6):101–6. 2003.
- Dunlop DD, Song J, Manheim LM, Davigius ML, Chang RW. Racial/ethnic differences in the development of disability among older adults. Am J Public Health 97(12):2209–15. 2007.
- Altman B, Bernstein A. Disability and health in the United States, 2001–2005 pdf icon[PDF -830 KB]. Hyattsville, MD: National Center for Health Statistics. 2008.
- Botman SL, Moore TF, Moriarity CL, Parsons VL. Design and estimation for the National Health Interview Survey, 1995–2004 pdf icon[PDF -300 KB]. National Center for Health Statistics. Vital Health Stat 2(130). 2000.
- SUDAAN, release 10.0.1 [computer software]. Research Triangle Park, NC: RTI International. 2009.
Suggested citation
Ward BW, Schiller JS. Prevalence of complex activity limitations among racial/ethnic groups and Hispanic subgroups of adults: United States, 2003-2009. NCHS data brief, no. 73. Hyattsville, MD: National Center for Health Statistics. 2011.
Copyright information
All material appearing in this report is in the public domain and may be reproduced or copied without permission; citation as to source, however, is appreciated.
National Center for Health Statistics
Edward J. Sondik, Ph.D., Director
Jennifer H. Madans, Ph.D., Associate Director for Science
Division of Health Interview Statistics
Jane F. Gentleman, Ph.D., Director