Community Health Centers: Providers, Patients, and Content of Care
NCHS Data Brief No. 65, July 2011
PDF Versionpdf icon (550 KB)
Esther Hing, M.P.H.; and Roderick S. Hooker, Ph.D.
Key findings
Data from the National Ambulatory Medical Care Survey, 2006–2008
- In 2006–2008, the majority of community health center (CHC) visits were made by Medicaid-insured or uninsured patients.
- Physicians delivered care at 69% of CHC visits, nurse practitioners (NPs) at 21% of visits, physician assistants (PAs) at 9% of visits, and certified nurse midwives (CNMs) at 1% of visits.
- NPs and CNMs saw a higher percentage of female patients aged 18–44 than did physicians or PAs. Physicians were more likely than NPs to see patients aged 45 and over, both male and female. PAs were more likely than NPs to see males aged 45 and over.
- A higher percentage of NP and PA visits included health education and counseling services than did physician visits. A lower percentage of CNM visits included prescribed medications or immunizations.
For more than 40 years, community health centers (CHCs) have provided primary care and behavioral and mental health services in medically underserved communities, regardless of a patient’s ability to pay (1). In 2001, the government launched the Federal Health Center Growth Initiative, providing funds over 5 years to increase by 60% the number of patients served in 1,200 communities. As the number of CHCs has expanded, demand for both physician and nonphysician practitioner services has increased (2). This report compares patient and encounter characteristics across the different types of providers seen at CHC visits during a 3-year period, 2006–2008.
Keywords: physician assistants, nurse practitioners, nurse midwives
Who visits CHCs?
- During 2006–2008, CHCs averaged 31.1 million visits annually (3,4). The majority of visits to CHCs (55%) were made by patients who were poor or publicly insured [41% Medicaid or State Children’s Health Insurance Program (SCHIP) and 14% uninsured] and by patients under age 45 (64%) (Figure 1). About one-third of CHC visits (32%) were by patients of black or other minority racial groups, and one-third (33%) were by Hispanic or Latino patients.
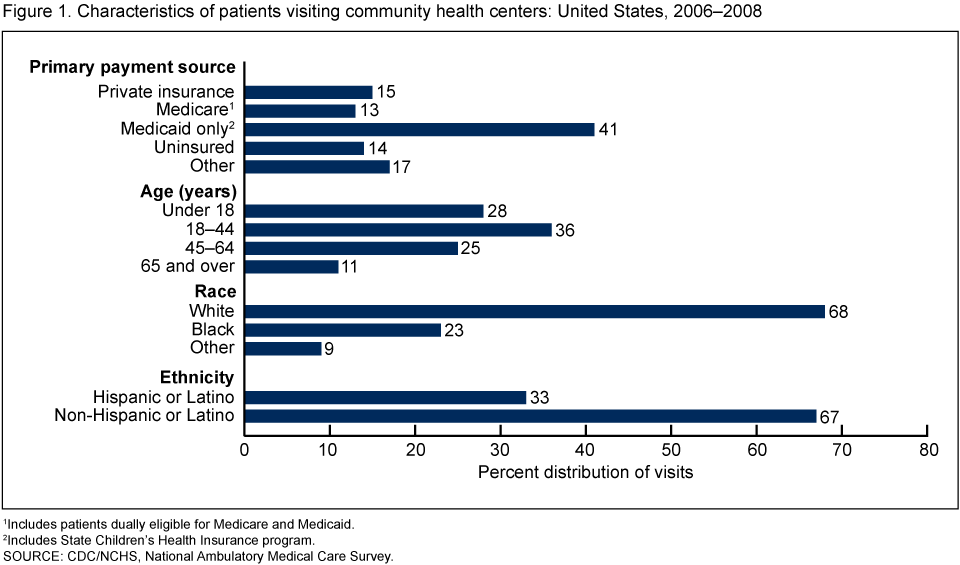 image icon
- Comparable percentages of visits to office-based physicians with the same visit characteristics were significantly lower: 14% of visits to office-based physicians were made by Medicaid and SCHIP (10%) or uninsured (4%) patients, 45% by patients under age 45, 16% by patients of black or other minority racial groups, and 12% by Hispanic or Latino patients (data not shown).
Who provides care at CHC visits, and who visits these providers?
- During 2006–2008, 69% of CHC visits were to physicians, 21% to NPs, 9% to PAs, and 1% to CNMs (Table 1). Only 3% of visits involved both a physician and a nonphysician practitioner (data not shown).
- NPs (36%) and CNMs (87%) saw a higher percentage of female patients aged 18–44 than did physicians (25%) or PAs (22%).
- Physicians were more likely than NPs to see patients aged 45 and over, both male and female. PAs were more likely to see males aged 45 and over (19%) than were NPs (8%).
- A lower percentage of patients with one or more chronic conditions visited NPs (39%) than visited physicians (52%)and PAs (58%), largely because of the younger ages of patients seen by NPs.
- Physicians (72%) and PAs (72%) served as the patient’s primary care provider more frequently than NPs (58%).
Table 1. Percent distribuion of community health center visits, by provider type: United States, 2006-2008
| Selected characteristic | Physician | Physician assistant | Nurse practitioner | Nurse midwife |
|---|---|---|---|---|
| Total | 100 | 100 | 100 | 100 |
| Sex and age (years): | ||||
| Female, under 18 | 14 | 12 | 18 | 7 |
| Female, 18-441–3 | 25 | 22 | 36 | 87 |
| Female, 45 and over2 | 24 | 25 | 17 | * |
| Male, under 18 | 14 | 11 | 13 | * |
| Male, 18-44 | 9 | 12 | 8 | |
| Male, 45 and over2,3 | 15 | 19 | 8 | – |
| One or more chronic conditions reported2,3 | 52 | 58 | 39 | *18 |
| Serves as patient’s primary care provider2,3 | 72 | 72 | 58 | *42 |
* Estimate does not meet standards of reliability or precision.
– Quantity zero.
1 Differences between nurse midwife and physician, physician assistant, and nurse practitioner are statistically significant.
2 Difference between nurse practitoner and physician is statistically significant.
3 Differences between nurse practitioner and physician, and between nurse practitioner and physician assistant, are statistically significant.
NOTES: Overall, 69% of visits were to physicians, 21% to nurse practitioners, 9% to physician assistants, and 1% to nurse midwives. Percentages may not add to 100 because of rounding.
SOURCE: CDC/NCHS, National Ambulatory Medical Care Survey.
Why do patients visit different types of providers?
- As assessed by the health care provider, 37% of CHC visits were for a new problem, 29% were for a chronic problem, 31% were for preventive care, and 3% were for other reasons.
- PAs treated a higher percentage of new problems (45%) than did physicians (36%) (Figure 2).
- Physicians (31%) and PAs (36%) had a higher percentage of visits for chronic conditions than did NPs (21%).
- The vast majority of visits to CNMs (82%) were for preventive care. A much lower percentage of visits to physicians (30%), PAs (17%), and NPs (38%) were for preventive care.
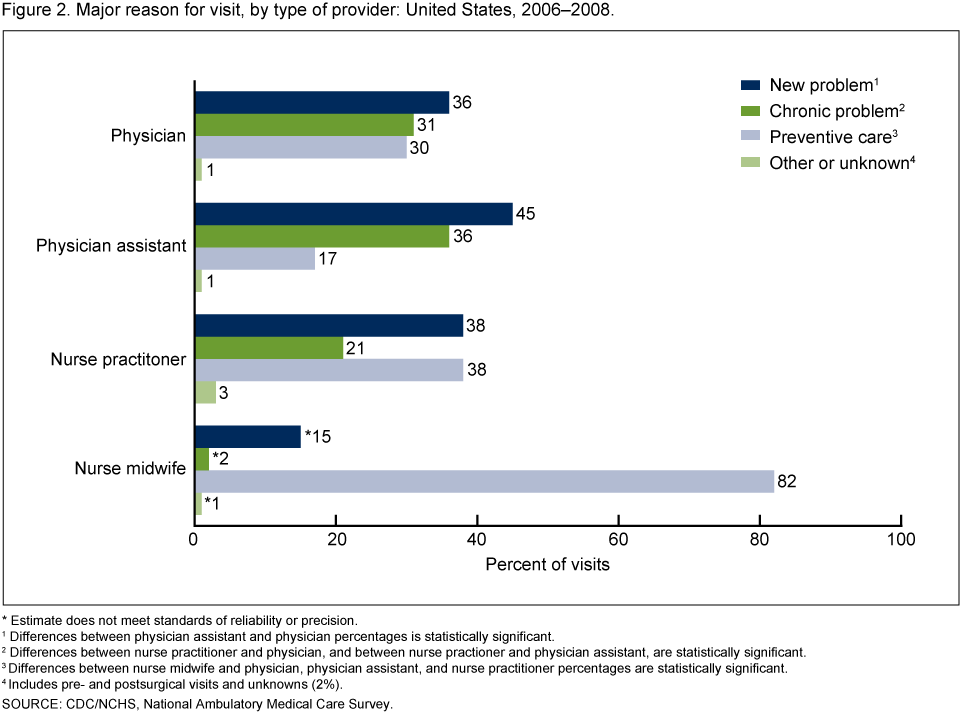 image icon
Do different types of providers deliver different services?
- A higher percentage of visits to NPs (53%) and PAs (54%) included documentation of health education or counseling services in the medical record, compared with visits to physicians (42%) (Table 2).
- There were no differences among physicians, NPs, and PAs in the percentages of visits in which drugs or immunizations were prescribed or continued, or laboratory or other types of tests were ordered or administered.
- The percentage of visits to CNMs in which laboratory and other types of tests were ordered or administered (59%) was higher than the comparable percentage for physicians (46%).
- The percentage of visits to CNMs in which drugs or immunizations were prescribed (58%) was lower than comparable percentages among physicians (79%), NPs (72%), and PAs (82%).
Table 2. Visits with selected services ordered or provided, by provider type: United States, 2006-2008
| Selected service ordered or provided | Physician | Physician assistant | Nurse practitioner | Nurse midwife |
|---|---|---|---|---|
| Percent | ||||
| Drug or immunization mentioned1 | 79 | 82 | 72 | 58 |
| Laboratory and other tests2,3 | 46 | 49 | 47 | 59 |
| Health education service4,5 | 42 | 54 | 53 | 43 |
| Any imaging | 9 | *11 | 8 | *19 |
| Nonmedication treatment6 | 10 | 15 | 10 | *3 |
* Estimate does not meet standards of reliability or precision.
1 Differences between nurse midwife and physician, and physician assistant, are statistically significant.
2 Laboratory and other tests include scope procedures, biopsy, EKG/ECG, spirometry/pulmonary function test, and other services.
3 Difference between nurse midwife and physician is statistically significant.
4 Differences between nurse practitioner and physician, and between physician assistant and physician, are statistically significant.
5 Health education services include education about asthma, diet and nutrition, exercise, growth and development, injury prevention, stress management, tobacco use and exposure, weight reduction, and other education.
6 Nonmedication treatment includes complementary and alternative medicine, durable medical equipment, home health care, hospice care, physical therapy, radiation therapy, speech and occupational therapy, psychotherapy, other mental health counseling, excision of tissue, orthopedic care, wound care, other nonsurgical procedures, and other surgical procedures.
SOURCE: CDC/NCHS, National Ambulatory Medical Care Survey.
Summary
This report has presented 2006–2008 National Ambulatory Medical Care Survey (NAMCS) estimates of visits to CHC practitioners. During this time period, a sizeable portion of visits (31%) were to PAs, NPs, and CNMs. Within CHCs, NPs and CNMs disproportionately served young women compared with patients served by physicians, a finding consistent with other national studies (5). The vast majority of visits to CNMs were for preventive care. PAs had the highest percentage of visits for new problems. The larger percentage of visits to physicians and PAs by patients for a chronic condition, compared with visits to NPs, is largely attributable to the younger age of patients seen by NPs. There were no significant differences in types of services provided by physicians, NPs, and PAs, with one exception: PAs and NPs were more likely than physicians to provide or document health education or counseling services at visits.
CHCs serve predominantly low-income patients who are uninsured or who rely on public insurance (6). The significance of CHCs as sources of care for the uninsured and underinsured has grown as a result of recent Federally Qualified Health Center (FQHC) expansions and a worsening economy (6-10). In 2008, visits to CHCs accounted for 14% of all visits to primary care delivery sites by patients with Medicaid or SCHIP as a primary expected source of payment, and 12% of visits by uninsured patients (6). Primary care is recognized as an important strategy for maintaining population health because it is relatively inexpensive, can be more easily delivered than specialty and inpatient care, and if properly distributed could be effective in preventing disease progression on a large scale (11). The present report has documented the roles of nonphysician practitioners in CHCs across the nation from 2006 through 2008. PAs, NPs, and CNMs have partnered with physicians and nurses to provide care to a wide spectrum of communities (12,13). The roles of nonphysician practitioners in CHCs are expected to increase as a result of expanded funding for CHC infrastructure included in the American Recovery and Reinvestment Act of 2009 (14) and additional funding for CHC expansion and health insurance coverage for the uninsured included in the Patient Protection and Affordable Care Act of 2010 (15). Monitoring CHC utilization and staffing may provide insight into the changing nature of the U.S. health care system.
Definitions
Community Health Center (CHC): An outpatient clinic that serves medically underserved populations (e.g., migrant and seasonal agricultural workers, the homeless, and public housing residents) (1). CHCs represented in NAMCS include FQHC clinics that receive Section 330 grants under the Public Health Service Act, “look-alike” health centers that meet FQHC requirements, and federally qualified urban Indian Health Service clinics (1).
Health education services: Include education about asthma, diet and nutrition, exercise, growth and development, injury prevention, stress management, tobacco use and exposure, weight reduction, and related topics.
Major reason for visit: The primary reason for the visit as assessed by the health care provider. “New problem” visits are for conditions with onset of less than 3 months. “Chronic problem” visits include routine and flare-up visits. “Preventive care” includes visits for routine prenatal and well-baby care, screening, and insurance and general exams.
Nonmedication treatment: Includes complementary and alternative medicine, durable medical equipment, home health care, hospice care, physical therapy, radiation therapy, speech and occupational therapy, psychotherapy, other mental health counseling, excision of tissue, orthopedic care, wound care, other nonsurgical procedures, and other surgical procedures.
Data sources and methods
All estimates are from NAMCS—an annual nationally representative survey of visits to nonfederal office-based physicians in the United States, conducted by the Centers for Disease Control and Prevention’s (CDC) National Center for Health Statistics (NCHS). NAMCS uses a multistage probability sample design involving geographic primary sampling units (PSUs), physician practices within PSUs, and patient visits within physician practices. Sampled physicians were selected from the masterfiles of the American Medical Association and the American Osteopathic Association. Starting in 2006, NAMCS included an additional stratum of 104 CHCs in the sample.
The 2006–2008 NAMCS samples included 312 CHCs within PSUs. Within CHCs, a sample of up to three CHC providers (physicians, PAs, NPs, or CNMs) scheduled to see patients during the sample week was selected, and a random sample of visits during an assigned week was selected for each CHC provider. Among in-scope and eligible CHCs, the overall unweighted four-stage sampling response rate was 85.5% (86.3%, weighted). Participating CHCs completed a total of 17,128 patient record forms.
Weights that take into account all sample stages, with adjustments for nonresponse, were used to produce average annual national estimates of physician and nonphysician clinician office visits. Differences in visit characteristics for nonphysician clinicians and for physicians were analyzed using Chi-square tests at the p = 0.05 level. To account for the complex sample design during variance estimation, all analyses were performed using the SUDAAN software package, version 9.0 (RTI International, Research Triangle Park, NC).
The weighted percentage of missing data observed in the data was as follows: patient age and sex (less than 5%), race (24%), and ethnicity (20%). These data were imputed (3), but the potential for bias increases as the amount of missing data increases. Therefore, the race and ethnicity data should be interpreted with caution. As noted in Figure 2, 2% of data were missing for “major reason for visit” and were included with pre- and postsurgical visits.
About the authors
Esther Hing is with the Centers for Disease Control and Prevention’s National Center for Health Statistics, Division of Health Care Statistics. Roderick S. Hooker is with The Lewin Group.
References
- Taylor J. The fundamentals of community health centers pdf icon[PDF – 221 KB]external icon. National Health Policy Forum background paper. Washington, DC: The George Washington University. 2004.
- Rosenblatt RA, Andrilla CH, Curtin T, Hart LG. Shortages of medical personnel at community health centers: Implications for planned expansion. JAMA 295(9):1042–9. 2006.
- National Center for Health Statistics. Community health center nonphysician practitioner data from the 2006–2008 National Ambulatory Medical Care Survey. Public-use data file documentation. Hyattsville, MD: National Center for Health Statistics. Forthcoming.
- National Center for Health Statistics. National Ambulatory Medical Care Survey, 2006, 2007, and 2008. Public-use data file documentation. Hyattsville, MD: National Center for Health Statistics.
- Druss BG, Marcus SC, Olfson M, Tanielian T, Pincus HA. Trends in care by nonphysician clinicians in the United States. N Engl J Med 348(2):130–7. 2003.
- Hing E, Uddin S. Visits to primary care delivery sites: United States, 2008. NCHS data brief, no 47. Hyattsville, MD: National Center for Health Statistics. 2010.
- O’Malley AS, Forrest CB, Politzer RM, Wulu JT, Shi L. Health center trends, 1994–2001: What do they portend for the Federal Growth Initiative? Health Aff (Millwood) 24(2):465–72. 2005.
- Inglehart JK. Spreading the safety net—Obstacles to the expansion of community health centers. N Engl J Med 358(13):1321–3. 2008.
- Lo Sasso AT, Byck GR. Funding growth drives community health center services. Health Aff (Millwood) 29(2):289–96. 2010.
- Hurley R, Fellan L, Lauer J. Community health centers tackle rising demands and expectations. Issue Brief Cent Stud Health Syst Change (116):1–4. 2007.
- Starfield B, Shi L, Macinko J. Contribution of primary care to health systems and health. Milbank Q 83(3):457–502. 2005.
- Hing E, Hooker RS, Ashman JJ. Primary health care in community health centers and comparison with office-based practice. J Community Health 36(3):406–13. 2011.
- Hooker RS, McCaig LF. Use of physician assistants and nurse practitioners in primary care, 1995–1999. Health Aff (Millwood) 20(4):231–8. 2001.
- American Recovery and Reinvestment Act of 2009 (ARRA): Summary of major health care provisions [online]external icon. American Medical Association. 2009.
- Community health centers: Opportunities and challenges of health reform pdf icon[PDF – 844 KB]external icon. Issue paper. Kaiser Commission on Medicaid and the Uninsured [PDF – 844 KB]. 2010.
Suggested citation
Hing E, Hooker RS. Community health centers: Providers, patients, and content of care. NCHS data brief, no 65. Hyattsville, MD: National Center for Health Statistics. 2011.
Copyright information
All material appearing in this report is in the public domain and may be reproduced or copied without permission; citation as to source, however, is appreciated.
National Center for Health Statistics
Edward J. Sondik, Ph.D., Director
Jennifer H. Madans, Ph.D., Associate Director for Science
Division of Health Care Statistics
Jane E. Sisk, Ph.D., Director