Trends in Intake of Energy and Macronutrients in Adults From 1999-2000 Through 2007-2008
- Key findings
- What is the average energy intake for men and women?
- What are the average macronutrient intakes for men and women?
- Were there any increases or decreases in carbohydrate intake in the population over the 10 years studied?
- Were there any increases or decreases in protein intake in the population over the 10 years studied?
- Were there any increases or decreases in intake of total fat in the population over the 10 years studied?
- Were there any increases or decreases in intake of saturated fat in the population over the 10 years studied?
- Were there differences in nutrient intake between sex and race-ethnicity groups examined here that persisted across each of the five 2-year survey periods in the 10 years studied?
- Summary
- Definitions
- Data source and methods
- About the authors
- References
- Suggested citation
NCHS Data Brief No. 49, November 2010
PDF Versionpdf icon (592 KB)
Jacqueline D. Wright, Dr.P.H., and Chia-Yih Wang, Ph.D.
Key findings
- In 2007-2008 the average energy intake for men was 2,504 kilocalories (kcals) and for women it was 1,771 kcals.
- The average carbohydrate intake was 47.9% of total kilocalories (% kcals) for men and 50.5% kcals for women; average protein intake was 15.9% kcals for men and 15.5% kcals for women; average total fat intake was 33.6% kcals for men and 33.5% kcals for women; and average saturated fat intake was 11.0% kcals for men and 11.1% kcals for women.
- Energy intake appeared relatively stable over the 10-year period from 1999-2008; there were no statistically significant linear increases or decreases in total energy intake.
- There were statistically significant trends in intake of the macronutrients: average carbohydrate intake decreased and average protein intake increased in both men and women.
The Surgeon General’s recent call for renewed efforts to address the high prevalence of obesity in the U.S. adult population highlights the need for better understanding of trends in consumption of energy and the macronutrients protein, carbohydrate, and fat (1). The National Health and Nutrition Examination Survey (NHANES) is the primary national data system that provides information to monitor the nutritional status of the U.S. population. A previous study using NHANES data to report on trends in intake of energy and macronutrients from 1971-1974 through 1999-2000 showed statistically significant increases in intake of energy and carbohydrate, and a decrease in intake of fat in men and women (2). The objectives of this report are to present current estimates of intake of energy and intake of protein, carbohydrate, total fat, and saturated fat, and to evaluate trends in intake of these nutrients over the past decade.
Keywords: nutrition surveys, caloric intake, diet, nutrients
What is the average energy intake for men and women?
In 2007-2008 the average energy intake for men was 2,504 kcals and for women it was 1,771 kcals (Figure 1).
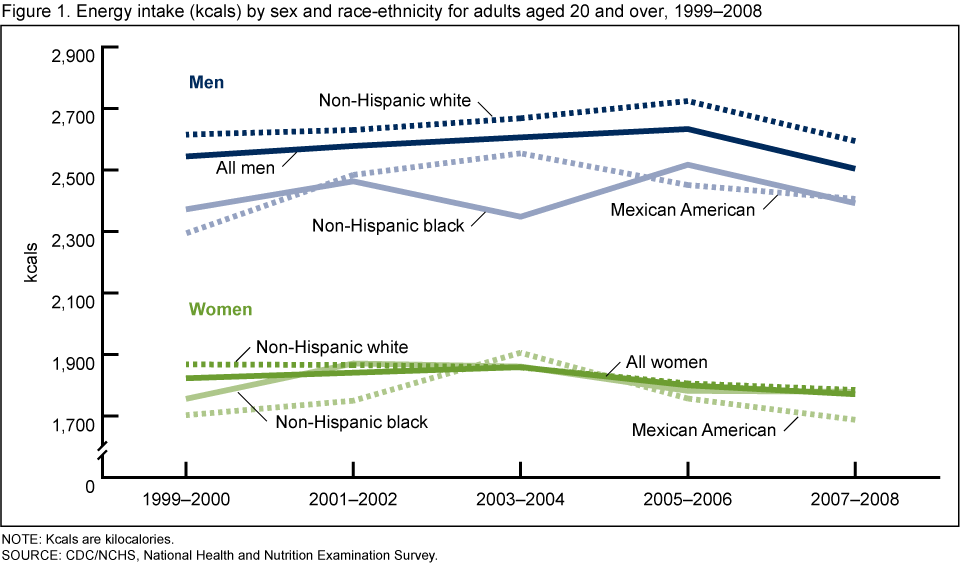 image icon
There were no statistically significant linear increases or decreases in total energy intake from 1999-2000 through 2007-2008. In 2007-2008, non-Hispanic white men had higher energy intakes than non-Hispanic black or Mexican-American men; however, these differences were not consistently significant across all earlier survey periods. No other differences were observed among other sex and race-ethnicity groups in 2007-2008.
What are the average macronutrient intakes for men and women?
In this report, intake of macronutrients is expressed as percent of total energy (% kcals). For 2007-2008, the average carbohydrate intake was 47.9% kcals for men and 50.5% kcals for women; average protein intake was 15.9% kcals for men and 15.5% kcals for women; average total fat intake was 33.6% kcals for men and 33.5% kcals for women; and average saturated fat intake was 11.0% kcals for men and 11.1% kcals for women (Figure 2).
 image icon
Were there any increases or decreases in carbohydrate intake in the population over the 10 years studied?
There was a decrease in carbohydrate intake in both men and women (Figure 2). There were trends in specific subgroups, including a decrease in carbohydrate intake in non-Hispanic white and black men and in non-Hispanic white women (Figure 3).
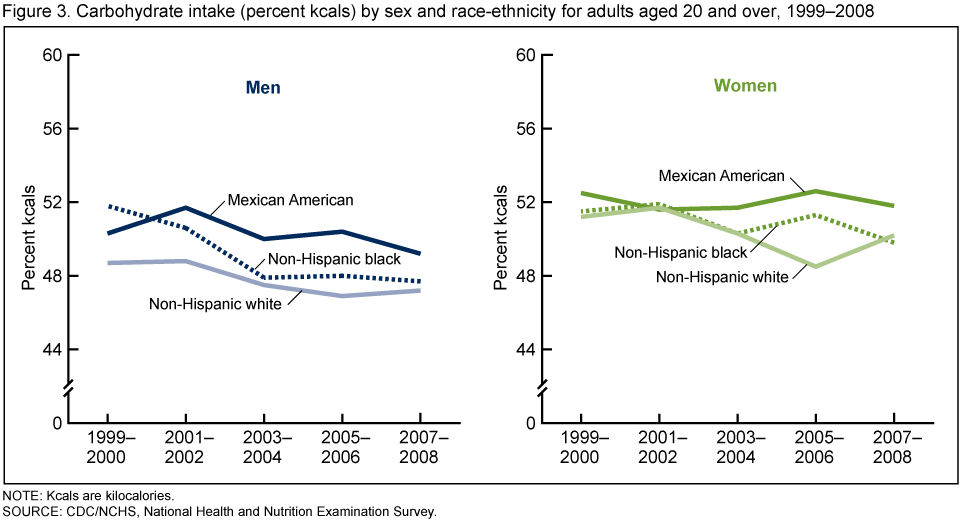 image icon
Were there any increases or decreases in protein intake in the population over the 10 years studied?
There was an increase in protein intake in men and women (Figure 2); between 1999-2000 and 2007-2008 intake increased from 15.6% kcals to 15.9% kcals in men and it increased from 15.2% kcals to 15.5% kcals in women.
Were there any increases or decreases in intake of total fat in the population over the 10 years studied?
There were no significant trends in total fat intake in men and women of all race-ethnicities combined (Figure 2), however there was an increase in non-Hispanic black men and women; between 1999-2000 and 2007-2008 intake increased from 30.5% kcals to 33.7% kcals in non-Hispanic black men and it increased from 32.1% kcals to 34.4% kcals in non-Hispanic black women.
Were there any increases or decreases in intake of saturated fat in the population over the 10 years studied?
The increase in men and women was not statistically significant (Figure 2), but trends were seen in some subgroups with an increase in saturated fat intake in non-Hispanic black men and women and in non-Hispanic white women (Figure 4).
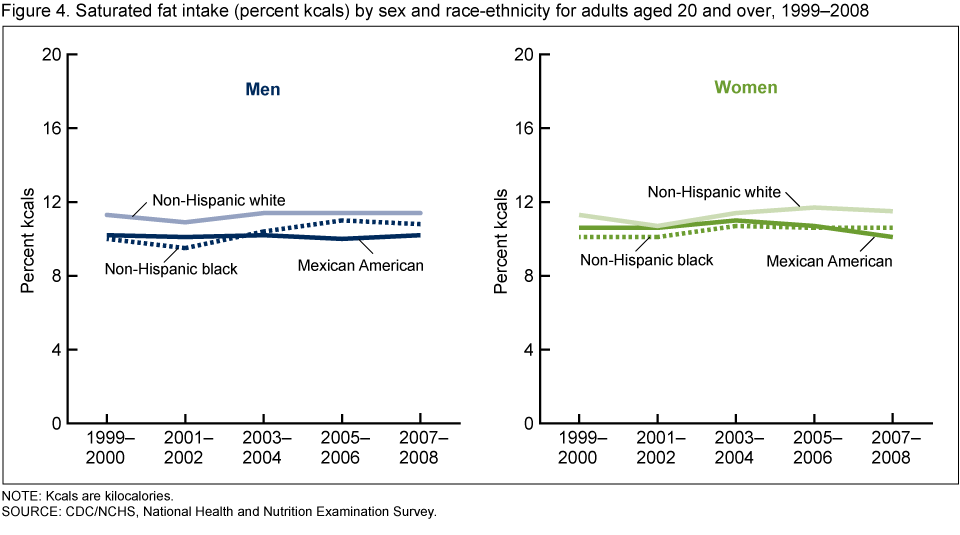 image icon
Were there differences in nutrient intake between sex and race-ethnicity groups examined here that persisted across each of the five 2-year survey periods in the 10 years studied?
Men consume more total calories than women. Carbohydrate intake was higher in women than in men. Saturated fat intake was lower in Mexican-American men than in non-Hispanic white men.
Summary
These results show that while population energy intakes have been relatively stable over the past decade, there have been changes in intake of some macronutrients. Although these changes are modest in magnitude, they indicate statistically significant population-level trends have occurred. Some of these trends warrant further investigation. In 2007-2008, none of the groups examined met the recommendation in the Dietary Guidelines for Americans to consume less than 10% of energy from saturated fat, and there was a statistically significant upward trend in non-Hispanic black men and women and in non-Hispanic white women (3).
The most recent analysis of trends in obesity for the period from 2007-2008 indicate no significant increase from 1999-2000 for women; there was a significant increase for men although only for the period from 1999-2000 to 2001-2002 (4). These trends are not inconsistent with the relatively stable trends in total energy intake, although many factors affect the trends in population levels of obesity.
It is important to consider trends in energy and macronutrient intakes in the development and evaluation of program and policy initiatives aimed at nutrition education and obesity prevention in the population. These findings show broad population trends and indicate the need for analyses to examine factors associated with these trends.
Definitions
Total energy intake: Includes energy intake from protein, carbohydrate, and total fat and energy intake from alcohol. Because intake from alcohol is not presented here, the sum of percent kcals for any group will not add to 100.
Calculation of percent kcals for macronutrients: Intake of macronutrients is given in grams on the data files and the following standard conversion factors are used to convert grams to kcals:4 kcals/gram for protein and carbohydrate and 9 kcals/gram for total fat and saturated fat.
Total fat: Includes all forms of fat—saturated, polyunsaturated, and monounsaturated.
Data source and methods
NHANES data were used for these analyses (5). NHANES is designed to monitor the health and nutritional status of the civilian, noninstitutionalized U.S. population. The survey consists of interviews conducted in participants’ homes, standardized physical examinations conducted in mobile examination centers (MECs), and laboratory tests using blood and urine specimens provided by participants during the physical examination.
The NHANES sample is selected though a complex, multistage design that includes selection of primary sampling units (counties), household segments within the counties, and finally sample persons from selected households. The sample design includes oversampling to provide more precise estimates for certain population subgroups. In 1999 NHANES became a continuous survey fielded on an ongoing basis. Each year of data collection is based on a representative sample covering all ages of the civilian noninstitutionalized U.S. population. Public-use data files are released in 2-year cycles.
Dietary sample weights, which account for the differential probabilities of selection, nonresponse and noncoverage and additionally, day of the week of dietary recall and nonresponse to the dietary interview, were incorporated into the estimation process. All data analyses were performed using the statistical software SAS version 9.2 (SAS Institute, Cary, N.C.) and SUDAAN version 10.0 (RTI, Research Triangle Park, N.C.). In order to compare prevalence estimates between subgroups that differed with respect to age distribution, all estimates except age-specific estimates were adjusted by the direct method to the 2000 U.S. population age distribution using the 20-year age intervals: 20-39 years, 40-59 years, and 60 years and over. Statistical tests of linear trends by survey were performed using orthogonal polynomial contrasts and tests of differences between population subgroups were performed using t-tests at the p <0.05 level. Adjustments for multiple comparison were made using the Bonferroni method by dividing 0.05 by the number of comparisons (6).
Information on demographic traits was collected via personal interview in the household. Information on nutrient intake was obtained from one 24-hour dietary recall interview administered in-person in the MEC. In 1999-2001, the dietary interview data collection system used was similar to that used in NHANES III, conducted from 1988 through 1994 and used a multiple-pass approach (7). In 2002, as a part of survey integration efforts with the U.S. Department of Agriculture’s (USDA) What We Eat in America/Continuing Survey of Food Intakes by Individuals, NHANES began to use the 24-hour dietary recall data collection system developed by researchers at USDA’s Agricultural Research Service, the Automated Multiple-Pass Method (8). Nutrient intakes were calculated from the individual foods and beverages reported in the dietary recall interview. In NHANES 1999-2000, reported foods and beverages were coded using USDA’s Survey Nutrient Database (versions 1994-1996 and 1998) (9). From 2001-2002 through 2007-2008, reported foods and beverages were coded using USDA’s Food and Nutrient Database for Dietary Studies (10).
About the authors
Jacqueline D. Wright and Chia-Yih Wang are with the Centers for Disease Control and Prevention’s National Center for Health Statistics, Division of Health and Nutrition Examination Surveys.
References
- U.S. Department of Health and Human Services. The Surgeon General’s Vision for a Healthy and Fit Nation. Rockville, MD. 2010.
- CDC. Trends in intake of energy and macronutrients—United States, 1971-2000. MMWR 53:80-2. 2004.
- U.S. Department of Health and Human Services and U.S. Department of Agriculture. Dietary guidelines for Americans, 2005.external icon 2005.
- Flegal K, Carroll M, Ogden C, et al. Prevalence and trends in obesity among U.S. adults, 1999-2008. JAMA 303:235-41. 2010.
- Centers for Disease Control and Prevention. National Center for Health Statistics. National Health and Nutrition Examination Surveys. NHANES Datasets and Related Documentation. Hyattsville, MD. 2010.
- Neter J, Wasserman W, Kutner M. Applied linear statistical models, 2d ed. Homewood, IL: Richard D. Irwin, Inc. 1985.
- Centers for Disease Control and Prevention. National Center for Health Statistics. National Health and Nutrition Examination Survey: Dietary Interviewers Procedures Manual, 2000.
- Agricultural Research Service, Food Surveys Research Group. USDA Automated Multiple-Pass Method for Dietary Recalls. 2006.external icon
- U.S. Department of Agriculture. Agricultural Research Service Food Surveys Research Group. Food survey technical databases. U.S. Department of Agriculture 1994-1998.
- Agricultural Research Service, Food Surveys Research Group. USDA Food and Nutrient Database for Dietary Studies. 2004.external icon
Suggested citation
Wright JD, Wang C-Y. Trends in intake of energy and macronutrients in adults from 1999-2000 through 2007-2008. NCHS data brief, no 49. Hyattsville, MD: National Center for Health Statistics. 2010.
Copyright information
All material appearing in this report is in the public domain and may be reproduced or copied without permission; citation as to source, however, is appreciated.
National Center for Health Statistics
Edward J. Sondik, Ph.D., Director
Jennifer H. Madans, Ph.D., Associate Director for Science
Division of Health and Nutrition Examination Surveys
Clifford L. Johnson, M.S.P.H., Director