Recent Trends in the Prevalence of High Blood Pressure and its Treatment and Control, 1999-2008
- Key findings
- What is the recent trend in the prevalence of high blood pressure among U.S. adults and are there differences in trends among racial or ethnic groups?
- Has the prevalence of high blood pressure changed for different age groups?
- Among adults with high blood pressure, has there been any change in the proportion who are aware of their condition?
- Among adults with high blood pressure, what is the trend in the proportion who are treated with medication?
- Among adults with high blood pressure, what is the trend in the proportion of adults who have controlled blood pressure?
- Summary
- Definitions
- Data source and methods
- About the authors
- References
- Suggested citation
NCHS Data Brief No. 48, October 2010
PDF Versionpdf icon (1.1 MB)
Sung Sug (Sarah) Yoon, Yechiam Ostchega, and Tatiana Louis
Key findings
Data from the National Health and Nutrition Examination Survey
- There was no significant change in the prevalence of high blood pressure among U.S. adults from 1999-2000 to 2007-2008. This was true for men and women, all age groups, and for non-Hispanic white, non-Hispanic black, and Mexican-American adults.
- Among U.S. adults with high blood pressure, the percentage that was aware of the condition increased from 69.6% in 1999-2000 to 80.6% in 2007-2008.
- Among U.S. adults with high blood pressure, the percentage who were taking medication to lower their blood pressure increased from 1999-2000 through 2007-2008.
- The control of blood pressure increased among U.S. adults with high blood pressure from 1999-2000 through 2007-2008. Increases in control occurred for all subgroups of the population.
High blood pressure is one of the most common risk factors for cardiovascu-lar disease and stroke (1). This report evaluates the overall trends in age-adjusted high blood pressure prevalence, awareness, treatment, and control using the most recent 10 year NHANES data. It also examines these age-adjusted rates for hypertension by sex, age, and race and ethnicity.
Keywords: high blood pressure, prevalence, trends
What is the recent trend in the prevalence of high blood pressure among U.S. adults and are there differences in trends among racial or ethnic groups?
- The prevalence of high blood pressure did not significantly change over the 10-year period 1999-2008; it remained approximately 30% (Figure 1).
- The prevalence of high blood pressure did not change significantly for non-Hispanic white, non-Hispanic black, or Mexican-American adults over the 10-year period. The prevalence of high blood pressure remained higher among non-Hispanic black adults compared with non-Hispanic white and Mexican-American adults throughout this time period.
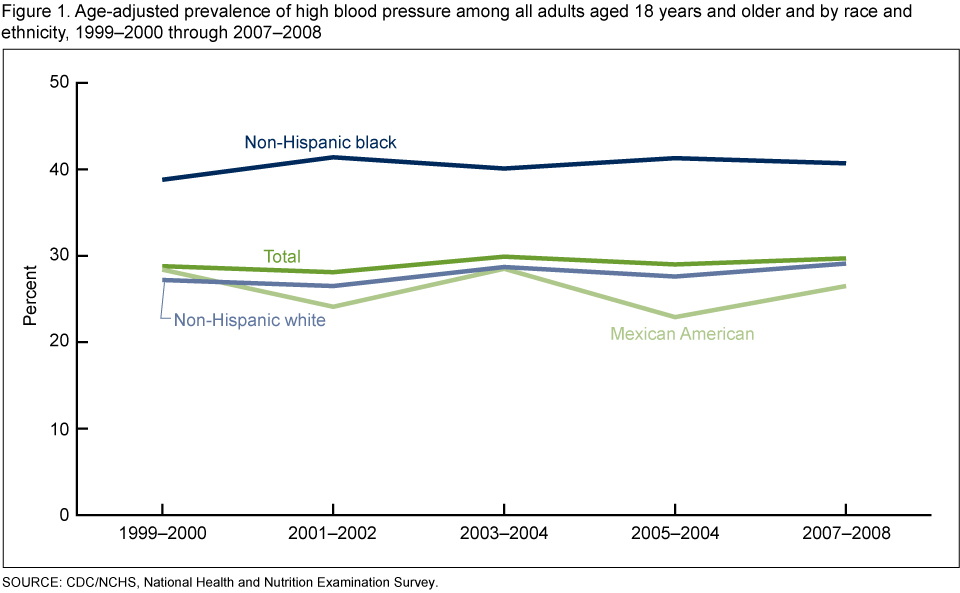 image icon
- The prevalence of high blood pressure did not change among either men or women during this period (data not shown)
Has the prevalence of high blood pressure changed for different age groups?
- During 1999-2008, there was no significant change in the prevalence of high blood pressure among adults aged 18-39, 40-59, or 60 years and older (Figure 2).
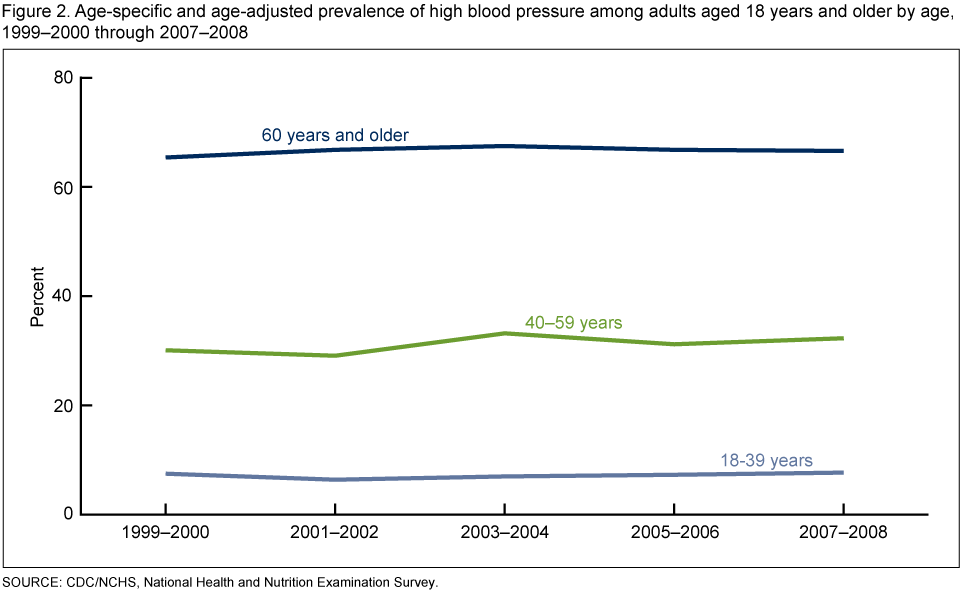 image icon
Among adults with high blood pressure, has there been any change in the proportion who are aware of their condition?
- Among adults with high blood pressure, the overall percentage of adults who were aware of the problem increased from 69.6% in 1999-2000 to 80.6% in 2007-2008. The trend in awareness of high blood pressure was similar for men and women (data not shown) (Figure 3).
- The percentage of adults who were aware of their high blood pressure increased over the 10-year period for hypertensive adults aged 40-59 years and 60 years and older, but not for those aged 18-39 years.
- Awareness increased among non-Hispanic white and non-Hispanic black adults, but not Mexican-American adults over the 10-year period, 1999-2000 through 2007-2008.
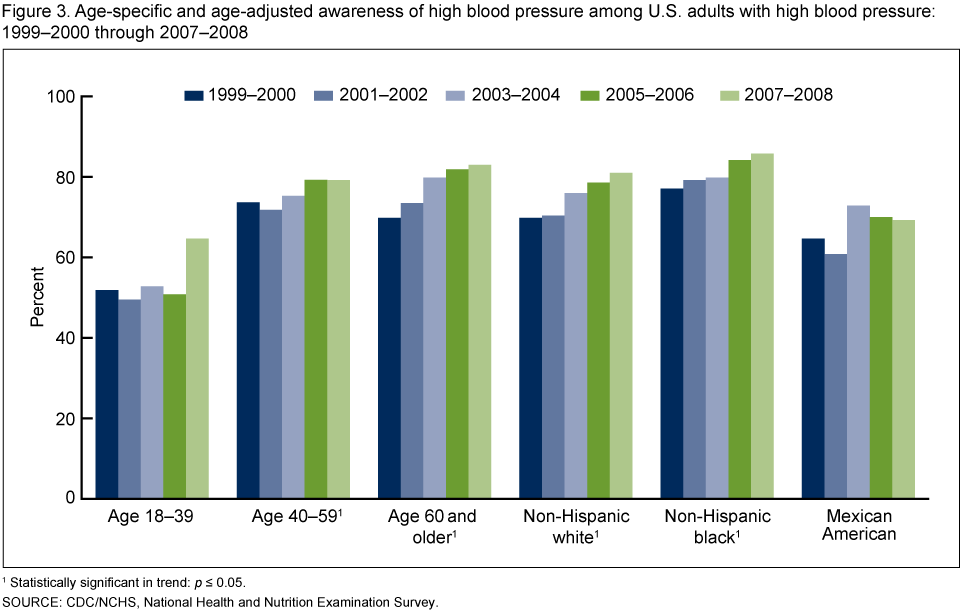 image icon
Among adults with high blood pressure, what is the trend in the proportion who are treated with medication?
- Among persons with high blood pressure, the percentage who were treated with medication increased from 59.4% in 1999-2000 to 71.6% in 2007-2008. The increase occurred for both men and women (data not shown), the non-Hispanic white, non-Hispanic black, and Mexican-American populations (Figure 4).
- Among adults who had high blood pressure, the percentage who was taking medication to lower their blood pressure increased for those aged 18-39 years and aged 60 years and older but not for those aged 40-59 years.
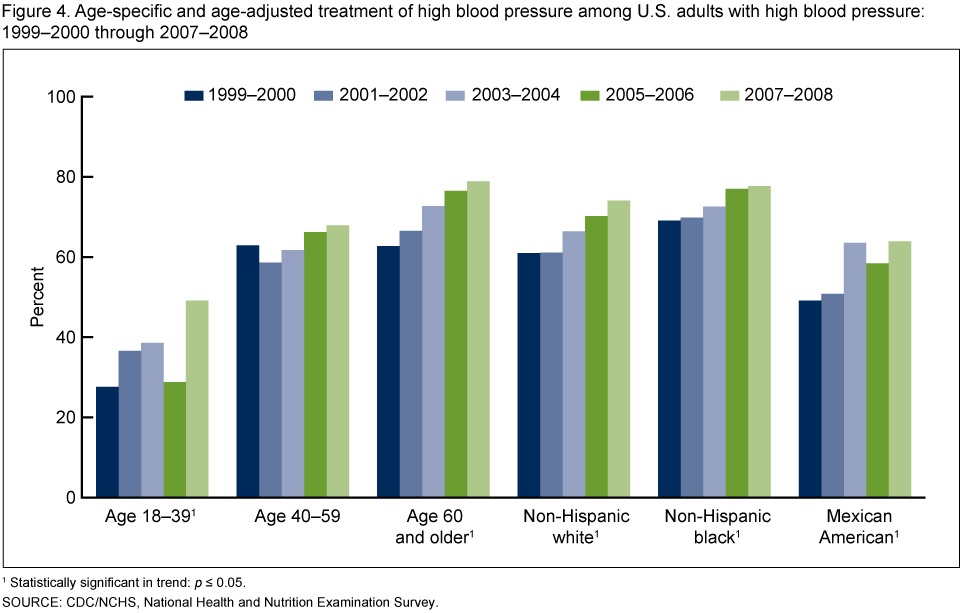 image icon
Among adults with high blood pressure, what is the trend in the proportion of adults who have controlled blood pressure?
- Among adults with high blood pressure, the overall percentage of adults who have controlled blood pressure increased from 31.6% in 1999-2000 to 48.4% in 2007-2008 (Figure 5).
- There was a significant increase in the percentage of hypertensive adults who achieved blood pressure control for both men and women (data not shown), all age groups (18-39 years, 40-59 years, and 60 years and older), and all three major race and ethnic groups (non-Hispanic white, non-Hispanic black, and Mexican American) over the 10-year period.
 image icon
Summary
Overall, the prevalence of high blood pressure among U.S. adults did not change over the last decade (1999-2008). However, there have been significant increases in high blood pressure awareness, treatment, and control among persons with high blood pressure over this same time period.
More detailed analyses showed that trends among population subgroups were consistent with the trends in the overall population, with few exceptions. The lack of change in the prevalence of high blood pressure from 1999-2000 through 2007-2008 was consistent among all population subgroups defined by sex, age, and race and ethnicity. Among adults with high blood pressure, there were increasing trends in the proportion who were aware of their condition among most demographic subgroups; the exceptions were those aged 18-39 years and Mexican-American adults. The percentage who were treated with medication to control their blood pressure increased from 1999-2000 through 2007-2008 for all groups except those aged 40-59 years. The percentage whose blood pressure was controlled increased among all population subgroups over this time period.
Definitions
High blood pressure: Systolic blood pressure greater than or equal to 140 mm Hg or diastolic blood pressure greater than or equal to 90 mm Hg or currently taking medication to lower high blood pressure (2,3).
The average of up to three brachial systolic and diastolic blood pressure readings was used for systolic and diastolic BP values. All BP readings were obtained at a single examination visit. BP was measured in a mobile examination center by trained physicians following a standard protocol. Appropriate BP cuff sizes were used for participants based on measurement of mid-arm circumference. Estimates are age-adjusted.
Awareness of high blood pressure: Defined by an affirmative response to the question “Have you ever been told by a doctor or health professional that you had hypertension, also called high blood pressure?” Estimates are age-adjusted.
Currently taking medication to lower BP: Among all adults who had high blood pressure, defined by affirmative responses to the following questions: “Because of your high blood pressure/hypertension, have you ever been told to take prescribed medicine?”and “Are you now following this advice to take prescribed medicine?” Estimates are age-adjusted.
Controlled high blood pressure: Systolic BP less than 140 mm Hg and diastolic BP less than 90 mm Hg among those with high blood pressure (4,5). Estimates are age-adjusted.
Data source and methods
The National Health and Nutrition Examination Surveys (NHANES) were used for these analyses. NHANES is designed to monitor the health and nutritional status of the civilian, noninstitutionalized U.S. population (4). The survey consists of interviews conducted in participants’ homes, standardized physical examinations conducted in specially outfitted mobile examination centers, and laboratory tests utilizing blood and urine specimens provided by participants during the physical examination.
The NHANES sample is selected through a complex, multistage design that includes selection of primary sampling units (counties), household segments within the counties, and finally sample study participants from selected households. The sample design includes oversampling to obtain reliable estimates of health and nutritional measures for population subgroups. In 1999-2006, non-Hispanic black persons, Mexican-American persons, persons with low-income, persons aged 12-19 years, and persons 60 years and over were over sampled to obtain reliable prevalence estimates for these specific population subgroups. In 1999, NHANES became a continuous survey, fielded on an ongoing basis. Each year of data collection is based on a representative sample covering all ages of the civilian, noninstitutionalized population. Public-use data files are released in 2-year cycles. Sample weights, which account for the differential probabilities of selection, nonresponse, and noncoverage, are incorporated into the estimation process. The standard errors of the percentages were estimated using Taylor series linearization, a method that incorporates the sample weights and sample design.
Age-adjusted prevalence estimates were calculated for race and ethnicity and sex categories using SUDAAN proc descript and using the 2000 projected U.S. population (using the 2000 U.S. Census age groups of 18-39 years, 40-59 years, and 60 years and older) (5). Age-adjusted prevalence of awareness of high blood pressure, treatment of high blood pressure, and control rates of high blood pressure were calculated using the subpopulation of persons who have high blood pressure. To test for linear and quadratic trends in survey periods, the null hypothesis of nonlinear or quadratic trend were examined using orthogonal polynomials (6). All significance tests were two-sided using p<0.05 as the level of statistical significance. All differences reported are statistically significant unless otherwise indicated. Statistical analyses were conducted using the SAS System for Windows (release 9.1; SAS Institute Inc, Cary, N.C.) and SUDAAN (release 9.0; Research Triangle Institute, Research Triangle Park, N.C.).
About the authors
Sung Sug (Sarah) Yoon, Yechiam Ostchega, and Tatiana Louis are with the Centers for Disease Control and Prevention’s National Center for Health Statistics, Division of Health and Nutrition Examination Surveys.
References
- Whitworth JA, World Health Organization, International Society of Hypertension Writing Group. 2003 World Health Organization (WHO)/International Society of Hypertension (ISH) statement on management of hypertension. J Hypertens 21:1983-92. 2003.
- Chobanian AV, Bakris GL, Black HR, Cushman WC, Green LA, Izzo JL Jr, et al. The Seventh report of the Joint National Committee on Prevention, Detection, Evaluation, and Treatment of High Blood Pressure: the JNC 7 report. JAMA 289(19):2560-72. 2003.
- National Heart Lung and Blood Institute. National High Blood Pressure Education Programpdf iconexternal icon.
- The National Health and Nutrition Examination Survey (NHANES) Examination Manuals (1999-2000; 2001-2002; 2003-2004; 2005-2006). Hyattsville, MD: National Center for Health Statistics.
- Klein RJ, Schoenborn C. Age adjustment using the 2000 projected U.S. population. Healthy People Statistical Notes, no 20. Hyattsville, MD: National Center for Health Statistics. 2001.
- Winer BJ. Statistical principles in experimental design. New York, NY: McGraw-Hill companies; 878 (Table C.10). 1971.
Suggested citation
Yoon S, Ostchega Y, Louis T. Recent trends in the prevalence of high blood pressure and its treatment and control, 1999-2008. NCHS data brief, no 48. Hyattsville, MD: National Center for Health Statistics. 2010.
Copyright information
All material appearing in this report is in the public domain and may be reproduced or copied without permission; citation as to source, however, is appreciated.
National Center for Health Statistics
Edward J. Sondik, Ph.D., Director
Jennifer H. Madans, Ph.D., Associate Director for Science
Division of Health and Nutrition Examination Surveys
Clifford L. Johnson, M.S.P.H., Director