State Disparities in Teenage Birth Rates in the United States
- Key findings
- State-specific teenage birth rates are highest across the southern United States.
- State variation in the composition of the teenage population does not fully explain state differences in the teenage birth rate.
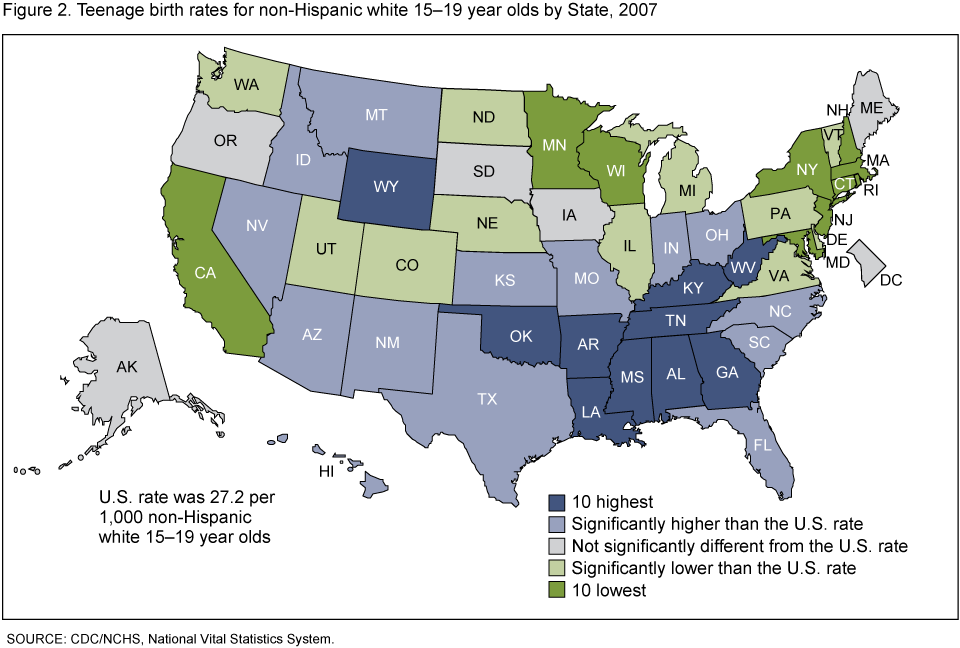
- Birth rates for non-Hispanic white teenagers are highest in the Southeast.
- Birth rates for non-Hispanic black teenagers are highest in Southeastern and upper Midwestern states.
- Birth rates for Hispanic teenagers are highest in the Southeast.
- Summary
- Definition
- Data source and methods
- About the authors
- References
- Suggested citation
NCHS Data Brief No. 46, October 2010
PDF Version (857 KB)
T.J. Mathews, M.S.; Paul D. Sutton, Ph.D.; Brady E. Hamilton, Ph.D.; and Stephanie J. Ventura, M.A.
Key findings
- In 2008, state-specific teenage birth rates varied widely, from less than 25.0 per 1,000 15-19 year olds to more than 60.0.
- Rates for non-Hispanic white and Hispanic teenagers were uniformly higher in the Southeast and lower in the Northeast and California.
- The highest rates for non-Hispanic black teenagers were reported in the upper Midwest and in the Southeast.
- The race and Hispanic origin-specific birth rates by state as well as the population composition of states by race and Hispanic origin contribute to state variations in overall teenage birth rates.
Childbearing by teenagers has been the subject of public concern for decades. Births to teenagers are at higher risk of low birthweight and preterm birth, and death in infancy, compared with babies born to women in their twenties and older (1-3). With the exception of a 2-year increase between 2005 and 2007, teenage birth rates have declined each year since 1991 (1,4,5). Despite nearly two decades of declining teenage birth rates, significant disparities in state-specific rates persist. This report examines disparities in teenage birth rates by state and among the largest racial and ethnic population groups. The most current data available from the National Vital Statistics System are from the 2008 preliminary file (4). Variations by race and ethnicity by state are illustrated using 2007 data, the most recent available with this detail.
Keywords: births, teenage birth rates, state rates
State-specific teenage birth rates are highest across the southern United States.

Table: Birth rates for teenagers 15–19 years: United States and each state, preliminary 2008 and by race and Hispanic origin of mother, final 2007 [By place of residence]
| State | 2008 | 2007 | ||
|---|---|---|---|---|
| All races | Non-Hispanic white1 | Non-Hispanic black1 | Hispanic | |
| United States | 41.5 | 27.2 | 64.2 | 81.8 |
| Alabama | 52.9 | 42.6 | 66.4 | 188.3 |
| Alaska | 46.9 | 28.2 | 51.2 | 61.3 |
| Arizona | 56.2 | 30.1 | 60.0 | 102.2 |
| Arkansas | 61.8 | 51.8 | 83.2 | 113.6 |
| California | 38.4 | 15.8 | 43.7 | 66.4 |
| Colorado | 42.5 | 22.9 | 57.6 | 101.0 |
| Connecticut | 22.9 | 9.7 | 43.6 | 76.9 |
| Delaware | 40.4 | 23.7 | 64.2 | 122.8 |
| District of Columbia | 50.9 | 4.3 | 64.8 | 115.5 |
| Florida | 42.8 | 30.8 | 67.9 | 62.1 |
| Georgia | 52.0 | 38.5 | 66.7 | 139.6 |
| Hawaii | 42.1 | 31.6 | 17.4 | 97.2 |
| Idaho | 41.2 | 32.9 | * | 104.3 |
| Illinois | 38.1 | 20.6 | 77.9 | 75.3 |
| Indiana | 43.7 | 37.7 | 76.9 | 101.4 |
| Iowa | 33.9 | 27.3 | 88.4 | 104.8 |
| Kansas | 45.6 | 33.3 | 71.1 | 109.3 |
| Kentucky | 55.6 | 51.5 | 72.4 | 133.0 |
| Louisiana | 54.1 | 40.3 | 77.5 | 75.0 |
| Maine | 26.1 | 26.1 | 53.8 | 31.3 |
| Maryland | 32.8 | 19.4 | 51.8 | 95.2 |
| Massachusetts | 20.1 | 13.7 | 39.4 | 71.2 |
| Michigan | 33.2 | 24.5 | 64.0 | 77.7 |
| Minnesota | 27.2 | 17.9 | 80.9 | 108.7 |
| Mississippi | 65.7 | 54.8 | 89.5 | 114.4 |
| Missouri | 45.5 | 37.9 | 77.2 | 92.9 |
| Montana | 40.7 | 29.3 | * | 37.7 |
| Nebraska | 36.5 | 23.3 | 93.0 | 116.9 |
| Nevada | 53.5 | 31.3 | 67.8 | 94.8 |
| New Hampshire | 19.8 | 19.0 | * | 49.1 |
| New Jersey | 24.5 | 8.5 | 50.2 | 65.7 |
| New Mexico | 64.1 | 36.4 | 46.4 | 85.6 |
| New York | 25.5 | 14.1 | 38.4 | 55.3 |
| North Carolina | 49.4 | 33.1 | 65.1 | 149.3 |
| North Dakota | 28.6 | 20.3 | * | 79.8 |
| Ohio | 41.0 | 32.9 | 78.6 | 87.6 |
| Oklahoma | 61.6 | 49.9 | 72.2 | 110.2 |
| Oregon | 37.2 | 27.0 | 45.1 | 93.4 |
| Pennsylvania | 31.5 | 20.3 | 69.9 | 100.4 |
| Rhode Island | 28.5 | 16.6 | 63.1 | 82.0 |
| South Carolina | 53.0 | 38.4 | 69.8 | 158.5 |
| South Dakota | 40.0 | 26.5 | * | 114.3 |
| Tennessee | 55.6 | 45.2 | 77.7 | 174.8 |
| Texas | 63.4 | 33.8 | 67.2 | 99.0 |
| Utah | 35.1 | 24.9 | 59.5 | 114.2 |
| Vermont | 21.3 | 22.3 | * | * |
| Virginia | 33.5 | 24.0 | 53.6 | 90.7 |
| Washington | 34.6 | 24.5 | 44.8 | 99.4 |
| West Virginia | 48.8 | 47.8 | 49.4 | 43.7 |
| Wisconsin | 31.3 | 19.6 | 95.1 | 99.3 |
| Wyoming | 49.2 | 43.0 | * | 107.6 |
* Figure does not meet standards of reliability or precision; based on fewer than 20 births in the numerator.
1 Births with origin of mother not stated are included with non-Hispanic births.
In 2008, teenage birth rates by state ranged from less than 25.0 per 1,000 15-19 year olds (Connecticut, Massachusetts, New Hampshire, and Vermont), to more than 60.0 per 1,000 (Arkansas, Mississippi, New Mexico, Oklahoma, and Texas). The lowest teenage birth rates were reported in the Northeast and upper Midwest. Rates were highest in states across the southern United States (Figure 1 and Table).
State variation in the composition of the teenage population does not fully explain state differences in the teenage birth rate.
Teenage birth rates have historically been higher for non-Hispanic black and Hispanic teenagers than for non-Hispanic white teenagers (5-7). In 2007, the birth rate for Hispanic teenagers (81.8 per 1,000 aged 15-19 years) was nearly three times the rate for non-Hispanic white teenagers (27.2), and the rate for non-Hispanic black teenagers (64.2) was more than twice the rate for non-Hispanic white teenagers (see Table). One would expect that states with large proportions of Hispanic or non-Hispanic black teenagers would have higher overall teenage birth rates. However, race and Hispanic origin specific rates also vary widely by state. Rates in 2007 for non-Hispanic white teenagers ranged from 4.3 per 1,000 15-19 year olds in the District of Columbia to 54.8 in Mississippi; for non-Hispanic black teenagers, rates ranged from 17.4 in Hawaii to 95.1 in Wisconsin; and for Hispanic teenagers, rates ranged from 31.1 in Maine to 188.3 in Alabama (see Table).
Birth rates for non-Hispanic white teenagers are highest in the Southeast.
Birth rates in 2007 for non-Hispanic white teenagers tended to be highest in the Southeast, but were relatively high across the southern United States, similar to the pattern observed for all races combined (Figure 2). Birth rates for non-Hispanic white teenagers were lowest in the Northeast, upper Midwest, and in California, ranging from less than 10.0 births per 1,000 non-Hispanic white 15-19 year olds (Connecticut, the District of Columbia, and New Jersey) to 50.0 or more births per 1,000 (Arkansas, Kentucky, and Mississippi).
Birth rates for non-Hispanic black teenagers are highest in Southeastern and upper Midwestern states.
The highest birth rates for non-Hispanic black teenagers were reported in the upper Midwest and in the Southeast along the Mississippi River (Figure 3). Some of the lowest teenage birth rates were clustered in southern New England and along the Pacific coast. In 2007, birth rates for non-Hispanic black teenagers ranged from less than 40.0 births per 1,000 15-19 year olds in Hawaii, Massachusetts, and New York, to more than 80.0 births per 1,000 in Arkansas, Iowa, Minnesota, Mississippi, Nebraska, and Wisconsin.

Birth rates for Hispanic teenagers are highest in the Southeast.
Birth rates for Hispanic teenagers in 2007 were relatively high across much of the United States, but the highest teenage birth rates were concentrated in the Southeast (Figure 4). Compared with the national birth rate for Hispanic teenagers, birth rates were significantly lower for Hispanic teenagers in California, New York, New Jersey, and Florida, which together accounted for 38% of Hispanic teenage births in 2007. However, state-specific birth rates for Hispanic teenagers exceeded the national Hispanic teenage birth rate in 35 states and the District of Columbia.
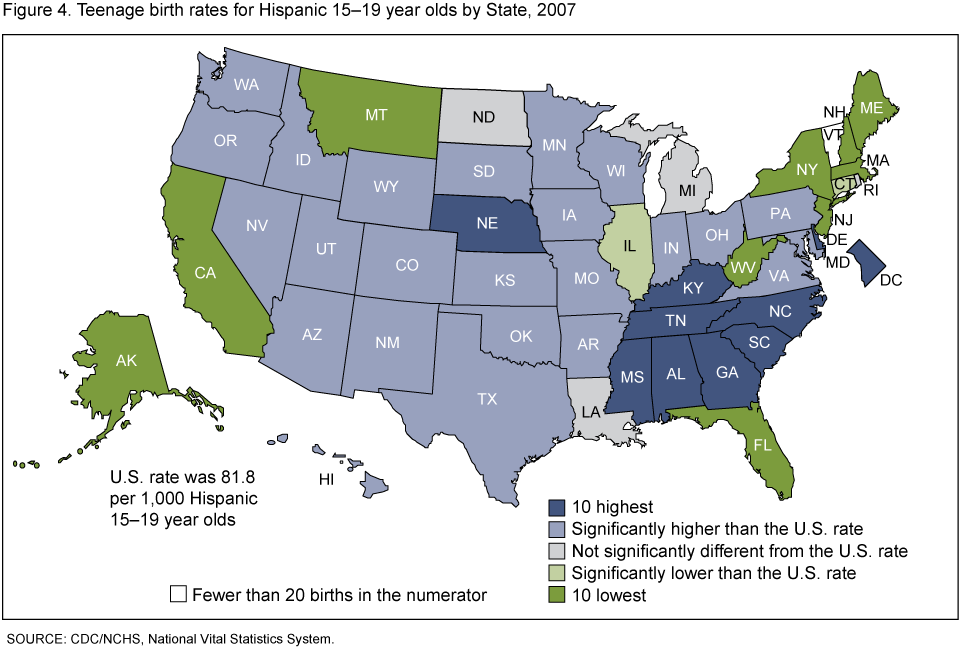
Birth rates for Hispanic teenagers ranged from less than 60.0 births per 1,000 Hispanic 15-19 year olds (Maine, Montana, New Hampshire, New York, and West Virginia) to more than 120.0 births per 1,000 in five Southeastern states (Alabama, Georgia, North Carolina, South Carolina, and Tennessee).
Summary
In 2008, as in previous years, teenage birth rates were consistently highest in states across the South and Southwest, and lowest in the Northeast and upper Midwest. The race and Hispanic origin-specific birth rates by state as well as the population composition of states by race and Hispanic origin both contribute to state variations in the teenage birth rate. Historically, national birth rates have been higher for Hispanic and non-Hispanic black teenagers than for non-Hispanic white teenagers. Thus, states with large proportions of Hispanic or non-Hispanic black teenagers would be expected to have higher overall teenage birth rates. Although this tends to be the observed pattern, there are some notable exceptions. Birth rates for non-Hispanic white, non-Hispanic black, and Hispanic teenagers are all uniformly higher in the Southeast and lower in the Northeast and California. In fact, birth rates for non-Hispanic white, non-Hispanic black, and Hispanic teenagers in California, New York, and New Jersey are among the 10 lowest state-specific rates for each of these population groups. States in the upper Midwest exhibit a different pattern. Rates for non-Hispanic black teenagers in the upper Midwest are uniquely among the 10 highest rates of all states. In contrast, in the same upper Midwestern states, birth rates for non-Hispanic white teenagers are generally significantly lower than the U.S. rate for this group.
Although teenage birth rates fell nationally and in 14 states from 2007 to 2008 (see expanded internet table [PDF – 239 KB]), the birth rate for the United States remains substantially higher than for other Western countries (8).
There has been a broad consensus on the goal of preventing teenage pregnancy, and a wide variety of public and private programs have been developed to meet this challenge (9-11). Variations in teenage birth rates reflect differences in many factors, including differences in socioeconomic factors such as education and income, risk behaviors such as sexual activity and contraceptive use, and attitudes among teenagers toward pregnancy and childbearing (12).
Definition
Teenage birth rate: The number of births to women aged 15-19 years per 1,000 women aged 15-19 years.
Data source and methods
This report contains data from the Natality Data File from the National Vital Statistics System. The vital statistics natality file includes information for all births occurring in the United States. The natality files include information on a wide range of maternal and infant demographic and health characteristics for babies born in the United States. The natality files are available from Vital Statistics Online. Data may also be accessed from the interactive data access tool, VitalStats.
State-specific birth rates for teenagers for 2008 are based on preliminary birth data. Information on the 2008 data is available elsewhere (4). Population data for computing birth rates were provided by the U.S. Census Bureau. Rates by state may differ from rates computed on the basis of other population estimates (1,6).
Note: Birth rates by state are not shown for groups with fewer than 20 births in the numerator.
About the authors
T.J. Mathews, Paul D. Sutton, Brady E. Hamilton, and Stephanie J. Ventura are with the Centers for Disease Control and Prevention’s National Center for Health Statistics, Division of Vital Statistics, Reproductive Statistics Branch. Yashodhara Patel, also with the Reproductive Statistics Branch, provided verification for the table and figures.
References
- Martin JA, Hamilton BE, Sutton PD, et al. Births: Final data for 2007. National vital statistics reports; vol 58 no 24. Hyattsville, MD: National Center for Health Statistics. 2010.
- Martin JA, Osterman MJK, Sutton PD. Are preterm births on the decline in the United States? Recent data from the National Vital Statistics System. NCHS data brief, no 39. Hyattsville, MD: National Center for Health Statistics. 2010.
- Mathews TJ, MacDorman MF. Infant mortality statistics from the 2006 period linked birth/infant death data set. National vital statistics reports; vol 58 no 17. Hyattsville, MD: National Center for Health Statistics. 2010.
- Hamilton BE, Martin JA, Ventura SJ. Births: Preliminary data for 2008. National vital statistics reports; vol 58 no 16. Hyattsville, MD: National Center for Health Statistics. 2010.
- Ventura SJ, Mathews TJ, Hamilton BE. Births to teenagers in the United States, 1940-2000. National vital statistics reports; vol 49 no 10. Hyattsville, MD: National Center for Health Statistics. 2001.
- Hamilton BE, Sutton PD, Ventura SJ. Revised birth and fertility rates for the 1990s and new rates for hispanic populations, 2000 and 2001: United States. National vital statistics reports; vol 51 no 12. Hyattsville, MD: National Center for Health Statistics. 2003.
- Sutton PD, Mathews TJ. Trends in characteristics of births by state: United States, 1990, 1995, and 2000-2002. National vital statistics reports; vol 52 no 19. Hyattsville, MD: National Center for Health Statistics. 2004.
- United Nations Statistics Division. Demographic yearbook 2007. New York, NY: United Nations; 2009. Accessed July 29, 2010.
- National Campaign to Prevent Teen and Unplanned Pregnancy. National Data. Washington, DC: National Campaign to Prevent Teen Pregnancy. Accessed July 8, 2010.
- Kirby D. Emerging answers 2007: Research findings on programs to reduce teen pregnancy and sexually transmitted diseases. Washington, DC: National Campaign to Prevent Teen and Unplanned Pregnancy. 2007.
- Oringanje C, Meremikwu MM, Eko H, et al. Interventions for preventing unintended pregnancies among adolescents. Cochrane Database Syst Rev 10:7(4):CD005215. 2009.
- Abma JC, Martinez GM, Copen CE. Teenagers in the United States: Sexual activity, contraceptive use, and childbearing, National Survey of Family Growth 2006-2008. National Center for Health Statistics. Vital Health Stat 23(30). 2010.
Suggested citation
Mathews TJ, Sutton PD, Hamilton BE, Ventura SJ. State disparities in teenage birth rates in the United States. NCHS data brief, no 46. Hyattsville, MD: National Center for Health Statistics. 2010.
Copyright information
All material appearing in this report is in the public domain and may be reproduced or copied without permission; citation as to source, however, is appreciated.
National Center for Health Statistics
Edward J. Sondik, Ph.D., Director
Jennifer H. Madans, Ph.D., Associate Director for Science
Division of Vital Statistics
Charles J. Rothwell, M.S., Director