Suicide Mortality in the United States, 1999–2019
NCHS Data Brief No. 398, February 2021
PDF Versionpdf icon (409 KB)
Holly Hedegaard, M.D., Sally C. Curtin, M.A., and Margaret Warner, Ph.D.
- Key findings
- For both males and females, the suicide rate in 2019 was significantly lower than the rate in 2018.
- Female suicide rates in 2019 were similar to rates in 2018 for most age groups.
- Male suicide rates in 2019 were significantly lower than the rates in 2018 for age groups 10–14, 45–64, and 65–74.
- For females, the pattern in the means of suicide has changed in recent years.
- For males, rates of suicide by firearm and suffocation have increased in recent years.
Data from the National Vital Statistics System, Mortality
- After increasing from 1999 through 2018, the age-adjusted suicide rate in 2019 (13.9 per 100,000) was significantly lower than the rate in 2018 (14.2).
- For females, rates in 2019 were similar to those in 2018 for all age groups except 25–44, where the rate in 2019 was significantly lower than the rate in 2018.
- For males aged 10–14, 45–64, and 65–74, the rates in 2019 were significantly lower than the rates in 2018.
- Similar to 2018, the 2019 rates for female suicide by suffocation (1.8) and by firearm (1.8) were higher than the rate for suicide by poisoning (1.7).
- From 1999 through 2019, rates for male suicide were highest for those by firearm, while rates for suicide by suffocation saw the greatest percent increase, doubling from 3.3 in 1999 to 6.6 in 2019.
In 2019, suicide was the 10th leading cause of death for all ages in the United States (1). As the second leading cause of death for ages 10–34 and the fourth leading cause for ages 35–54, suicide is a major contributor to premature mortality (2). Recent reports have documented a steady increase in suicide rates over the past two decades (3–6). This Data Brief uses final mortality data from the National Vital Statistics System to update trends in suicide rates from 1999 through 2019 and to describe differences by sex, age group, and means of suicide.
Keywords: intentional self-harm, means of suicide, firearm, suffocation, poisoning, National Vital Statistics System
For both males and females, the suicide rate in 2019 was significantly lower than the rate in 2018.
- The total age-adjusted suicide rate increased 35.2% from 10.5 per 100,000 standard population in 1999 to 14.2 in 2018, before declining by 2.1% to 13.9 in 2019 (Figure 1).
- The male suicide rate remained stable from 1999 through 2006, then increased on average by about 1.7% per year from 2006 through 2019, although the rate in 2019 (22.4) was significantly lower than the rate in 2018 (22.8).
- The female suicide rate increased on average by about 2.1% per year from 1999 through 2009 and by 3.6% per year from 2009 through 2015, then remained stable from 2015 through 2019, although the rate in 2019 (6.0) was significantly lower than the rate in 2018 (6.2).
Figure 1. Age-adjusted suicide rates, by sex: United States, 1999–2019
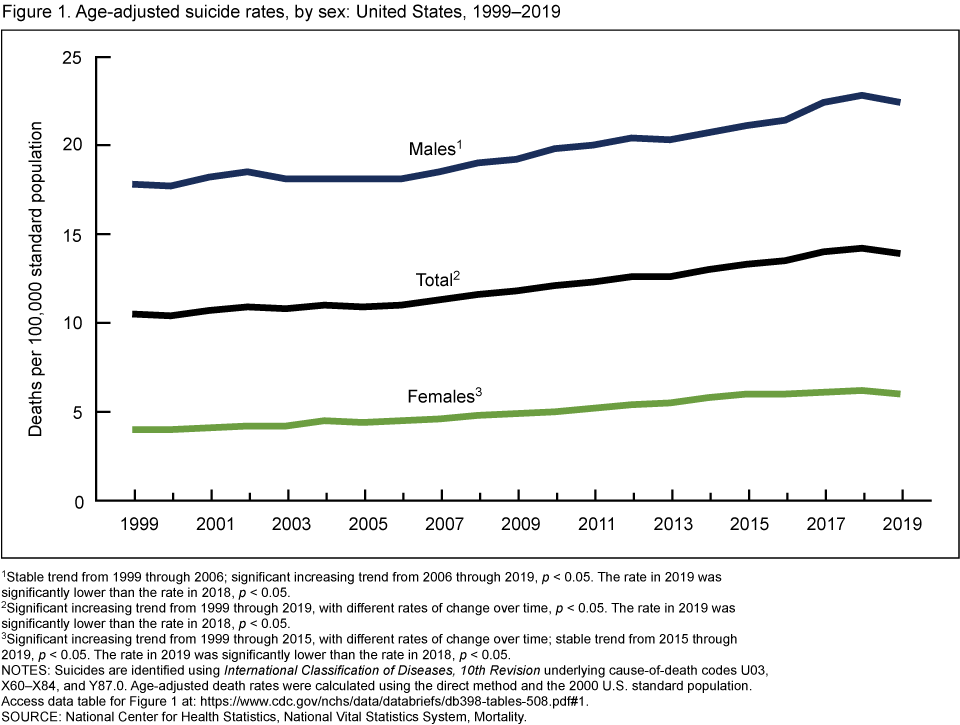
1Stable trend from 1999 through 2006; significant increasing trend from 2006 through 2019, p < 0.05. The rate in 2019 was significantly lower than the rate in 2018, p < 0.05.
2Significant increasing trend from 1999 through 2019, with different rates of change over time, p < 0.05. The rate in 2019 was significantly lower than the rate in 2018, p < 0.05.
3Significant increasing trend from 1999 through 2015, with different rates of change over time; stable trend from 2015 through 2019, p < 0.05. The rate in 2019 was significantly lower than the rate in 2018, p < 0.05.
NOTES: Suicides are identified using International Classification of Diseases, 10th Revision underlying cause-of-death codes U03, X60–X84, and Y87.0. Age-adjusted death rates were calculated using the direct method and the 2000 U.S. standard population. Access data table for Figure 1pdf icon.
SOURCE: National Center for Health Statistics, National Vital Statistics System, Mortality.
Female suicide rates in 2019 were similar to rates in 2018 for most age groups.
- Generally, suicide rates among females increased between 1999 and 2019 for all age groups except women aged 75 and over. Patterns of increase varied by age group, with different rates of change over time (Figure 2).
- From 1999 through 2019, female suicide rates were highest among those aged 45–64. The rate increased from 6.0 in 1999 to 10.2 in 2015, then decreased slightly to 9.6 in 2019; however, this decline in the trend was not significant.
- From 1999 through 2019, female suicide rates were lowest among those aged 10–14. The rate increased from 0.5 in 1999 to 2.0 in 2018 and 2019.
- Female suicide rates in 2019 were similar to rates in 2018 for each age group except 25–44. For this group, the rate in 2019 (7.4) was significantly lower than the rate in 2018 (7.9).
Figure 2. Suicide rates for females, by age group: United States, 1999–2019
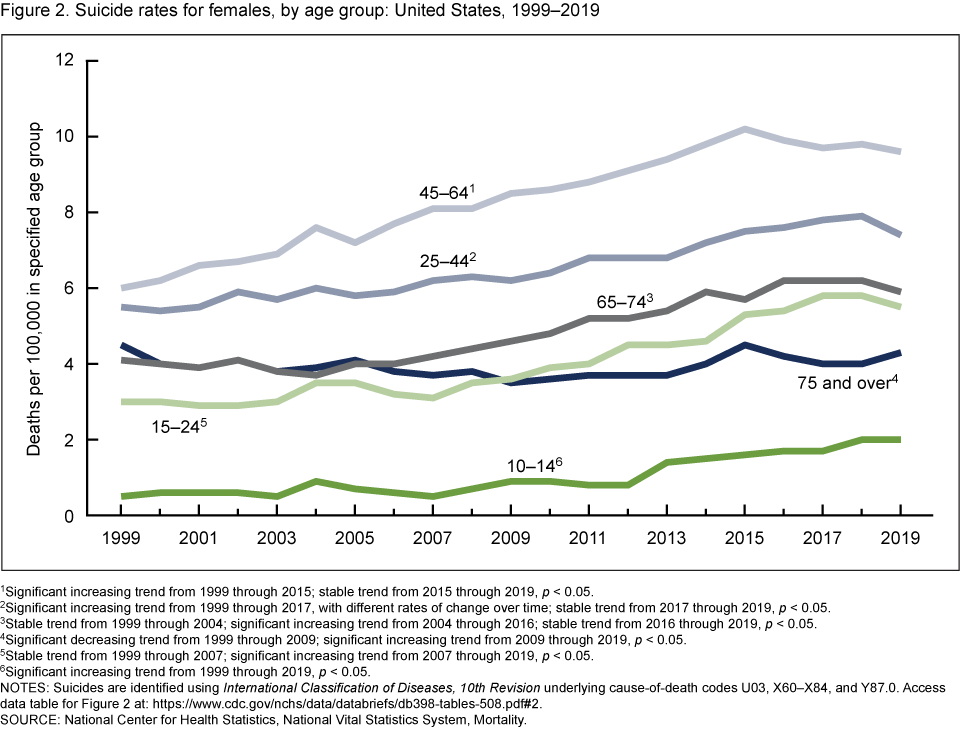 image icon
1Significant increasing trend from 1999 through 2015; stable trend from 2015 through 2019, p < 0.05.
2Significant increasing trend from 1999 through 2017, with different rates of change over time; stable trend from 2017 through 2019, p < 0.05.
3Stable trend from 1999 through 2004; significant increasing trend from 2004 through 2016; stable trend from 2016 through 2019, p < 0.05.
4Significant decreasing trend from 1999 through 2009; significant increasing trend from 2009 through 2019, p < 0.05.
5Stable trend from 1999 through 2007; significant increasing trend from 2007 through 2019, p < 0.05.
6Significant increasing trend from 1999 through 2019, p < 0.05.
NOTES: Suicides are identified using International Classification of Diseases, 10th Revision underlying cause-of-death codes U03, X60–X84, and Y87.0. Access data table for Figure 2pdf icon.
SOURCE: National Center for Health Statistics, National Vital Statistics System, Mortality.
Male suicide rates in 2019 were significantly lower than the rates in 2018 for age groups 10–14, 45–64, and 65–74.
- Generally, suicide rates among males increased between 1999 and 2019 for all age groups except men aged 75 and over. Patterns of increase varied by age group, with different rates of change over time (Figure 3).
- From 1999 through 2019, male suicide rates were highest for those aged 75 and over, decreasing from 42.4 per 100,000 in 1999 to 35.6 in 2009, then increasing to 39.9 in 2018 and 2019.
- From 1999 through 2019, male suicide rates were lowest for those aged 10–14, decreasing from 1.9 in 1999 to 1.2 in 2007, then increasing to 3.7 in 2018. The rate in 2019 (3.1) was significantly lower than the rate in 2018 (3.7).
- Male suicide rates in 2019 were significantly lower than the rates in 2018 for age groups 10–14, 45–64, and 65–74, and similar to the rates in 2018 for all other age groups.
Figure 3. Suicide rates for males, by age group: United States, 1999–2019
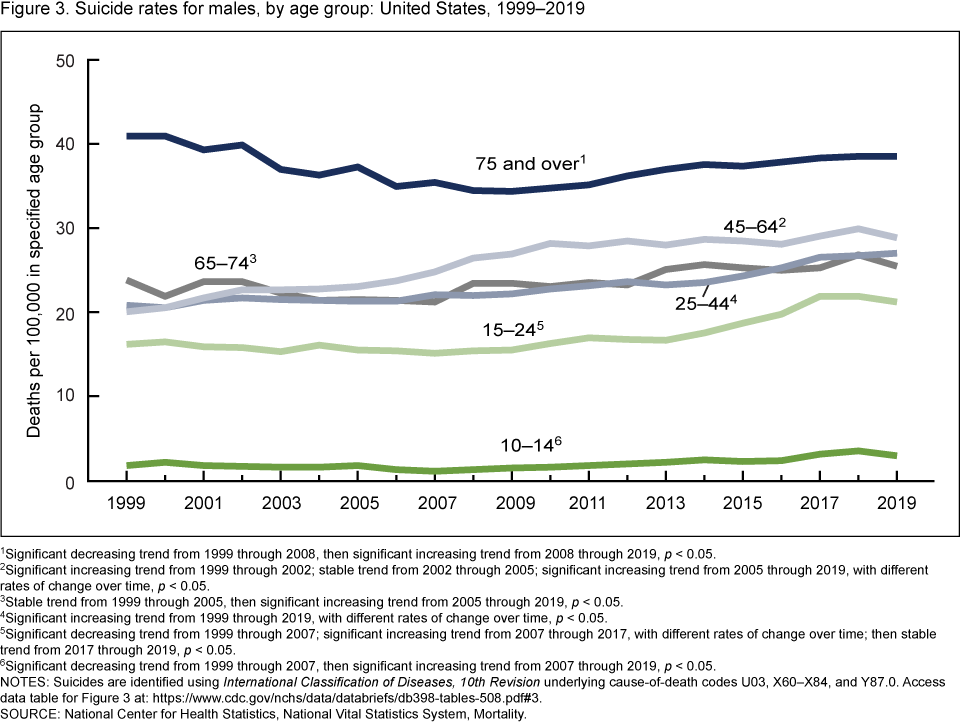 image icon
1Significant decreasing trend from 1999 through 2008, then significant increasing trend from 2008 through 2019, p < 0.05.
2Significant increasing trend from 1999 through 2002; stable trend from 2002 through 2005; significant increasing trend from 2005 through 2019, with different rates of change over time, p < 0.05.
3Stable trend from 1999 through 2005, then significant increasing trend from 2005 through 2019, p < 0.05.
4Significant increasing trend from 1999 through 2019, with different rates of change over time, p < 0.05.
5Significant decreasing trend from 1999 through 2007; significant increasing trend from 2007 through 2017, with different rates of change over time; then stable trend from 2017 through 2019, p < 0.05.
6Significant decreasing trend from 1999 through 2007, then significant increasing trend from 2007 through 2019, p < 0.05.
NOTES: Suicides are identified using International Classification of Diseases, 10th Revision underlying cause-of-death codes U03, X60–X84, and Y87.0. Access data table for Figure 3pdf icon.
SOURCE: National Center for Health Statistics, National Vital Statistics System, Mortality.
For females, the pattern in the means of suicide has changed in recent years.
- The age-adjusted rate for female suicide by poisoning increased from 1.4 per 100,000 in 1999 to 2.0 in 2015, then declined to 1.7 in 2018 and 2019 (Figure 4).
- Rates for suicide by firearm decreased from 1.5 in 1999 to 1.4 in 2007, increased to 1.9 in 2016, then remained stable through 2019 (1.8).
- Rates for suicide by suffocation (includes hanging, asphyxiation, strangulation, and other means of suffocation) tripled from 0.6 in 1999 to 1.8 in 2019.
- Similar to 2018, the 2019 rates for female suicide by firearm and suffocation were significantly higher than the rate for suicide by poisoning. This continues a recent pattern of a shift away from poisoning as the leading means of suicide for females.
Figure 4. Age-adjusted female suicide rates, by means of suicide: United States, 1999–2019
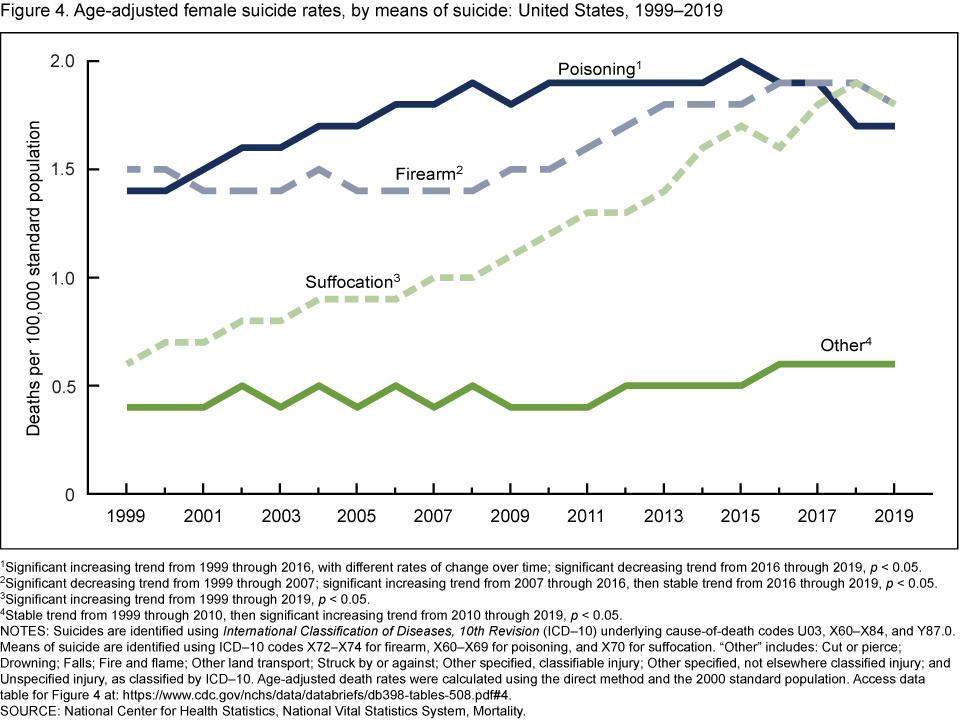 image icon
1Significant increasing trend from 1999 through 2016, with different rates of change over time; significant decreasing trend from 2016 through 2019, p < 0.05.
2Significant decreasing trend from 1999 through 2007; significant increasing trend from 2007 through 2016, then stable trend from 2016 through 2019, p < 0.05.
3Significant increasing trend from 1999 through 2019, p < 0.05.
4Stable trend from 1999 through 2010, then significant increasing trend from 2010 through 2019, p < 0.05.
NOTES: Suicides are identified using International Classification of Diseases, 10th Revision (ICD–10) underlying cause-of-death codes U03, X60–X84, and Y87.0. Means of suicide are identified using ICD–10 codes X72–X74 for firearm, X60–X69 for poisoning, and X70 for suffocation. “Other” includes: Cut or pierce; Drowning; Falls; Fire and flame; Other land transport; Struck by or against; Other specified, classifiable injury; Other specified, not elsewhere classified injury; and Unspecified injury, as classified by ICD–10. Age-adjusted death rates were calculated using the direct method and the 2000 standard population. Access data table for Figure 4pdf icon.
SOURCE: National Center for Health Statistics, National Vital Statistics System, Mortality.
For males, rates of suicide by firearm and suffocation have increased in recent years.
- Age-adjusted rates for male suicides by firearm decreased from 11.1 per 100,000 in 1999 to 10.3 in 2006, then increased to 12.3 in 2019. Throughout the period, the rates for suicide by firearm were higher than for other means (Figure 5).
- Rates for male suicides by suffocation doubled from 3.3 in 1999 to 6.6 in 2019.
- Rates for male suicides by poisoning increased from 2.1 in 1999 to 2.3 in 2010, then decreased to 1.8 in 2019.
Figure 5. Age-adjusted male suicide rates, by means of suicide: United States, 1999–2019
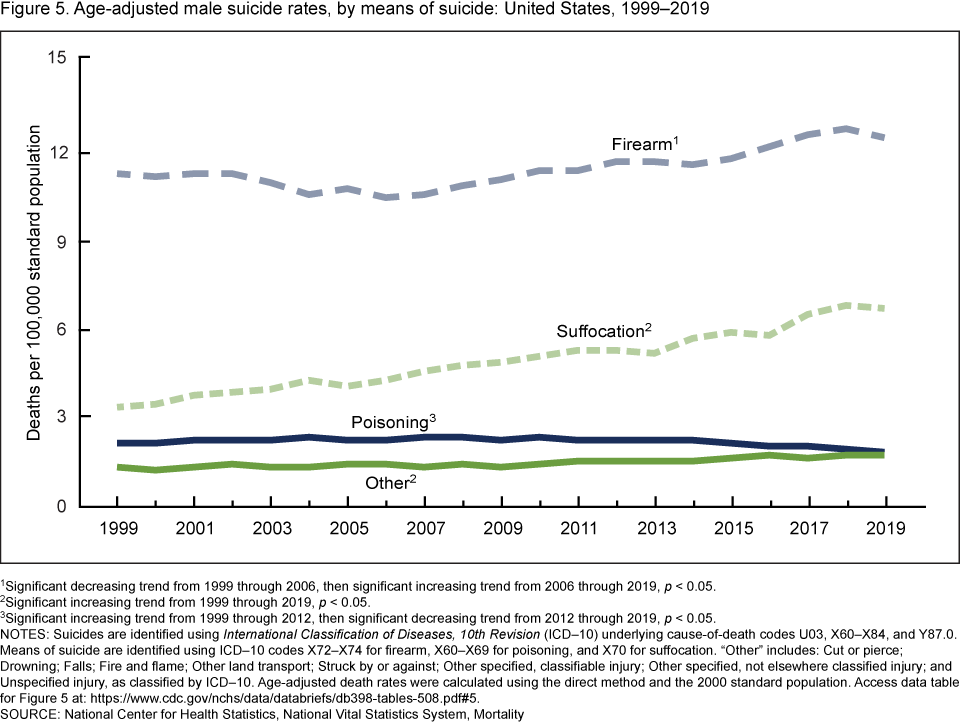 image icon
1Significant decreasing trend from 1999 through 2006, then significant increasing trend from 2006 through 2019, p < 0.05.
2Significant increasing trend from 1999 through 2019, p < 0.05.
3Significant increasing trend from 1999 through 2012, then significant decreasing trend from 2012 through 2019, p < 0.05.
NOTES: Suicides are identified using International Classification of Diseases, 10th Revision (ICD–10) underlying cause-of-death codes U03, X60–X84, and Y87.0. Means of suicide are identified using ICD–10 codes X72–X74 for firearm, X60–X69 for poisoning, and X70 for suffocation. “Other” includes: Cut or pierce; Drowning; Falls; Fire and flame; Other land transport; Struck by or against; Other specified, classifiable injury; Other specified, not elsewhere classified injury; and Unspecified injury, as classified by ICD–10. Age-adjusted death rates were calculated using the direct method and the 2000 standard population. Access data table for Figure 5pdf icon.
SOURCE: National Center for Health Statistics, National Vital Statistics System, Mortality.
Summary
This report highlights trends in suicide rates from 1999 through 2019. During this period, the age-adjusted suicide rate increased 35% from 10.5 per 100,000 standard population in 1999 to 14.2 in 2018. The suicide rate in 2019 (13.9) was significantly lower (2%) than the rate in 2018. Suicide rates were consistently higher for males compared with females throughout the study period. For both males and females, the age-adjusted suicide rates in 2019 were significantly lower than the rates in 2018.
Suicide rates by sex and age group remained stable or declined from 2018 through 2019. For females, the 2019 suicide rates were similar to the 2018 rates for all age groups except 25–44. For this group, the rate in 2019 was significantly lower than the rate in 2018. Male suicide rates in 2019 were significantly lower than the rates in 2018 for age groups 10–14, 45–64, and 65–74, and similar to the rates in 2018 for age groups 15–24, 25–44, and 75 and over.
For females, suicides involving firearms and suffocation have replaced poisoning as the leading means of suicide in recent years due to a decline in suicides by poisoning beginning in 2016, and an increase in the rates of suicide by firearm and by suffocation. From 1999 through 2019, rates for males were highest for suicide by firearms, however during this period, the rates for suicide by suffocation saw the largest percent increase, doubling from 3.3 in 1999 to 6.6 in 2019.
Data source and methods
Data were analyzed using the National Vital Statistics System multiple cause-of-death mortality files for 1999 through 2019 (7). Suicide deaths were identified using International Classification of Diseases, 10th Revision (ICD–10) underlying cause-of-death codes U03, X60–X84, and Y87.0 (8). Means of suicide were identified using ICD–10 codes X72–X74 for firearm, X60–X69 for poisoning, and X70 for suffocation. “Other” includes: Cut or pierce; Drowning; Falls; Fire and flame; Other land transport; Struck by or against; Other specified, classifiable injury; Other specified, not elsewhere classified injury; and Unspecified injury, as classified by ICD–10.
Age-adjusted death rates were calculated using the direct method and the 2000 U.S. standard population (9). Suicides for persons aged 5–9 years were included in the total numbers and age-adjusted rates, but not shown as part of age-specific numbers or rates due to the small number of suicides per year among this age group.
Trends in death rates were evaluated using the Joinpoint Regression Program (4.8.0.1) (10). The Joinpoint software was used to fit weighted least-squares regression models to the estimated proportions on the logarithmic scale. Using the default settings, which allowed for as few as two observed time points in the beginning, ending, and middle line segments (excluding the joinpoints), a maximum of three joinpoints were searched for using the grid search algorithm and the permutation test and an overall alpha level of 0.05 (11). Pairwise comparisons of rates were conducted using the z test with an alpha level of 0.05 (9).
About the authors
Holly Hedegaard is with the National Center for Health Statistics (NCHS), Division of Analysis and Epidemiology, and Sally C. Curtin and Margaret Warner are with NCHS, Division of Vital Statistics.
References
- Kochanek KD, Xu JQ, Arias E. Mortality in the United States, 2019pdf icon. NCHS Data Brief, no 395. Hyattsville, MD: National Center for Health Statistics. 2020.
- Centers for Disease Control and Prevention. WISQARS. Ten leading causes of death by age group.
- Hedegaard H, Curtin SC, Warner M. Increase in suicide mortality in the United States, 1999–2018pdf icon. NCHS Data Brief, no 362. Hyattsville, MD: National Center for Health Statistics. 2020.
- Pettrone K, Curtin SC. Urban–rural differences in suicide rates, by sex and three leading methods: United States, 2000–2018pdf icon. NCHS Data Brief, no 373. Hyattsville, MD: National Center for Health Statistics. 2020.
- Curtin SC, Heron M. Death rates due to suicide and homicide among persons aged 10–24: United States, 2000–2017pdf icon. NCHS Data Brief, no 352. Hyattsville, MD: National Center for Health Statistics. 2019.
- Stone DM, Simon TR, Fowler KA, Kegler SR, Yuan K, Holland KM, et al. Vital signs: Trends in state suicide rates—United States, 1999–2016 and circumstances contributing to suicide—27 states, 2015pdf icon. MMWR Morb Mortal Wkly Rep 67(22):617–24. 2018.
- National Center for Health Statistics. Public-use data files: Mortality multiple cause files. 2019.
- World Health Organization. International statistical classification of diseases and related health problems, 10th revision (ICD–10). 2008 ed. Geneva, Switzerland. 2009.
- Kochanek KD, Murphy SL, Xu JQ, Arias E. Deaths: Final data for 2017pdf icon. National Vital Statistics Reports; vol 68 no 9. Hyattsville, MD: National Center for Health Statistics. 2019.
- National Cancer Institute. Joinpoint Regression Program (Version 4.8.0.1) [computer software]. 2020.
- Ingram DD, Malec DJ, Makuc DM, Kruszon-Moran D, Gindi RM, Albert M, et al. National Center for Health Statistics guidelines for analysis of trendspdf icon. National Center for Health Statistics. Vital Health Stat 2(179). 2018.
Suggested citation
Hedegaard H, Curtin SC, Warner M. Suicide mortality in the United States, 1999–2019. NCHS Data Brief, no 398. Hyattsville, MD: National Center for Health Statistics. 2021. DOI: https://dx.doi.org/10.15620/cdc:101761external icon.
Copyright information
All material appearing in this report is in the public domain and may be reproduced or copied without permission; citation as to source, however, is appreciated.
National Center for Health Statistics
Brian C. Moyer, Ph.D., Director
Amy M. Branum, Ph.D., Acting Associate Director for Science
Division of Analysis and Epidemiology
Irma E. Arispe, Ph.D., Director
Kevin C. Heslin, Ph.D., Associate Director for Science
Division of Vital Statistics
Steven Schwartz, Ph.D., Director
Isabelle Horon, Dr.P.H., Acting Associate Director for Science