Current Contraceptive Status Among Women Aged 15–49: United States, 2017–2019
- Key findings
- In 2017–2019, approximately 65% of women aged 15–49 were currently using contraception.
- Female sterilization, the pill, the male condom, and LARCs were the most common methods women reported currently using in 2017–2019.
- Current use of female sterilization, the pill, the male condom, and LARCs varied by age.
- Current use of the pill and the male condom varied by Hispanic origin and race.
- Current use of female sterilization, the pill, and LARCs varied by educational attainment while male condom use did not.
- Summary
- Definitions
- Data source and methods
- About the authors
- References
- Suggested citation
NCHS Data Brief No. 388, October 2020
PDF Versionpdf icon (428 KB) | Visual Abstract
Kimberly Daniels, Ph.D., and Joyce C. Abma, Ph.D.
Key findings
Data from the 2017–2019 National Survey of Family Growth
- In 2017–2019, 65.3% of women aged 15–49 in the United States were currently using contraception.
- The most common contraceptive methods currently used were female sterilization (18.1%), oral contraceptive pills (14.0%), long-acting reversible contraceptives (LARCs) (10.4%), and the male condom (8.4%).
- Use of LARCs was higher among women aged 20–29 (13.7%) and 30–39 (12.7%) compared with women aged 15–19 (5.8%) and 40–49 (6.6%).
- Current condom use was higher among Hispanic women (10.5%) and non-Hispanic black women (11.0%) compared with non-Hispanic white women (7.0%).
- With higher education, female sterilization declined and use of the pill increased.
Nearly all women use contraception in their lifetimes (1), although at any given time, they may not be using contraception for reasons such as seeking pregnancy, being pregnant or postpartum, or not being sexually active. Using data from the 2017–2019 National Survey of Family Growth (NSFG), this report provides a snapshot of current contraceptive status, in the month of interview, among women aged 15–49 in the United States. In addition to describing use of any method by age, Hispanic origin and race, and education, patterns of use are described for the four most commonly used contraceptive methods: female sterilization; oral contraceptive pills; long-acting reversible contraceptives (LARCs), which include contra-ceptive implants and intrauterine devices; and the male condom.
Keywords: pill, condom, LARC, National Survey of Family Growth
In 2017–2019, approximately 65% of women aged 15–49 were currently using contraception.
- In 2017–2019, 65.3% of women aged 15–49 in the United States were currently using a method of contraception (Figure 1).
- Current contraceptive use increased with age, from 38.7% among women aged 15–19 to 74.8% among women aged 40–49.
- The percentage of non-Hispanic white women currently using contraception (69.2%) was higher compared with non-Hispanic black (61.4%) and Hispanic (60.5%) women.
- Current contraceptive use did not differ significantly across education (69.1%–71.3%).
Figure 1. Percentage of women currently using any contraceptive method among all women aged 15–49 and by age group, Hispanic origin and race, and education: United States, 2017–2019
image icon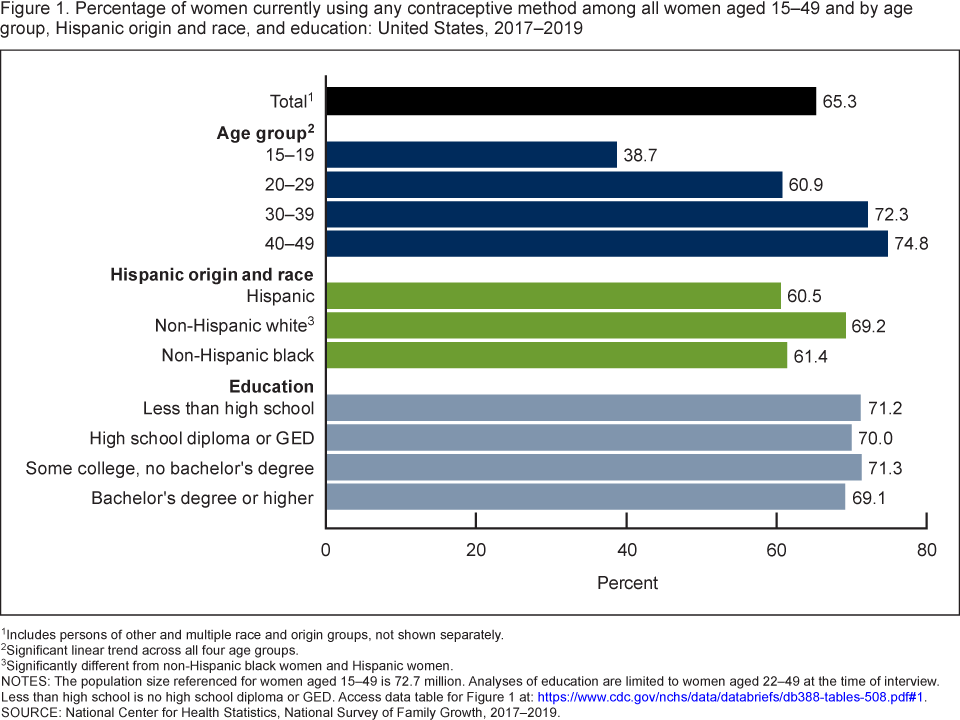 image icon
1Includes persons of other and multiple race and origin groups, not shown separately.
2Significant linear trend across all four age groups.
3Significantly different from non-Hispanic black women and Hispanic women.
NOTES: The population size referenced for women aged 15–49 is 72.7 million. Analyses of education are limited to women aged 22–49 at the time of interview. Less than high school is no high school diploma or GED. Access data table for Figure 1pdf icon.
SOURCE: National Center for Health Statistics, National Survey of Family Growth, 2017–2019.
Female sterilization, the pill, the male condom, and LARCs were the most common methods women reported currently using in 2017–2019.
- The most common contraceptive methods currently used among women aged 15–49 were female sterilization (18.1%), the pill (14.0%), LARCs (10.4%), and the male condom (8.4%) (Figure 2).
- In 2017–2019, approximately 35% of women aged 15–49 were not currently using contraception, including for reasons such as seeking pregnancy, being pregnant or postpartum, or not being sexually active.
Figure 2. Percent distribution of women aged 15–49, by current contraceptive status: United States, 2017–201
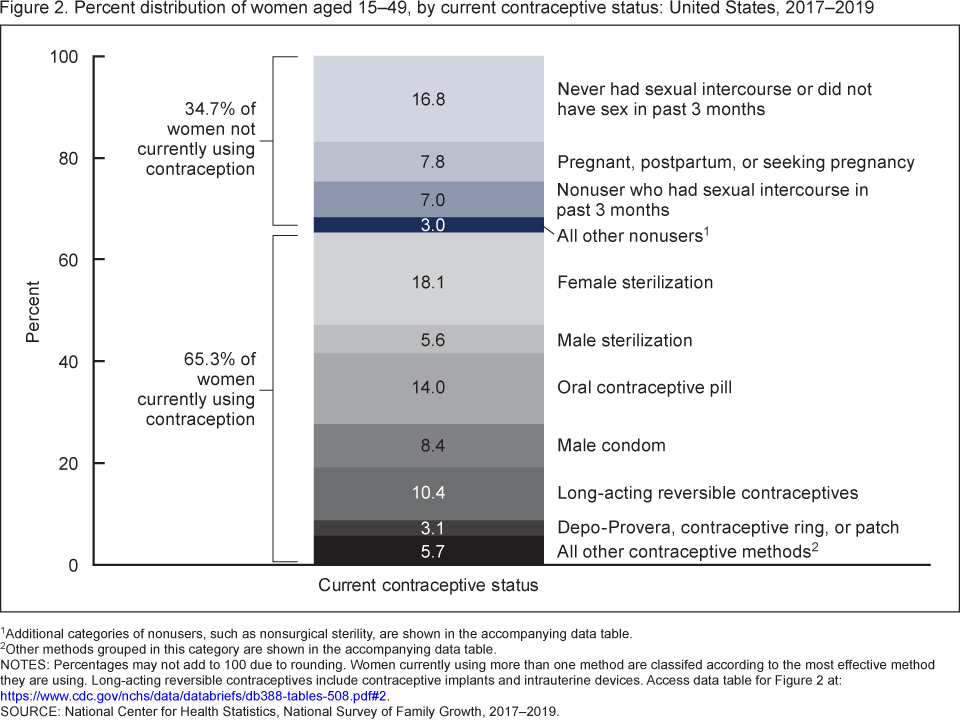
1Additional categories of nonusers, such as nonsurgical sterility, are shown in the accompanying data table.
2Other methods grouped in this category are shown in the accompanying data table.
NOTES: Percentages may not add to 100 due to rounding. Women currently using more than one method are classifed according to the most effective method they are using. Long-acting reversible contraceptives include contraceptive implants and intrauterine devices. Access data table for Figure 2pdf icon.
SOURCE: National Center for Health Statistics, National Survey of Family Growth, 2017–2019.
Current use of female sterilization, the pill, the male condom, and LARCs varied by age.
- Among women aged 20 and over, female sterilization increased with increasing age
(Figure 3). Roughly 2 in 5 women aged 40–49 (39.1%) were relying on female sterilization for contraception compared with 1 in 5 women aged 30–39 (21.2%). - Pill use generally decreased with increasing age: 19.5% of women aged 15–19 and 21.6% of women aged 20–29 were currently using the pill compared with 10.9% of those aged 30–39, and 6.5% of women aged 40–49.
- Condom use was similar among women aged 20–29 (10.4%) and 30–39 (9.7%); use was lower among women aged 15–19 (5.1%) and 40–49 (6.5%). The observed difference between women aged 15–19 and those aged 40–49 was not statistically significant.
- Use of LARCs was similar among women aged 20–29 (13.7%) and 30–39 (12.7%). Compared with these age groups, use was lower among women aged 15–19 (5.8%) and 40–49 (6.6%).
Figure 3. Percentage of all women aged 15–49 who were currently using female sterilization, oral contraceptive pills, the male condom, or long-acting reversible contraceptives, by age group: United States, 2017–2019
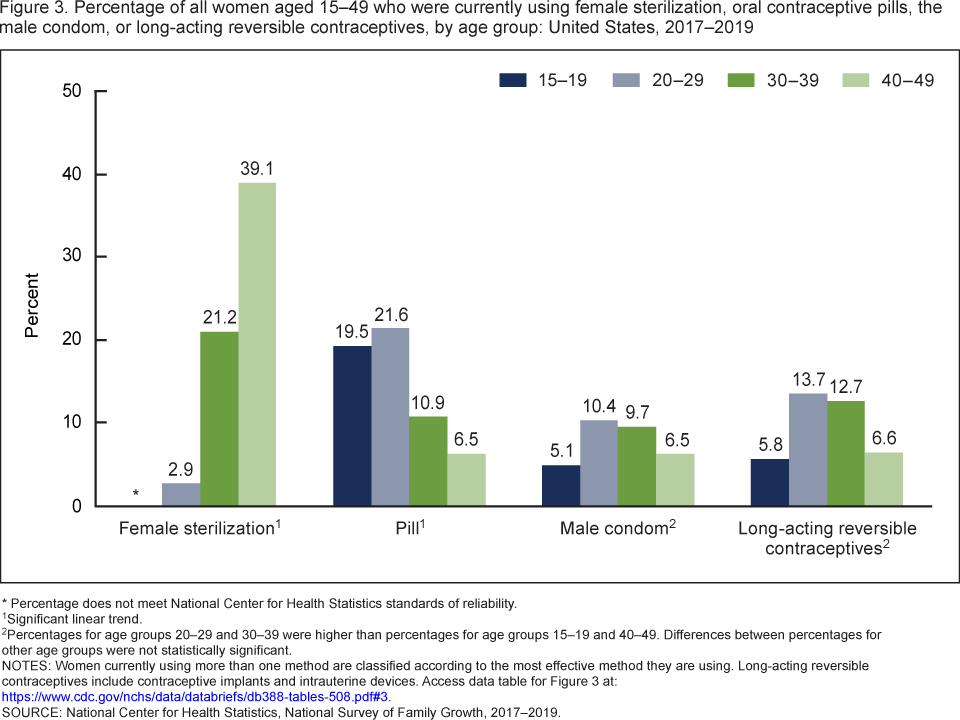
* Percentage does not meet National Center for Health Statistics standards of reliability.
1Significant linear trend.
2Percentages for age groups 20–29 and 30–39 were higher than percentages for age groups 15–19 and 40–49. Differences between percentages for other age groups were not statistically significant.
NOTES: Women currently using more than one method are classified according to the most effective method they are using. Long-acting reversible contraceptives include contraceptive implants and intrauterine devices. Access data table for Figure 3pdf icon.
SOURCE: National Center for Health Statistics, National Survey of Family Growth, 2017–2019.
Current use of the pill and the male condom varied by Hispanic origin and race.
- Female sterilization did not differ significantly across Hispanic-origin and race groups: 19.9% among Hispanic, 18.5% among non-Hispanic white, and 17.6% among non-Hispanic black women (Figure 4).
- Current use of the pill was higher among non-Hispanic white women (17.8%) than among Hispanic (7.9%) and non-Hispanic black (8.1%) women.
- Current condom use was lower among non-Hispanic white women (7.0%) compared with Hispanic (10.5%) and non-Hispanic black (11.0%) women.
- Current use of LARCs did not significantly differ across the Hispanic-origin and race groups shown, around 10%–11%.
Figure 4. Percentage of all women aged 15–49 who were currently using female sterilization, oral contraceptive pills, the male condom, or long-acting reversible contraceptives, by Hispanic origin and race: United States, 2017–2019
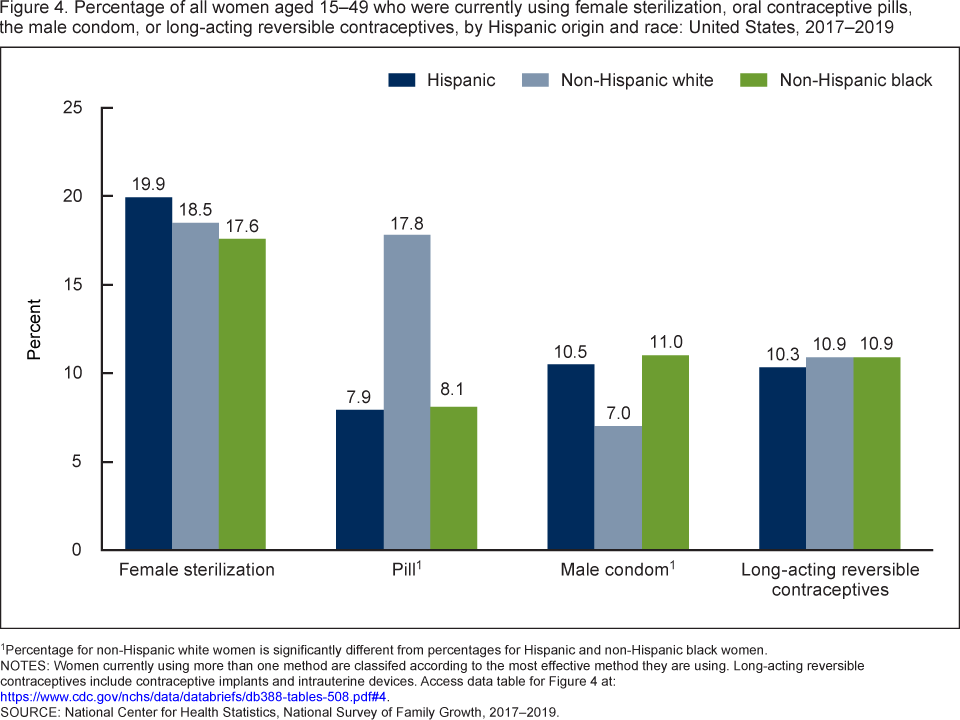
1Percentage for non-Hispanic white women is significantly different from percentages for Hispanic and non-Hispanic black women.
NOTES: Women currently using more than one method are classifed according to the most effective method they are using. Long-acting reversible contraceptives include contraceptive implants and intrauterine devices. Access data table for Figure 4pdf icon.
SOURCE: National Center for Health Statistics, National Survey of Family Growth, 2017–2019.
Current use of female sterilization, the pill, and LARCs varied by educational attainment while male condom use did not.
- Among women aged 22–49, female sterilization declined with higher education, from 39.9% among women without a high school diploma or GED to 12.1% of women with a bachelor’s degree or higher (Figure 5).
- Current pill use increased with higher education: 18.1% of women with a bachelor’s degree or higher were using the pill compared with 5.7% of women without a high school diploma or GED.
- Current male condom use was similar across education, around 9%.
- Current use of LARCs was higher for women with some college but no bachelor’s degree (12.5%) and women with a bachelor’s degree or higher (13.1%) compared with women with a high school diploma or GED (7.9%), but was not significantly different from use among women without a high school diploma or GED (9.3%).
Figure 5. Percentage of all women aged 22–49 who were currently using female sterilization, oral contraceptive pills, the male condom, or long-acting reversible contraceptives, by educational attainment: United States, 2017–2019

1Significant linear trend.
2Percentages for some college, no bachelor’s degree and bachelor’s degree or higher are significantly different from that for high school diploma or GED.
NOTES: Women currently using more than one method are classifed according to the most effective method they are using. Long-acting reversiblecontraceptives include contraceptive implants and intrauterine devices. Access data table for Figure 5pdf icon.
SOURCE: National Center for Health Statistics, National Survey of Family Growth, 2017–2019.
Summary
In 2017–2019, approximately 65% of women aged 15–49 were using some type of contraceptive method, while 35% were not currently using a method. Current use of any method of contraception was higher among older women and non-Hispanic white women compared with younger women and Hispanic and non-Hispanic black women. The most com-monly used methods were female sterilization (18.1%), oral contraceptive pills (14.0%), LARCs (10.4%), and the male con-dom (8.4%). Use of these methods varied across age, Hispanic origin and race, and education.
Understanding variation in contraceptive use across social and demographic characteristics offers potential insight into larger fertility patterns, including birth rates and incidence of unintended pregnancies. The chance that a woman not seek-ing a pregnancy will have an unintended pregnancy varies by whether any method of contraception is used and which method she or her partner uses (2).
Definitions
Age: The respondent’s age at the time of the interview. The recode variable used was AGER.
Current contraceptive status: Measures contraceptive status in the month of the interview (not at a specific act of sexual intercourse). This variable includes either use of specific methods or, if the woman did not use a method in the month of interview, nonuse of contraceptive methods using the following subcategories: pregnant, seeking pregnancy, postpartum, noncontraceptive sterility, sexual inactivity (ever or in the past 3 months), or sexually active in the past 3 months and no method used in the month of interview. In this report, as in prior NSFG reports, women who were currently using more than one method are classified by the method that was most effective in preventing pregnancy, because that method has the greatest impact on their risk of unintended pregnancy (2). For example, women who report using both oral contraceptive pills and male condoms in the current month are classified as using pills, because pills are more effective at preventing pregnancy. In 2017–2019, 11.2% of women who were currently using contraception used more than one contraceptive method during the same month. The recode variable used was CONSTAT1. Although not done in this report, this set of re-codes (CONSTAT1–CONSTAT4 for each method used in the month of interview) also allows for analyses of any use of each specific method.
Education: Educational attainment at the time of interview, indicating the highest degree earned or grade finished. Results by education are presented only for women aged 22 and over, as many younger women have not completed their educa-tion (79.5% of women aged 15–21 were in school at the time of interview, analysis not shown). The recode variable used was HIEDUC.
Hispanic origin and race: The 1997 Office of Management and Budget guidelines for the presentation of race and Hispan-ic-origin data in federal statistics are used for these classifications (3). The guidelines allowing respondents to report more than one race or ethnic origin are followed in the recode variable, HISPRACE2. Given the diversity of women categorized as
non-Hispanic other single and multiple race, those results are not shown here, and the report presents results only for women who are Hispanic, non-Hispanic white single race, and
non-Hispanic black single race.
Data source and methods
This report is primarily based on data from the 6,141 women in the female respondent file of the 2017–2019 NSFG and pro-vides an update of an earlier 2015–2017 NSFG report on current contraceptive status (4). Among other information, NSFG provides detailed information about contraceptive use among U.S. women aged 15–49. The fieldwork plan, interview con-tent, and other survey procedures are similar to previous surveys (5). NSFG is jointly planned and funded by the National Center for Health Statistics (NCHS) and several other programs of the U.S. Department of Health and Human Services. All estimates in this report are weighted to reflect the female household population aged 15–49 of the United States at the midpoint of 2017–2019 interviewing (July 2018). The response rate for the 2017–2019 NSFG was 63.4% overall, 65.2% for female respondents, and 61.4% for male respondents.
Statistics for this report were produced using the SURVEY procedures in SAS software version 9.4. Percentages were com-pared using two-tailed t tests at the 5% level. No adjustments were made for multiple comparisons. Survey clusters minus strata were used as the degrees of freedom for significance testing of pairwise comparisons. A weighted least squares re-gression was used to test for linear trends across age and education using the number of categories minus two as the de-grees of freedom. If no linear trend was found across age and education, limited pairwise comparisons were tested. Statis-tical power to detect differences between groups was limited for some comparisons. The data presented in this report are bivariate associations that may be explained by other factors not controlled for in the figures or included in the report. For example, women at older ages are more likely to have completed their childbearing compared with women at younger ag-es. Therefore, women at younger ages would be more likely to choose nonpermanent contraceptive methods including the pill, male condom, and LARCs compared with female sterilization, a mostly permanent form of contraception (4,6). Some of the differences in contraceptive use by age, particularly use of barrier methods such as the condom, may be explained by differences in sexual activity. For example, 67.6% of females aged 15–19 did not have sex in the past 3 months compared with 20.9% of women aged 20–49 (analysis not shown). All estimates presented meet NCHS guidelines for presentation of proportions (7).
About the authors
Kimberly Daniels and Joyce C. Abma are with the National Center for Health Statistics, Division of Vital Statistics, Reproductive Statistics Branch.
References
- Daniels K, Mosher WD, Jones J. Contraceptive methods women have ever used: United States, 1982–2010. National Health Statistics Reports; no 62. Hyattsville, MD: National Center for Health Statistics. 2013.
- Sundaram A, Vaughn B, Kost K, Bankole A, Finer L, Singh S, Trussell J. Contraceptive failure in the United States: Estimates from the 2006–2010 National Survey of Family Growth. Perspect Sex Reprod Health 49(1):7–16. 2017.
- Office of Management and Budget. Revisions to the standards for the classification of federal data on race and ethnicitypdf iconexternal icon. Fed Regist 62(210):58781–90. 1997.
- Daniels K, Abma JC. Current contraceptive status among women aged 15–49: United States, 2015–2017. NCHS Data Brief, no 327. Hyattsville, MD: National Center for Health Statistics. 2018.
- National Center for Health Statistics. 2015–2017 National Survey of Family Growth (NSFG): Summary of design and data collection methodspdf icon. Hyattsville, MD.
- Daniels K, Daugherty J, Jones J, Mosher W. Current contraceptive use and variation by selected characteristics among women aged 15–44: United States, 2011–2013. National Health Statistics Reports; no 86. Hyattsville, MD: National Center for Health Statistics. 2015.
- Parker JD, Talih M, Malec DJ, Beresovsky V, Carroll M, Gonzalez JF Jr, et al. National Center for Health Statistics data presentation standards for proportions. National Center for Health Statistics. Vital Health Stat 2(175). 2017.
Suggested citation
Daniels K, Abma JC. Current contraceptive status among women aged 15–49: United States, 2017–2019. NCHS Data Brief, no 388. Hyattsville, MD: National Center for Health Statistics. 2020.
Copyright information
All material appearing in this report is in the public domain and may be reproduced or copied without permission; citation as to source, however, is appreciated.
National Center for Health Statistics
Brian C. Moyer, Ph.D., Director
Amy M. Branum, Ph.D., Acting Associate Director for Science
Division of Vital Statistics
Steven Schwartz, Ph.D., Director
Isabelle Horon, Dr.P.H., Acting Associate Director for Science