Hypertension, High Serum Total Cholesterol, and Diabetes: Racial and Ethnic Prevalence Differences in U.S. Adults, 1999-2006
- Key findings
- Does hypertension, hypercholesterolemia, or diabetes vary by race/ethnicity?
- What proportion of U.S. adults has comorbid hypertension, hypercholesterolemia, or diabetes?
- Does the number of comorbid conditions vary by race/ethnicity?
- What is the burden of undiagnosed hypertension, hypercholesterolemia, or diabetes in U.S. adults?
- What proportions of U.S. adults have comorbid undiagnosed hypertension, hypercholesterolemia, or diabetes?
- Summary
- Definitions
- Data source and methods
- About the authors
- References
- Suggested citation
NCHS Data Brief No. 36, April 2010
PDF Versionpdf icon (1.1 MB)
Cheryl D. Fryar, M.S.P.H.; Rosemarie Hirsch, M.D., M.P.H.; Mark S. Eberhardt, Ph.D.; Sung Sug Yoon, Ph.D.; and Jacqueline D. Wright, Dr.P.H.
Key findings
- Forty-five percent of adults had at least one of three diagnosed or undiagnosed chronic conditions—hypertension, hypercholesterolemia, or diabetes; one in eight adults (13%) had two of these conditions; and 3% of adults had all three chronic conditions.
- Nearly one in seven U.S. adults (15%) had one or more of these conditions undiagnosed.
- Non-Hispanic black persons were more likely than non-Hispanic white and Mexican-American persons to have at least one of the three conditions (diagnosed or undiagnosed).
- Non-Hispanic black and non-Hispanic white persons were more likely than Mexican-American persons to have both diagnosed or undiagnosed hypertension and hyper-cholesterolemia. Non-Hispanic black and Mexican-American persons were more likely than non-Hispanic white persons to have both diagnosed or undiagnosed hypertension and diabetes.
Eliminating health disparities among different segments of the population is one of two overarching goals of both Healthy People 2010 and 2020 (1). Race/ethnicity differences in health care and chronic diseases have been well documented (2,3). Hypertension, hypercholesterolemia, and diabetes are all chronic conditions associated with cardiovascular disease, the leading cause of death in the United States. The co-occurrence of these three chronic conditions by race/ethnicity has been less frequently documented. In addition, reliance on only self-reported diagnosis results in an underestimate of the prevalence of these conditions. The objective of this report is to compare the prevalence of diagnosed and undiagnosed hypertension, hypercholesterolemia, and diabetes among three racial/ethnic groups and the prevalence of co-morbidity of these conditions for U.S. adults.
Keywords: chronic conditions, hypercholesterolemia, comorbidity
Does hypertension, hypercholesterolemia, or diabetes vary by race/ethnicity?
The prevalence of diagnosed or undiagnosed hypertension, hypercholesterolemia, and diabetes varies by racial/ethnic group (Figure 1).
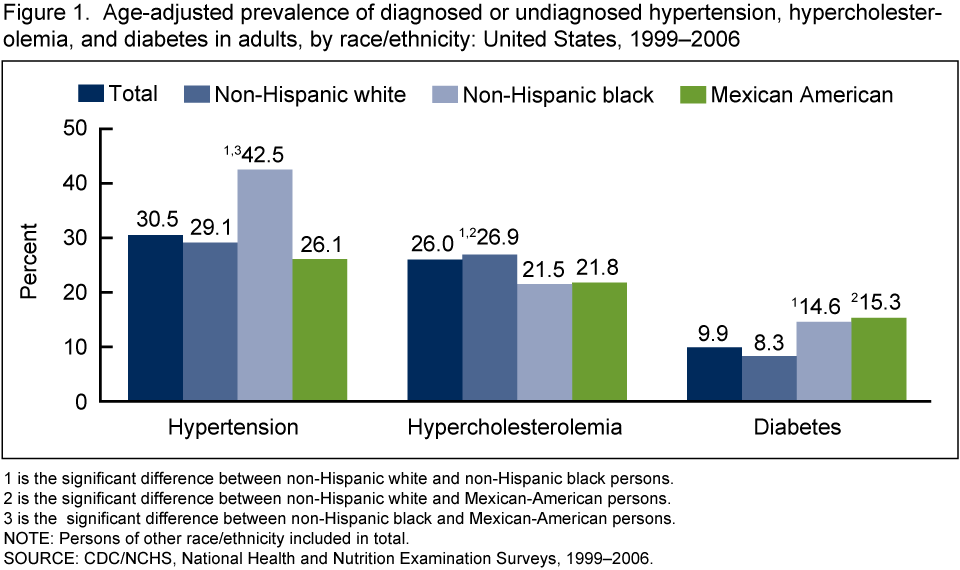 image icon
Non-Hispanic black persons (42.5%) have a significantly higher prevalence of hypertension compared with non-Hispanic white (29.1%) and Mexican-American persons (26.1%). Non-Hispanic white persons (26.9%) have a significantly higher prevalence of hypercholesterolemia compared with non-Hispanic black (21.5%) and Mexican-American persons (21.8%). Non-Hispanic black (14.6%) and Mexican-American persons (15.3%) have a significantly higher prevalence of diabetes than do non-Hispanic white persons (9.9%).
What proportion of U.S. adults has comorbid hypertension, hypercholesterolemia, or diabetes?
Overall, 45% of U.S. adults have at least one of three diagnosed or undiagnosed conditions (hypertension, hypercholesterolemia, or diabetes) (Figure 2). Approximately 3% of U.S. adults have all three conditions and 13% have two conditions. Both hypertension and hypercholesterolemia were present in 9% of adults; 3% of adults have both hypertension and diabetes; and 1.5% of adults have both diabetes and hypercholesterolemia (Figure 3).
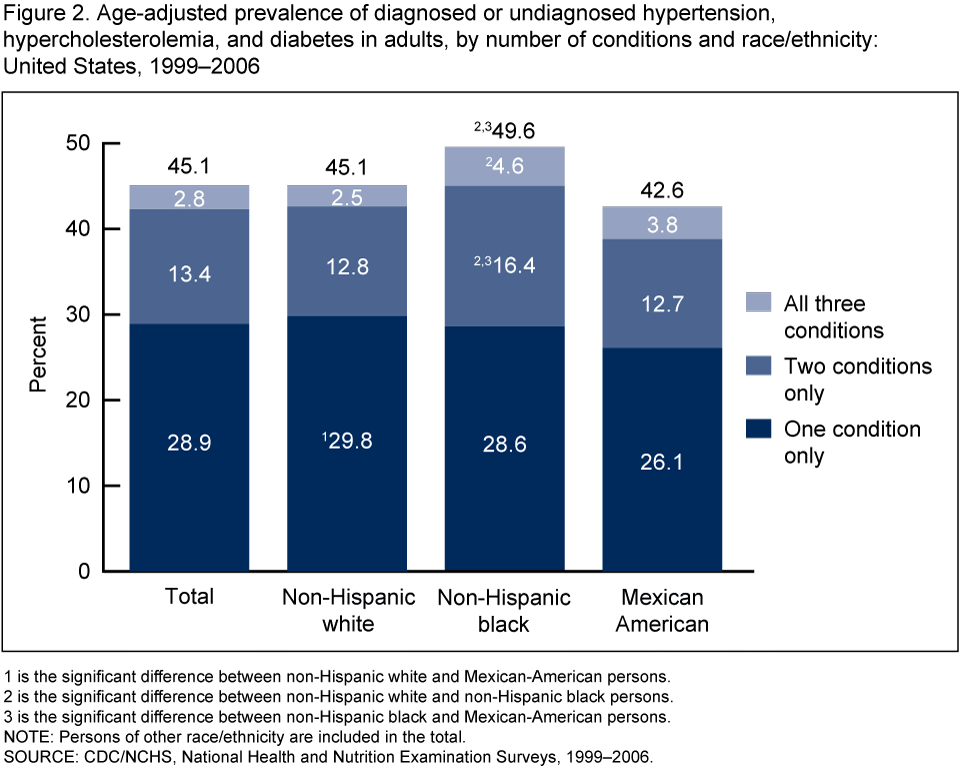 image icon
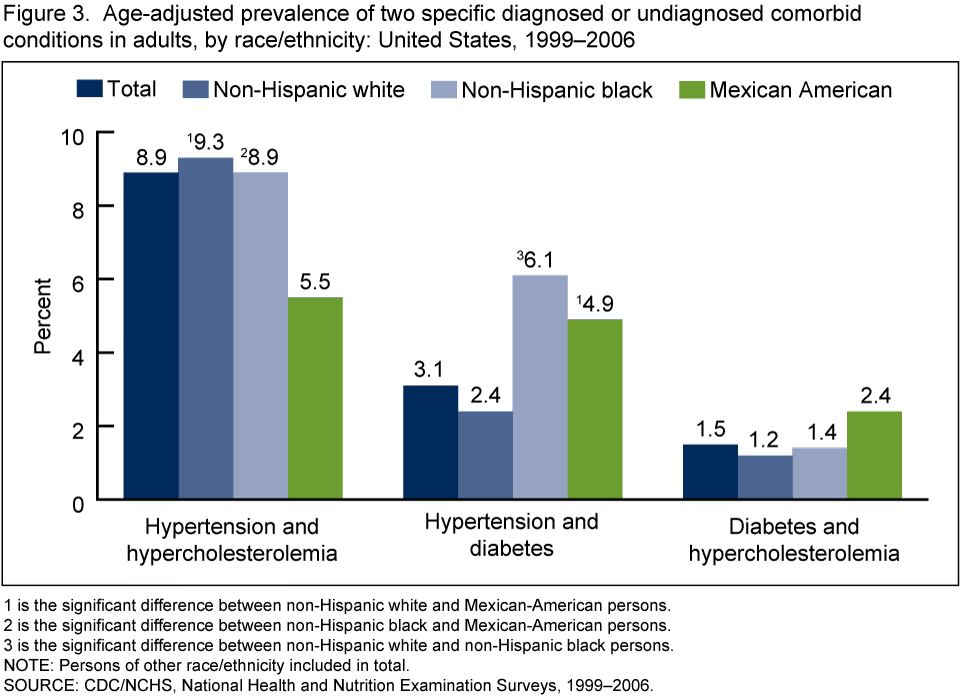 image icon
Does the number of comorbid conditions vary by race/ethnicity?
Non-Hispanic black persons (49.6%) were more likely than non-Hispanic white (45.1%) and Mexican-American persons (42.6%) to have at least one of three diagnosed or undiagnosed conditions (hypertension, hypercholesterolemia, or diabetes) (Figure 2).
Non-Hispanic white persons (29.8%) were more likely to have only one condition compared with Mexican-American persons (26.1%). Non-Hispanic black persons (16.4%) were more likely to have two comorbid conditions compared with non-Hispanic white persons (12.8%) and Mexican-American persons (12.7%). Non-Hispanic black persons (4.6%) were also more likely to have all three conditions compared with non-Hispanic white persons (2.5%).
For adults with only two of the conditions (Figure 3), non-Hispanic black (8.9%) and non-Hispanic white persons (9.3 %) were more likely to have both hypertension and hypercholesterolemia than were Mexican-American persons (5.5%). Non-Hispanic black (6.1%) and Mexican-American persons (4.9%) were more likely to have both hypertension and diabetes than were non-Hispanic white persons (2.9%). There was no statistically significant race/ethnicity difference among those having both diagnosed and undiagnosed diabetes and hypercholesterolemia.
What is the burden of undiagnosed hypertension, hypercholesterolemia, or diabetes in U.S. adults?
Approximately 8% of U.S. adults have undiagnosed hypertension, 8% have undiagnosed hypercholesterolemia, and 3% have undiagnosed diabetes. The proportion of U.S. adults who have undiagnosed hypertension, hypercholesterolemia, or diabetes was similar across racial/ethnic groups.
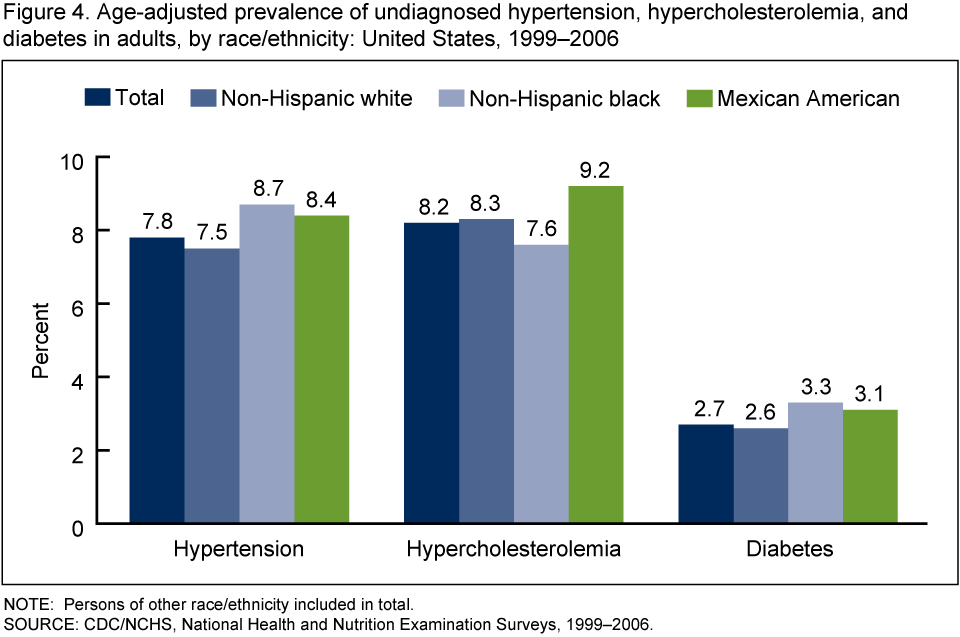 image icon
What proportions of U.S. adults have comorbid undiagnosed hypertension, hypercholesterolemia, or diabetes?
In over 15% of U.S. adults one or more of the three conditions was undiagnosed. The proportion of adults having one or more of these undiagnosed conditions was similar across racial/ethnic groups.
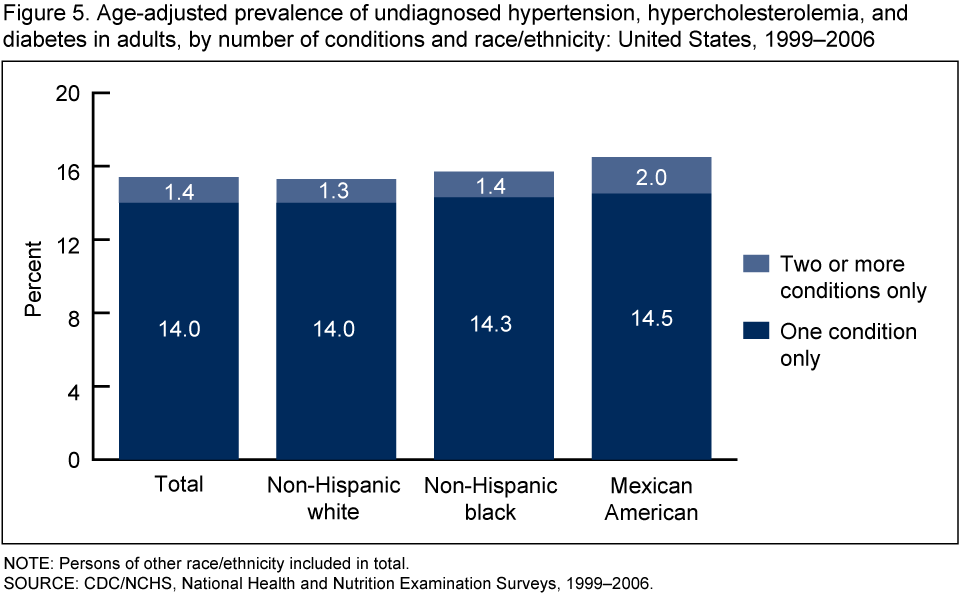 image icon
Summary
Overall, 45% of U.S. adults aged 20 and over have one of the three following diagnosed or undiagnosed chronic conditions—hypertension, hypercholesterolemia, or diabetes. Non-Hispanic black persons were more likely than non-Hispanic white and Mexican-American persons to have at least one of these three conditions. These findings indicate that a high percentage of the population have a condition associated with heart disease, the leading cause of death in the United States.
The prevalence of the comorbidity of diagnosed or undiagnosed hypertension, hypercholesterolemia, and diabetes varies by race/ethnicity. Non-Hispanic white persons were more likely to have only one of the three conditions compared with Mexican-American persons. Non-Hispanic black persons were more likely to have two comorbid conditions compared with non-Hispanic white and Mexican-American persons. Non-Hispanic black persons were also more likely to have all three chronic conditions compared with non-Hispanic white persons. These results emphasize the need for research to identify the reasons for the race/ethnicity differences and to identify factors that could be modified to mitigate the race/ethnicity differences.
Diagnosed or undiagnosed hypertension and hypercholesterolemia are more likely to coexist in non-Hispanic black and non-Hispanic white persons than Mexican-American persons. Diagnosed or undiagnosed hypertension and diabetes are more likely to coexist in non-Hispanic black and Mexican-American persons than non-Hispanic white persons. In 15% of U.S. adults, one or more of the three conditions is undiagnosed.
Definitions
Consensus definitions for the diagnosis of the hypertension, hypercholesterolemia, and diabetes have been presented elsewhere and serve as the rationale for the analytic definitions used in this report as described in the following text (4-6). An overarching definition was used for each condition even though more rigorous criteria may exist for some groups in this analysis (e.g., hypertension for diabetic persons is usually defined as systolic BP ≥ 130 mm Hg or diastolic BP > 80 mm Hg).
Hypertension: Systolic BP ≥ 140 mm Hg or diastolic BP ≥ 90 mm Hg or currently taking medication to lower high BP.
Undiagnosed hypertension: A finding of hypertension and never told by health care provider that blood pressure was high (based on a negative response to the question “Ever told by a doctor or other health care professional that you had hypertension, also called high blood pressure?”)
Hypercholesterolemia: Levels of serum total cholesterol ≥ 240 mg/dl or currently taking cholesterol lowering medication.
Undiagnosed hypercholesterolemia: A finding of hypercholesterolemia and never told by health care provider that cholesterol was high (based on a negative response to the question “Have you ever been told by a doctor or other health care professional that your blood cholesterol is high?”)
Diabetes: A self-report of a previous physician diagnosis of diabetes or having undiagnosed diabetes.
Undiagnosed diabetes: Fasting plasma glucose of at least 126 mg/dL and no reported physician diagnosis.
Data source and methods
The National Health and Nutrition Examination Survey (NHANES) data were used for these analyses. NHANES is a cross-sectional survey designed to monitor the health and nutritional status of the civilian, noninstitutionalized U.S. population (7). The survey consists of interviews conducted in participants’ homes, standardized physical examinations conducted in mobile examination centers, and laboratory tests utilizing blood and urine specimens provided by participants during the physical examination.
The NHANES sample is selected through a complex, multistage design that includes selection of primary sampling units (counties), household segments within the counties, and finally sample persons from selected households. The sample design includes oversampling in order to obtain reliable estimates of health and nutritional measures for population subgroups. In 1999-2006, African Americans, Mexican Americans, persons with low income, persons aged 12-19 years , and persons aged 60 and over were oversampled. In 1999, NHANES became a continuous survey, fielded on an ongoing basis. Each year of data collection is based on a representative sample covering all ages of the civilian, noninstitutionalized population. Public-use data files are released in 2-year cycles.
Sample weights, which account for the differential probabilities of selection, nonresponse, and noncoverage, were incorporated into the estimation process. The standard errors of the percentages were estimated using Taylor Series Linearization, a method that incorporates the sample weights and sample design (8).
Estimates for the total population were age adjusted to the 2000 U.S. standard population using three age groups, 20-39, 40-59, and aged 60 and over (9). Differences between groups were evaluated using a univariate t-statistic at the p< 0.05 significance level. For comparison of estimates by race/ethnicity, adjustments for multiple comparisons were made using the Bonferroni method (10). All differences reported are statistically significant unless otherwise indicated.
Statistical analyses were conducted using the SAS System for Windows (release 9.1; SAS Institute Inc, Cary, N.C.) and SUDAAN (release 9.0; Research Triangle Institute, Research Triangle Park, N.C.).
About the authors
Cheryl D. Fryar, Rosemarie Hirsch, Mark S. Eberhardt, Sung Sug Yoon, and Jacqueline D. Wright are with the Centers for Disease Control and Prevention’s National Center for Health Statistics, Division of Health and Nutrition Examination Surveys.
References
- U.S. Department of Health and Human Services. Office of Disease Prevention and Health Promotion. Healthy People 2010external icon.
- National Center for Health Statistics. Health, United States, 2008. Hyattsville, MD.
- Agency for Healthcare Research and Quality. 2008 National Healthcare Disparities Report (NHDR). Rockville, MD: U.S. Department of Health and Human Services, Agency for Healthcare Research and Quality. 2009.
- Chobanian AV, Bakris GL, Black HR, et al. Seventh report of the Joint National Committee on Prevention, Detection, Evaluation, and Treatment of High Blood Pressure. Hypertension 42(6):1206-52. 2003.
- Third Report of the Expert Panel on Detection, Evaluation, and Treatment of High Blood Cholesterol in Adults (Adult Treatment Panel III). Washington, DC: National Institutes of Health. 2001.
- Diagnosis and classification of diabetes mellitusexternal icon. Diabetes Care 32:S62-7. 2009.
- Centers for Disease Control and Prevention. National Center for Health Statistics. National Health and Nutrition Examination Surveys 1999-2006.
- Centers for Disease Control and Prevention. National Center for Health Statistics. National Health and Nutrition Examination Surveys Analytic Guidelines.
- Klein RJ, Schoenborn CA. Age adjustment using the 2000 projected U.S. population. Healthy People Statistical Notes, no 20. Hyattsville, MD: National Center for Health Statistics. 2001.
- Miller RG. Developments in multiple comparisons, 1966-76. JASA 72:779-88. 1977.
Suggested citation
Fryar CD, Hirsch R, Eberhardt MS, Yoon SS, Wright JD. Hypertension, high serum total cholesterol, and diabetes: Racial and ethnic prevalence differences in U.S. adults, 1999-2006. NCHS data brief, no 36. Hyattsville, MD: National Center for Health Statistics. 2010.
Copyright information
All material appearing in this report is in the public domain and may be reproduced or copied without permission; citation as to source, however, is appreciated.
National Center for Health Statistics
Edward J. Sondik, Ph.D., Director
Jennifer H. Madans, Ph.D., Associate Director for Science
Division of Health and Nutrition Examination Surveys
Clifford L. Johnson, M.S.P.H., Director