Describing the Increase in Preterm Births in the United States, 2014–2016
- Key findings
- Total preterm and late preterm birth rates rose from 2014 through 2016.
- Births in both singleton and multiple deliveries were more likely to be preterm and late preterm in 2016 than in 2014.
- Total and late preterm birth rates rose for each of the largest race and Hispanic-origin groups during 2014–2016.
- Rates of preterm births rose in about one-half of all states for 2016 compared with 2014.
- Summary
- Definitions
- Data source and methods
- About the authors
- References
- Suggested citation
NCHS Data Brief No. 312, June 2018
PDF Versionpdf icon (1 MB)
Joyce A. Martin, M.P.H., and Michelle J.K. Osterman, M.H.S.
Key findings
Data from the National Vital Statistics System
- The United States preterm birth rate (births at less than 37 weeks of gestation per 100 total births) rose from 9.57% to 9.85% during 2014–2016.
- The increase in the total preterm birth rate largely reflects an increase among late preterm births (34–36 weeks), and in particular, among births occurring at 36 weeks.
- Total and late preterm birth rates rose 4% among births in singleton deliveries. Total and late preterm births also increased among multiple births during 2014–2016.
- Total and late preterm rates rose among births to non-Hispanic white, non-Hispanic black, and Hispanic women. Early preterm births (less than 34 weeks) also increased among non-Hispanic black women.
- Preterm birth rates increased in 23 states and the District of Columbia during 2014–2016.
Infants born before 37 weeks of gestation, commonly referred to as preterm, are at greater risk of early death than those born later in pregnancy and can suffer numerous health and developmental problems, especially at earlier gestational ages (1–3). The incidence of preterm birth in the United States rose from the early 1980s through 2006 but declined from 2007 through 2014 (4–6). Recent data for 2014–2016, however, indicate that the preterm rate is on the rise again (6). This report describes trends in total, early (less than 34 weeks), and late (34–36 weeks) preterm births by plurality, race and Hispanic origin of the mother, and state of residence during 2014–2016.
Keywords: plurality, race and Hispanic origin, state, National Vital Statistics System
Total preterm and late preterm birth rates rose from 2014 through 2016.
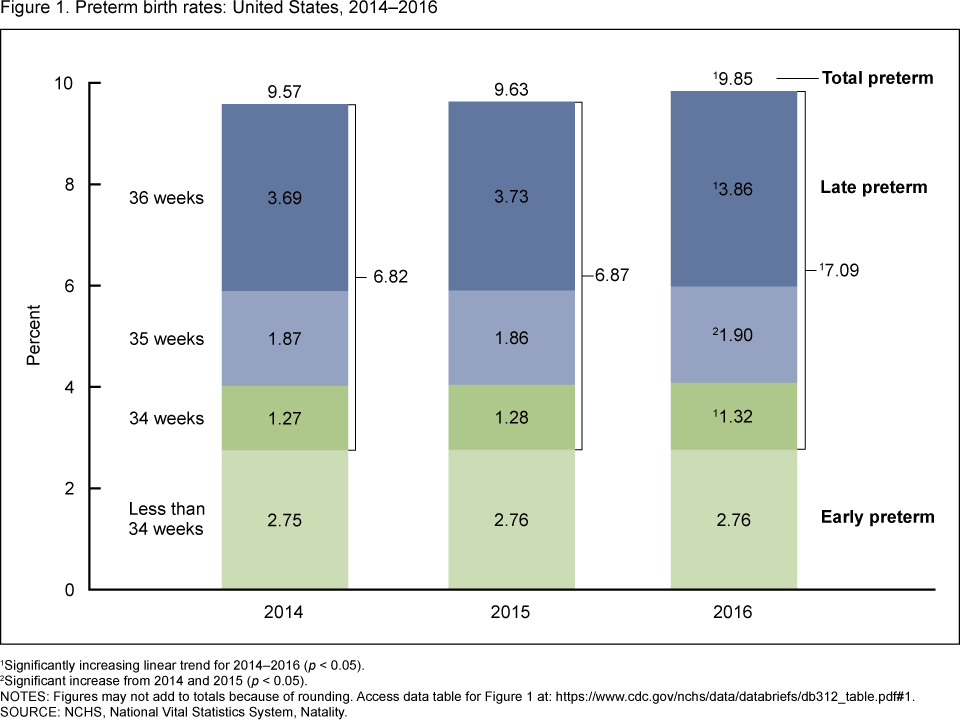
- During 2014–2016, the preterm birth rate rose 3% in the United States, from 9.57% in 2014 to 9.63% in 2015 to 9.85% in 2016 (Figure 1).
- The rate of late preterm births rose 4% from 2014 (6.82%) through 2016 (7.09%), with the largest rise occurring among infants delivered at 36 weeks, from 3.69% in 2014 to 3.86% in 2016. Rates also increased at 34 (1.27% in 2014 to 1.32% in 2016) and 35 (1.87% to 1.90%) weeks.
- The rate of early preterm births was essentially unchanged for 2014–2016 (2.75%–2.76%).
- The increase in the total preterm rate for 2014–2016 largely reflects the increase in late preterm births, and in particular, births occurring at 36 weeks.
Figure 1. Preterm birth rates: United States, 2014–2016
1Significantly increasing linear trend for 2014–2016 (p < 0.05).
2Significant increase from 2014 and 2015 (p < 0.05).
NOTES: Figures may not add to totals because of rounding. Access data table for Figure 1pdf icon.
SOURCE: NCHS, National Vital Statistics System, Natality.
Births in both singleton and multiple deliveries were more likely to be preterm and late preterm in 2016 than in 2014.
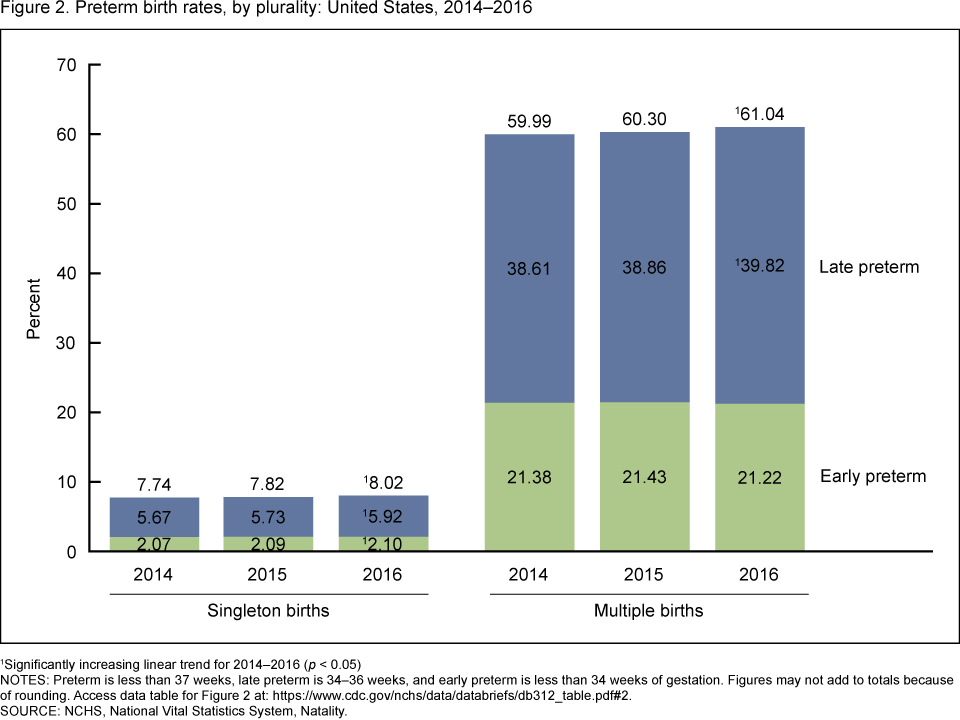
- The preterm birth rate rose 4% among singleton births for 2014–2016, from 7.74% to 8.02% (Figure 2).
- The singleton late preterm rate also increased 4% (from 5.67% to 5.92%). A smaller increase occurred in early preterm singleton births (from 2.07% to 2.10%).
- Among multiple births, the preterm rate increased from 59.99% in 2014 to 61.04% in 2016, a rise of 2%. The late preterm rate for multiple births rose from 38.61% to 39.82%, and the early preterm rate was essentially stable (21.22% in 2016).
Figure 2. Preterm birth rates, by plurality: United States, 2014–2016
1Significantly increasing linear trend for 2014–2016 (p < 0.05).
NOTES: Preterm is less than 37 weeks, late preterm is 34–36 weeks, and early preterm is less than 34 weeks of gestation. Figures may not add to totals because of rounding. Access data table for Figure 2pdf icon.
SOURCE: NCHS, National Vital Statistics System, Natality.
Total and late preterm birth rates rose for each of the largest race and Hispanic-origin groups during 2014–2016.
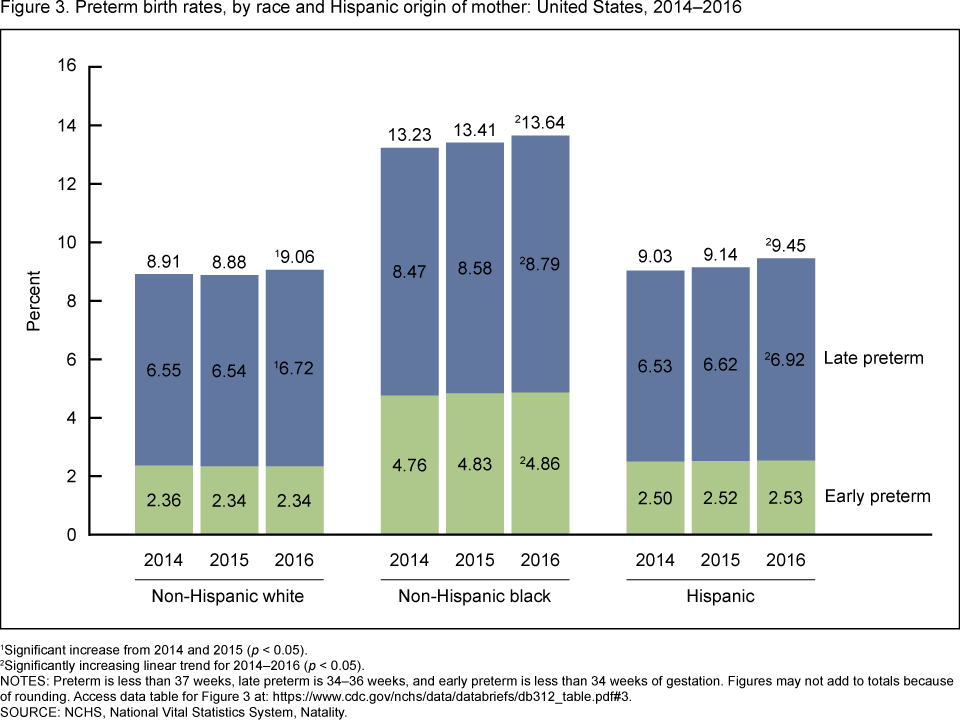
- Among infants born to non-Hispanic white women, the preterm rate was essentially unchanged from 2014 to 2015 but rose 2% from 2015 to 2016 (from 8.88% to 9.06%). The increase during 2014–2016 was among late preterm births, from 6.55% to 6.72%; the observed decline in early preterm births was not significant (Figure 3).
- The preterm rate among births to non-Hispanic black women rose from 2014 to 2015 (13.23% to 13.41%) and again in 2016 (13.64%) for a total increase of 3%. Rates increased for both late preterm (8.47% in 2014 to 8.79% in 2016) and early preterm (4.76% to 4.86%) births.
- The preterm rate rose 5% among births to Hispanic mothers during 2014–2016 (from 9.03% to 9.45%); this rise is primarily attributable to the increase in late preterm births, from 6.53% to 6.92%. The observed increase in the early preterm birth rate was not significant.
Figure 3. Preterm birth rates, by race and Hispanic origin of mother: United States, 2014–2016
1Significant increase from 2014 and 2015 (p < 0.05).
2Significantly increasing linear trend for 2014–2016 (p < 0.05).
NOTES: Preterm is less than 37 weeks, late preterm is 34–36 weeks, and early preterm is less than 34 weeks of gestation. Figures may not add to totals because of rounding. Access data table for Figure 3pdf icon.
SOURCE: NCHS, National Vital Statistics System, Natality.
Rates of preterm births rose in about one-half of all states for 2016 compared with 2014.
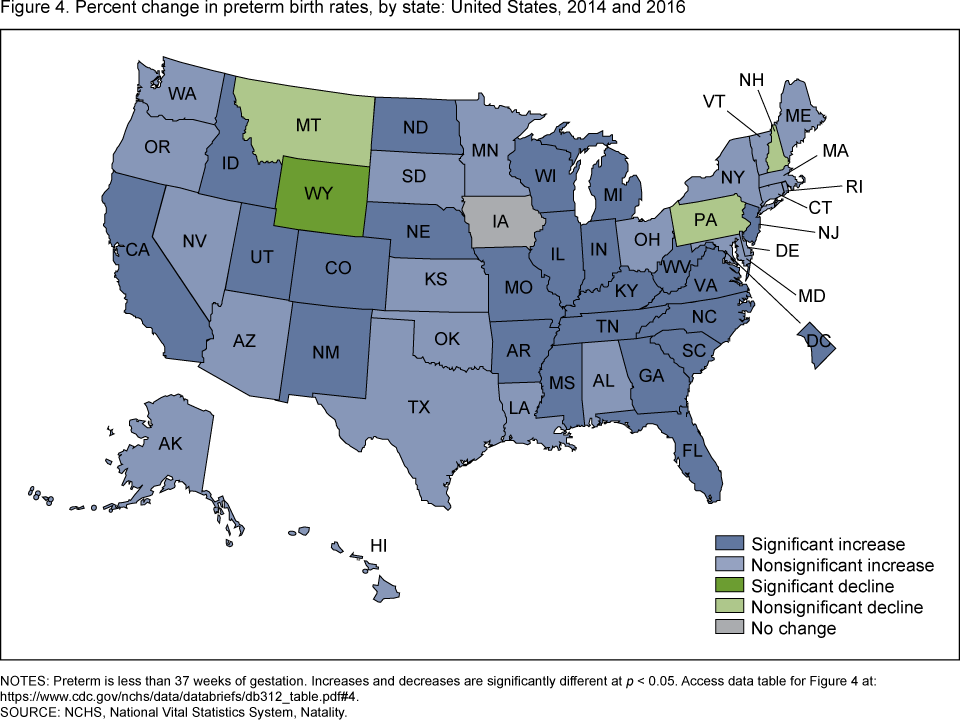
- Preterm birth rates were up in 23 states and the District of Columbia from 2014 through 2016; increases in an additional 22 states were not statistically significant (Figure 4).
- The preterm birth rate declined in Wyoming: nonsignificant declines were observed in three states—Montana, New Hampshire, and Pennsylvania. The rate for Iowa was unchanged.
Figure 4. Percent change in preterm birth rates, by state: United States, 2014 and 2016
NOTES: Preterm is less than 37 weeks of gestation. Increases and decreases are significantly different at p < 0.05. Access data table for Figure 4pdf icon.
SOURCE: NCHS, National Vital Statistics System, Natality.
Summary
The rise in preterm births in the United States for 2014 through 2016 largely reflects an increase among late preterm births, and more specifically, among births delivered at 36 weeks; the small change in the rate of early preterm births (2.75%–2.76%) was not statistically significant. The increase in late preterm births occurred among several groups, including both singleton and multiple deliveries and among each of the three largest race and Hispanic-origin groups. An earlier report demonstrated that late preterm rates also increased among women of all age groups during this period (7).
Although the rate of early preterm births, the infants at greater risk of poor outcomes, was essentially stable among all births for 2014 through 2016, rates increased among infants born in singleton deliveries and among births to non-Hispanic black mothers.
The latest provisional information from the National Center for Health Statistics Rapid Release program shows a continuing increase in total and late preterm birth rates and a stable early preterm birth rate for all births through 2017 (8).
Definitions
Preterm birth rate: The number of births delivered at less than 37 completed weeks of gestation per 100 total births, based on the obstetric estimate of gestation.
Early preterm birth rate: The number of births delivered at less than 34 completed weeks of gestation per 100 total births, based on the obstetric estimate of gestation.
Late preterm birth rate: The number of births delivered at 34–36 completed weeks of gestation per 100 total births, based on the obstetric estimate of gestation.
Birth rate at 34, 35, and 36 weeks: The number of births delivered at the specified completed weeks of gestation per 100 total births, based on the obstetric estimate of gestation.
Singleton births: Births in single-gestation pregnancies.
Multiple births: Births in multiple-gestation pregnancies (i.e., twin and triplet and higher-order births).
Data source and methods
This report is based on 2014–2016 data from the Natality Data File from the National Vital Statistics System (NVSS). The vital statistics natality file is derived from birth certificates and includes information for all births occurring in the United States. It is the primary data set for analyzing birth trends and patterns in the United States.
Gestational age is based on the obstetric estimate of gestation (5). Race and Hispanic origin are self-reported by the mother and are based on bridged-race categories (4). Data by state are based on the mother’s place of residence.
References to increases or decreases in preterm birth rates indicate that differences are statistically significant at p < 0.05 based on a z test for difference in proportions. References to decreasing or increasing trends are statistically significant at the 0.05 level and assessed using the Cochran–Armitage test for trends, a modified chi-squared test.
About the authors
Joyce A. Martin and Michelle Osterman are with the National Center for Health Statistics, Division of Vital Statistics, Reproductive Statistics Branch.
References
- Mathews TJ, MacDorman MF, Thoma ME. Infant mortality statistics from the 2013 period linked birth/infant death data setpdf icon. National Vital Statistics Reports; vol 64 no 9. Hyattsville, MD: National Center for Health Statistics. 2015.
- Behrman RE, Butler AS, editors. Preterm birth: Causes, consequences, and prevention. Institute of Medicine Committee on Understanding Premature Birth and Assuring Healthy Outcomes. Washington, DC: National Academies Press. 2007.
- Blencowe H, Cousens S, Chou D, Oestergaard M, Say L, Moller AB, et al. Born too soon: The global epidemiology of 15 million preterm births. Reprod Health 10 Suppl 1:S2. 2013.
- Martin JA, Hamilton BE, Osterman MJK, Curtin SC, Mathews TJ. Births: Final data for 2013pdf icon. National Vital Statistics Reports; vol 64 no 1. Hyattsville, MD: National Center for Health Statistics. 2015.
- Martin JA, Osterman MJK, Kirmeyer SE, Gregory ECW. Measuring gestational age in vital statistics data: Transitioning to the obstetric estimate. National Vital Statistics Reports; vol 64 no 5. Hyattsville, MD: National Center for Health Statistics. 2015.
- Martin JA, Hamilton BE, Osterman MJK, Driscoll AK, Drake P. Births: Final data for 2016pdf icon. National Vital Statistics Reports; vol 67 no 1. Hyattsville, MD: National Center for Health Statistics. 2018.
- Martin JA, Hamilton BE, Osterman MJK. Births in the United States, 2016. NCHS Data Brief, no 287. Hyattsville, MD: National Center for Health Statistics. 2017.
- Hamilton BE, Martin JA, Osterman MJK, Driscoll AK, Rossen LM. Births: Provisional data for 2017. Vital Statistics Rapid Release; no 4. Hyattsville, MD: National Center for Health Statistics. May 2018.
Suggested citation
Martin JA, Osterman MJK. Describing the increase in preterm births in the United States, 2014–2016. NCHS Data Brief, no 312. Hyattsville, MD: National Center for Health Statistics. 2018.
Copyright information
All material appearing in this report is in the public domain and may be reproduced or copied without permission; citation as to source, however, is appreciated.
National Center for Health Statistics
Charles J. Rothwell, M.S., M.B.A., Director
Jennifer H. Madans, Ph.D., Associate Director for Science
Division of Vital Statistics
Delton Atkinson, M.P.H., M.P.H., P.M.P., Director
Hanyu Ni, Ph.D., M.P.H., Associate Director for Science