Vision, Hearing, Balance, and Sensory Impairment in Americans Aged 70 Years and Over: United States, 1999-2006
- Key findings
- How common are sensory impairments among older adults?
- Are sensory impairments more common among older men or among older women?
- In older Americans, do sensory impairments keep increasing with age?
- Are there differences in sensory impairments among race or ethnic groups?
- How common are sensory impairments among those living below the poverty line?
- What percentage of older U.S. adults with vision or hearing problems could improve their situation with new glasses or by using a hearing aid?
- Summary
- Definitions
- Data sources and methods
- About the authors
- References
- Suggested citation
NCHS Data Brief No. 31, April 2010
PDF Version (540 KB)
Charles F. Dillon, M.D., Ph.D.; Qiuping Gu, M.D., Ph.D.; Howard J. Hoffman, M.A.; and Chia-Wen Ko, Ph.D.
Key findings
- Sensory impairments are a substantial problem for older Americans: One out of six has impaired vision; one out of four has impaired hearing; one out of four has loss of feeling in the feet; and three out of four have abnormal postural balance testing.
- Sensory impairments increase with age: Vision and hearing impairments each double, and loss of feeling in the feet increases by 40% in persons aged 80 years and over compared with persons aged 70-79 years.
- One in five Americans below the poverty threshold has impaired vision: 50% higher than other Americans. Balance problems are also common among the poor.
- Over one-half of those with impaired vision could improve their eyesight by using glasses or by getting a corrected prescription. For those with hearing problems, 72% might benefit from a hearing aid but do not use one.
Sensory impairments such as problems with vision, hearing, postural balance, or loss of feeling in the feet, are known to increase with age. The prevalence of sensory impairments will increase as U.S. life expectancy increases. Important public health goals for older adults include maintaining independent living, health, and quality of life (1). Minimizing the impact of sensory impairments is therefore important. This report provides updated examination-based estimates for sensory impairments: overall and for specific subgroups of older Americans.
Keywords: Health survey, prevalence, aged, NHANES
How common are sensory impairments among older adults?
Many Americans aged 70 years and over have sensory impairment.
- One out of six has visual impairment.
- One out of four has hearing impairment.
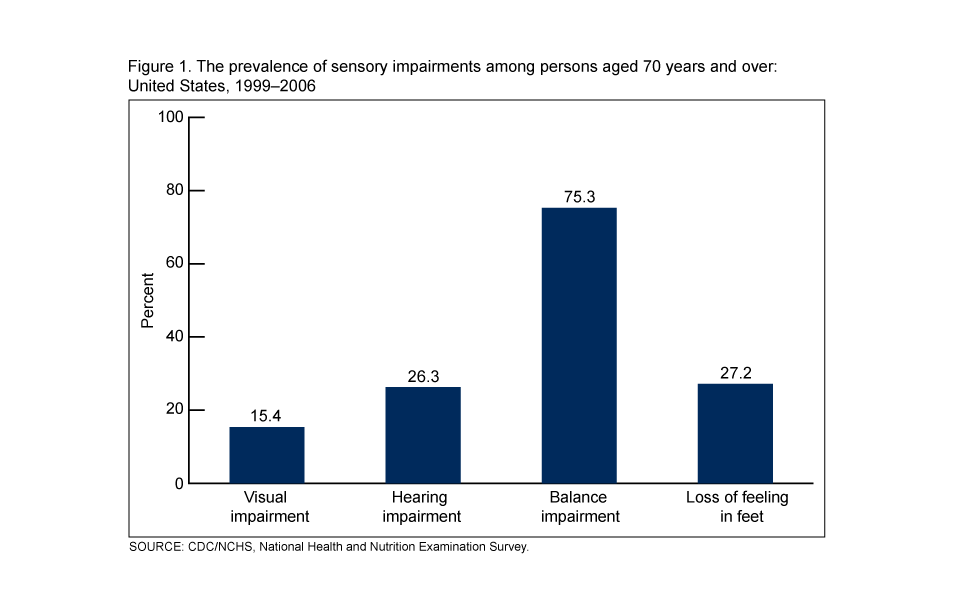
- Three out of four have abnormal testing for postural balance.
- One out of four has loss of feeling in the feet (Figure 1).
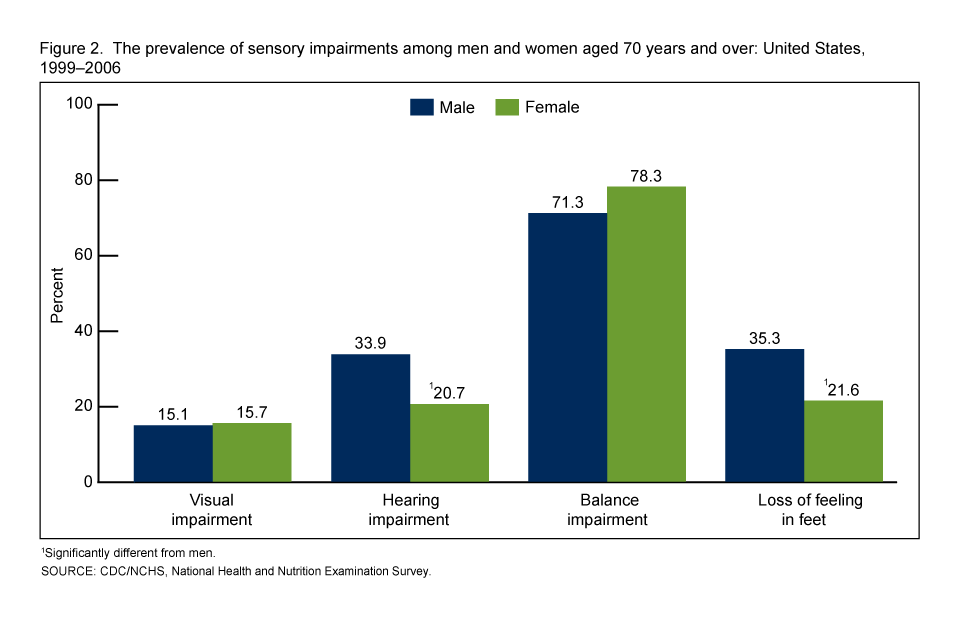
Are sensory impairments more common among older men or among older women?
- Men are more likely than women to have hearing impairment and loss of feeling in the feet.
- Women are more likely than men to have a balance impairment, but the difference is small.
- There is no difference in the prevalence of vision impairment between men and women (Figure 2).
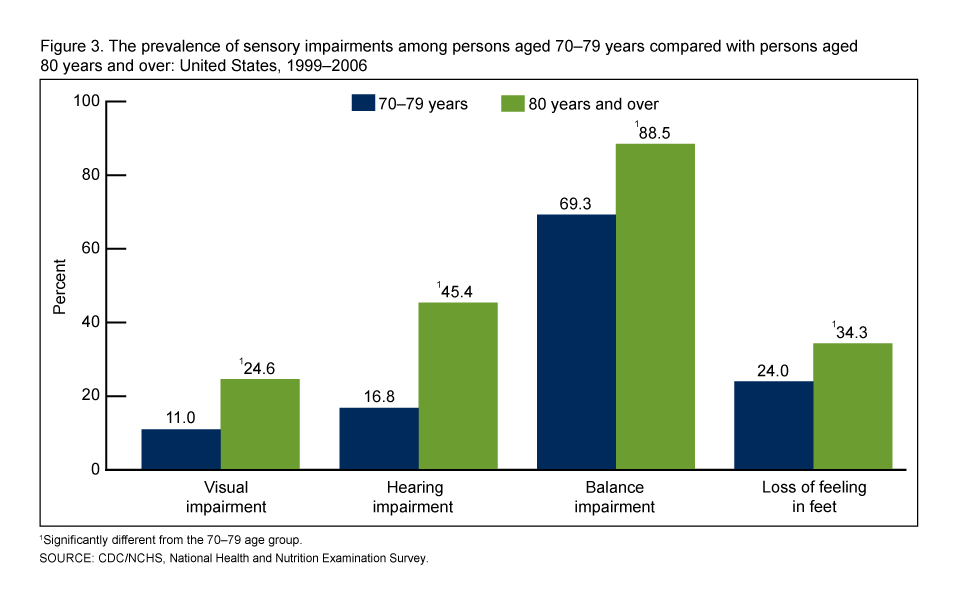
In older Americans, do sensory impairments keep increasing with age?
Among older Americans, the prevalence of sensory impairments is significantly higher among persons aged 80 years and over compared with persons aged 70-79 years.
- The prevalence of vision and hearing impairments more than doubled among persons aged 80 years and over compared with persons aged 70-79 years.
- The prevalence of loss of feeling in the feet increases by 40% in the older age group and the prevalence of balance problems increases by almost 30% (Figure 3).
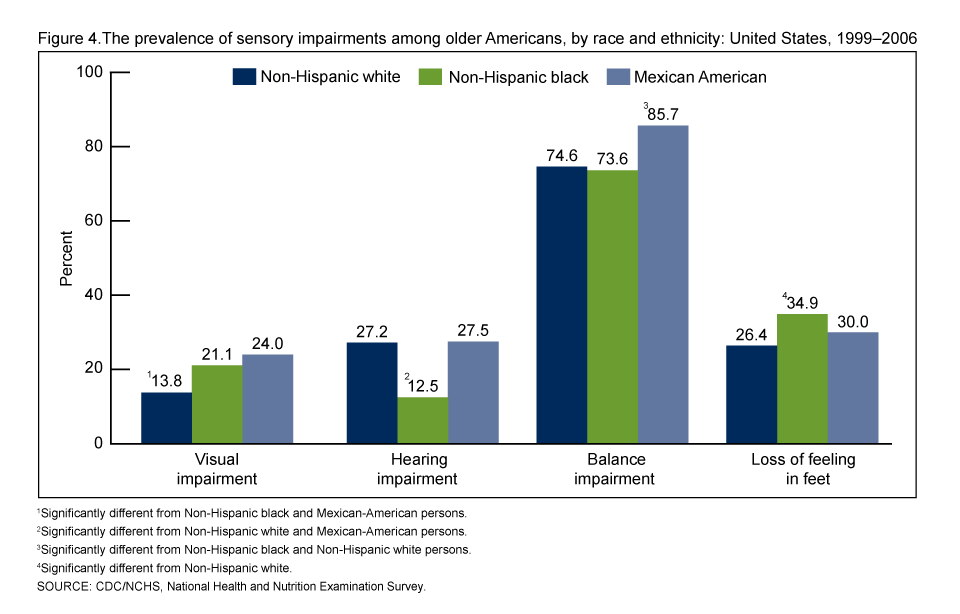
Are there differences in sensory impairments among race or ethnic groups?
There are disparities in the prevalence of sensory impairment among race or ethnic groups.
- Non-Hispanic black and Mexican-American persons have a higher prevalence of vision impairment than non-Hispanic white persons.
- Non-Hispanic white and Mexican-American persons have a higher prevalence of hearing problems than non-Hispanic black persons.
- Mexican-American persons have the highest prevalence of balance problems.
- Non-Hispanic black persons have a higher prevalence of loss of feeling in the feet compared with non-Hispanic white persons (Figure 4).
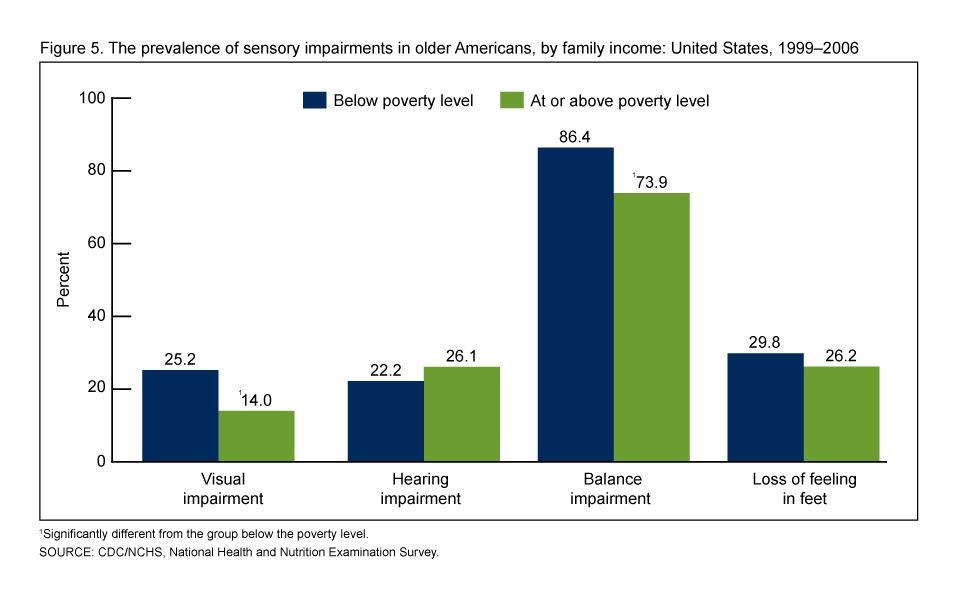
How common are sensory impairments among those living below the poverty line?
Vision and balance impairment is more common among older American adults living below the poverty level compared with those who are at or above the poverty level.
- One in five older adults living below the poverty threshold has vision impairment, a rate that is 50% higher than among all other older adults.
- Balance problems were 15% more likely among older adults living below the poverty level (Figure 5).
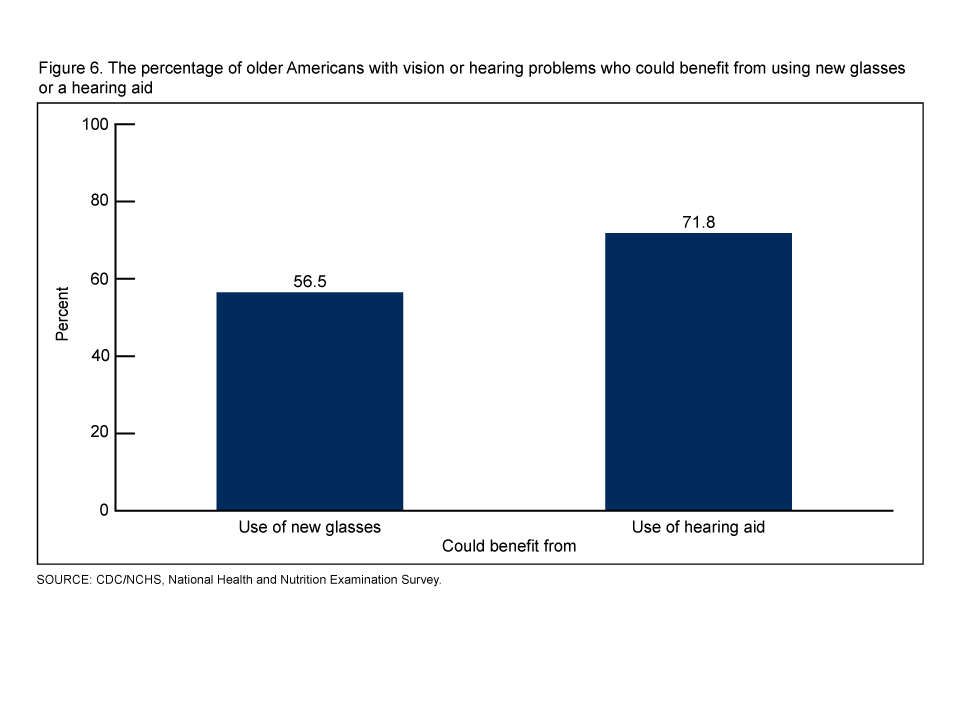
What percentage of older U.S. adults with vision or hearing problems could improve their situation with new glasses or by using a hearing aid?
- Almost 60% of older persons with vision problems do not use glasses at all or have glasses that do not completely correct their vision.
- Approximately 70% of older Americans with hearing loss in at least one ear could potentially benefit from using a hearing aid, but do not use one (Figure 6).
Summary
Long-term public health goals for the older U.S. adult population are to decrease morbidity, to reduce functional limitations, to preserve a good quality of life, and maintain independent functioning. Each of these areas can potentially be impacted by sensory impairment, which is also linked to increased mortality, hip fractures, and depression (2). Hearing and vision impairment in older adults may present particular challenges to families and caregivers. Although some degree of sensory loss may be irreversible, these data indicate that significant numbers of persons may be helped by the use of better glasses or by hearing aid use. More attention will need to be given to this basic health issue.
Definitions
Visual impairment: Not being able to read letters or numbers of the line 20/50 or below on the visual acuity chart in the Better-Seeing Eye. This is the individual’s distance visual acuity, measured with the person’s distance glasses or contact lenses on, if the person wears them (3-5).
Percentage of persons who may benefit from new glasses: The ratio of the number of persons whose visual acuity could be corrected to 20/40 or better in their Better-Seeing Eye (using automatic refraction testing) to the number of persons with visual impairment.
Hearing impairment (moderate to severe): Defined as an unassisted, pure tone audiometric average (at 500 Hz, 1000 Hz, 2000, and 4000 Hz) of greater than 40 dB in the better ear (6-8). This degree of hearing loss means that you are not able to hear and repeat words that a person says if they talk to you in a normal voice from across a quiet room. In formal testing, an examinee should not be able to see the examiners lips when they are talking.
The percentage of persons who may benefit from using a hearing aid: This is not directly measured, rather, this estimate is the percentage of persons who do not currently use a hearing aid among the group of persons with a pure tone audiometric average at 500 Hz, 1000 Hz, 2000, and 4000 Hz of greater than 40 dB in at least one ear.
Balance (vestibular) impairment: Failure to be able to stand on one’s own to complete test condition 4 of the Modified Romberg Test of Standing Balance (3,9). Test condition 4 is standing on a 3 inch thick foam pad for 30 seconds with the eyes shut.
Loss of feeling in the feet (lower extremity insensate peripheral sensory neuropathy): No feeling in the feet, defined as complete failure to feel a standard 5.07 Semmes-Weinstein nylon monofilament in one or more test areas of either foot (3).
Data sources and methods
The most recent U.S. National Health and Nutrition Examination Survey (NHANES) data were used for these analyses (vision, 1999-2006; hearing, 2005-2006; balance, 2001-2004; and peripheral neuropathy, 1999-2004). NHANES is a cross-sectional survey monitoring the health and nutritional status of the civilian, noninstitutionalized population. Health interviews, health examinations, and laboratory tests are performed in mobile examination centers. The NHANES sample is selected through a complex design to be nationally representative. In 1999-2006, non-Hispanic black persons, Mexican-American persons, persons with low-income, and persons aged 60 years and over were oversampled for reliable subgroup prevalence estimation. Sample weights accounting for the complex survey design, nonresponse, and noncoverage were used for analysis. Variance estimates used Taylor series linearization. Group differences were analyzed by a univariate t-statistic. Reported differences are statistically significant at the .05 level (unadjusted). Statistical analyses used SAS™ (Release 9.2; SAS Institute Inc, Cary, N.C.) and SUDAAN™ (Release 10.0; Research Triangle Institute, Research Triangle Park, N.C.).
About the authors
Charles Dillon and Qiuping Gu are with the Centers for Disease Control and Prevention’s National Center for Health Statistics, Division of Health and Nutrition Examination Surveys. Howard Hoffman and Chia-Wen Ko are with the National Institutes of Health, National Institute on Deafness and Other Communication Disorders.
References
- Diwan S, Moriarty D. A conceptual framework for identifying unmet health care needs of community dwelling elderly. Journal of Applied Gerontology 14:47-63. 1995.
- Campbell VA, Crews JE, Moriarty DG, Zack MM, Blackman DK. Surveillance for sensory impairment, activity limitation, and health-related quality of life among older adults–United States, 1993-1997. MMWR CDC Surveill Summ. 48(8):131-56. 1999.
- The National Health and Nutrition Examination Survey (NHANES) Examination Manuals (1999-2000; 2001-2002; 2003-2004; 2005-2006). National Center for Health Statistics, Hyattsville, MD. Oct 27, 2009.
- Vitale S, Cotch MF, Sperduto RD. Prevalence of visual impairment in the United States. JAMA. 295(18):2158-63. 2006.
- Dandona L, Dandona R. Revision of visual impairment definitions in the International Statistical Classification of Diseases. BMC Med. 4:7. 2006.
- Davis A. The prevalence of hearing impairment and reported hearing disability among adults in Great Britain. Intl J Epidemiol; 18: 911-917. 1989.
- World Health Organization. Prevention of Blindness and Deafness (PBD) Program. Prevention Of Deafness And Hearing Impairment Grades Of Hearing Impairment. Oct 27, 2009.
- Mathers C, Smith A, Concha M. Global Burden of Hearing Loss in The Year 2000 [PDF – 95 KB]. World Health Organization Health Statistics and Health Information Systems: the Global Burden of Disease (GBD). Oct 27, 2009.
- Weber PC, Cass SP. Clinical assessment of postural stability. Am J Otol. 14:566-9. 1993.
Suggested citation
Dillon CF, Gu Q, Hoffman H, Ko CW. Vision, hearing, balance, and sensory impairment in Americans aged 70 years and over: United States, 1999-2006. NCHS data brief, no 31. Hyattsville, MD: National Center for Health Statistics. 2010.
Copyright information
All material appearing in this report is in the public domain and may be reproduced or copied without permission; citation as to source, however, is appreciated.
National Center for Health Statistics
Edward J. Sondik, Ph.D., Director
Jennifer H. Madans, Ph.D., Associate Director for Science
Division of Health and Nutrition Examination Surveys
Clifford L. Johnson, M.S.P.H., Director