Variation in Adult Day Services Center Participant Characteristics, by Center Ownership: United States, 2014
- Key findings
- The racial and ethnic composition of participants in for-profit adult day services centers was more diverse than in nonprofit centers.
- Selected sociodemographic characteristics of adult day services center participants differed by center ownership.
- The prevalence of selected diagnosed medical conditions among adult day services center participants differed by center ownership.
- Adult day services center participants’ need for assistance with selected activities of daily living (ADLs) and receipt of medication assistance differed by center ownership.
- The prevalence of emergency department visits, discharges from overnight hospitals stays, and falls among adult day services center participants differed by center ownership.
- Summary
- Definitions
- Data source and methods
- About the authors
- References
- Suggested citation
NCHS Data Brief No. 227, December 2015
PDF Versionpdf icon (338 KB)
Eunice Park-Lee, Ph.D.; Lauren D. Harris-Kojetin, Ph.D.; Vincent Rome, M.P.H.; and Jessica P. Lendon, Ph.D.
Key findings
Data from the 2014 National Study of Long-Term Care Providers
- The racial and ethnic composition of participants in for-profit adult day services centers was more diverse than in nonprofit centers.
- About 61% of participants in for-profit centers received Medicaid, compared with 46% of those in nonprofit centers.
- The percentage of participants living with Alzheimer’s disease or with intellectual or developmental disability was higher in nonprofit adult day services centers than in for-profit centers.
- The percentage of participants needing assistance with dressing, toileting, and eating was higher in nonprofit centers than in for-profit centers.
- A higher percentage of participants in nonprofit centers (9%) than in for-profit centers (7%) had fallen in the last 90 days.
More than one-quarter million participants were enrolled in adult day services centers in the United States on the day of data collection in 2014 (1). The number of for-profit adult day services centers has grown in recent years (2). In 2012, 40% of adult day services centers were for-profit, serving more than one-half of all participants (3–5). This report presents the most current national estimates of selected characteristics of participants in adult day services centers and compares these characteristics by center ownership type. State-level estimates for the characteristics presented in this report are available online.
Keywords: medical conditions, activities of daily living (ADLs), home and community-based services, National Study of Long-Term Care Providers
The racial and ethnic composition of participants in for-profit adult day services centers was more diverse than in nonprofit centers.
- About 34% of participants in for-profit centers were non-Hispanic white, 14% were non-Hispanic black, 27% were Hispanic, and 25% were of other race or ethnicity, compared with 55%, 20%, 13%, and 12%, respectively, in nonprofit centers (Figure 1).
Figure 1. Percent distribution of race and ethnicity among adult day services center participants, by center ownership: United States, 2014
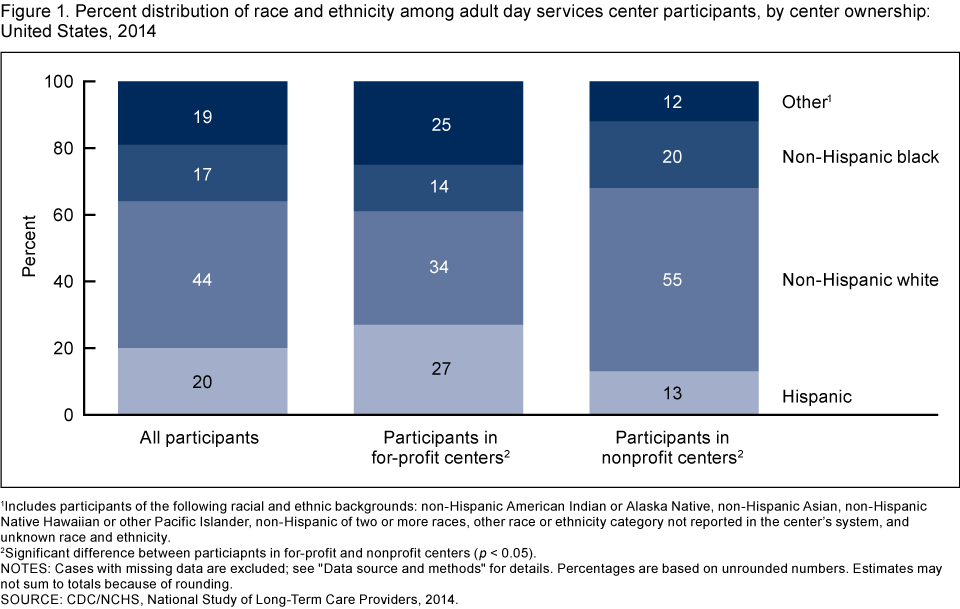
1Includes participants of the following racial and ethnic backgrounds: non-Hispanic American Indian or Alaska Native, non-Hispanic Asian, non-Hispanic Native Hawaiian or other Pacific Islander, non-Hispanic of two or more races, other race or ethnicity category not reported in the center’s system, and unknown race and ethnicity.
2Significant difference between participants in for-profit and nonprofit centers (p < 0.05).
NOTES: Cases with missing data are excluded; see “Data source and methods” for details. Percentages are based on unrounded numbers; estimates may not sum to totals because of rounding.
SOURCE: CDC/NCHS, National Study of Long-Term Care Providers, 2014.
Selected sociodemographic characteristics of adult day services center participants differed by center ownership.
- Overall, 64% of participants in adult day services centers were aged 65 and over, and 54% had Medicaid pay for at least some services in the last 30 days (Figure 2).
- A higher percentage of participants in for-profit adult day services centers were aged 65 and over (65%) compared with participants in nonprofit centers (62%).
- A higher percentage of participants in for-profit centers (61%) had some or all services paid by Medicaid in the last 30 days, compared with 46% of those in nonprofit centers.
- In both for-profit and nonprofit centers, 59% of participants were female.
Figure 2. Selected sociodemographic characteristics of adult day services center participants, by center ownership: United States, 2014
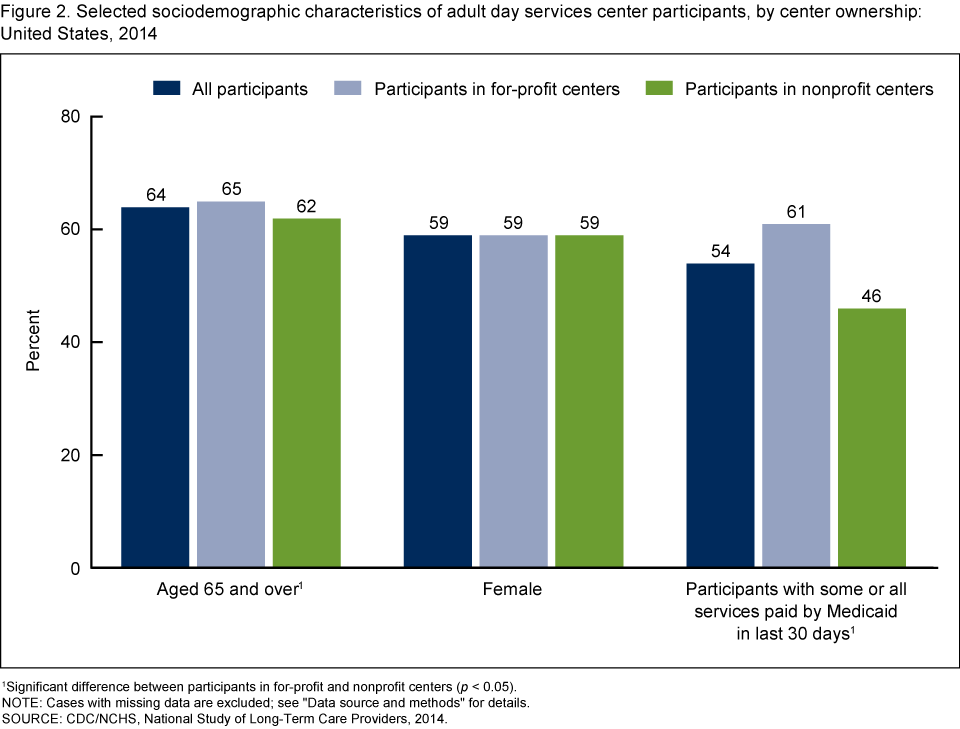
1Significant difference between participants in for-profit and nonprofit centers (p < 0.05).
NOTE: Cases with missing data are excluded; see “Data source and methods” for details.
SOURCE: CDC/NCHS, National Study of Long-Term Care Providers, 2014.
The prevalence of selected diagnosed medical conditions among adult day services center participants differed by center ownership.
- A higher percentage of participants in for-profit centers than in nonprofit centers had a diagnosis of cardiovascular disease (50% compared with 38%), diabetes (36% compared with 24%), depression (31% compared with 20%), and severe mental illness (12% compared with 8%) (Figure 3).
- A lower percentage of participants in for-profit centers than in nonprofit centers had a diagnosis of Alzheimer’s disease or other dementias (24% compared with 36%) and intellectual or developmental disability (20% compared with 32%).
Figure 3. Selected diagnosed medical conditions among adult day services center participants, by center ownership: United States, 2014
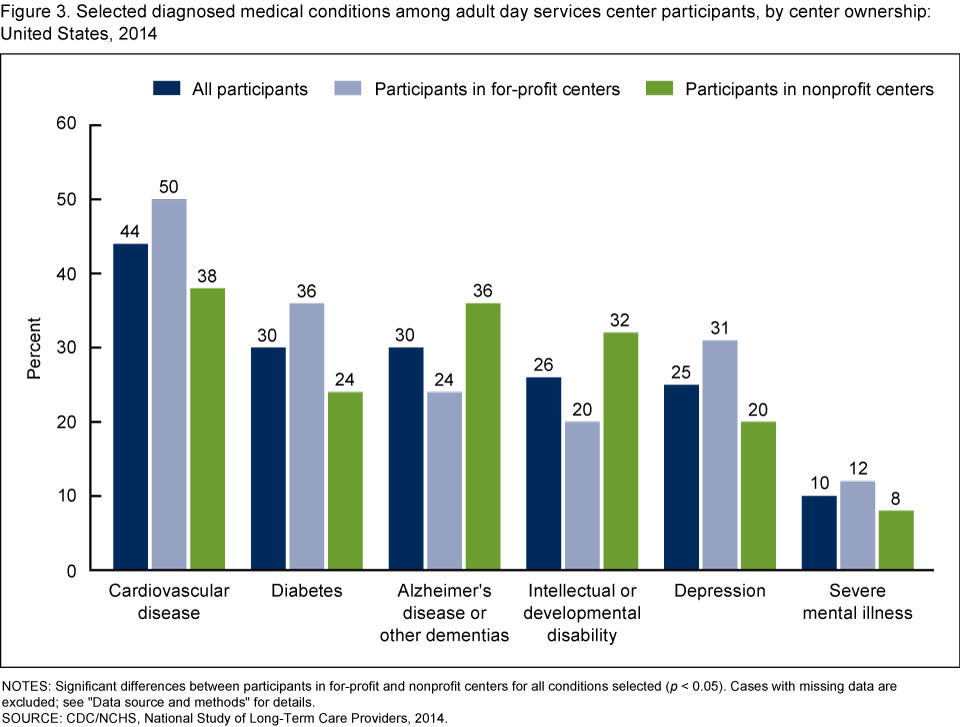
NOTES: Significant differences between participants in for-profit and nonprofit centers for all conditions selected (p < 0.05). Cases with missing data are excluded; see “Data source and methods” for details.
SOURCE: CDC/NCHS, National Study of Long-Term Care Providers, 2014.
Adult day services center participants’ need for assistance with selected activities of daily living (ADLs) and receipt of medication assistance differed by center ownership.
- About 41% of participants in adult day services centers needed assistance with bathing, which was the most frequent functional limitation among participants. There were no differences by center ownership (Figure 4).
- A higher percentage of participants in nonprofit adult day services centers than in for-profit centers needed assistance with dressing (39% compared with 36%), toileting (40% compared with 32%), and eating (29% compared with 20%).
- Twenty-seven percent of participants in for-profit centers received medication assistance, compared with 30% in nonprofit centers.
- There were no differences by center ownership in the proportion of participants needing assistance with transferring in and out of a chair.
Figure 4. Need for assistance with selected activities of daily living and receipt of medication assistance among adult day services center participants, by center ownership: United States, 2014
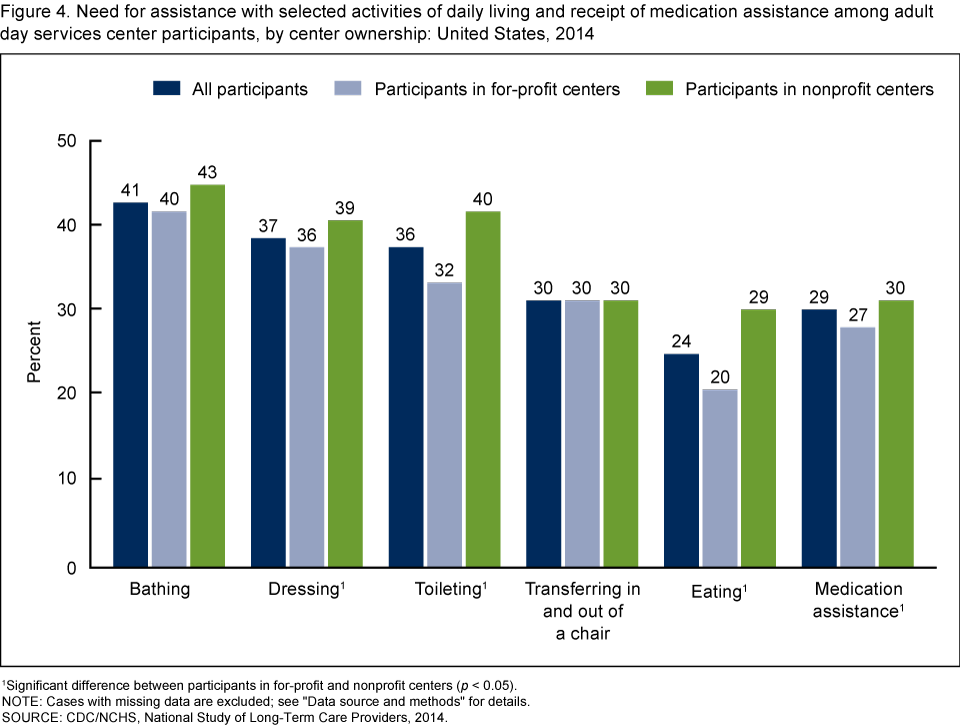
1Significant difference between participants in for-profit and nonprofit centers (p < 0.05).
NOTE: Cases with missing data are excluded; see “Data source and methods” for details.
SOURCE: CDC/NCHS, National Study of Long-Term Care Providers, 2014.
The prevalence of emergency department visits, discharges from overnight hospitals stays, and falls among adult day services center participants differed by center ownership.
- Overall, fewer than 1 in 10 participants in adult day services centers had an emergency department visit, was discharged from an overnight hospital stay, or had any falls in the last 90 days (Figure 5).
- A higher percentage of participants in nonprofit centers (7%) than in for-profit centers (6%) had emergency department visits in the last 90 days.
- Six percent of participants in nonprofit centers were discharged from an overnight hospital stay in the last 90-day period, compared with 5% in for-profit centers.
- The percentage of participants who had fallen in the last 90 days was higher in nonprofit centers (9%) than in for-profit centers (7%).
Figure 5. Emergency department visits, discharges from overnight hospital stays, and falls among adult day services center participants, by center ownership: United States, 2014

NOTES: Significant differences between participants in for-profit and nonprofit centers for all three characteristics (p < 0.05). Cases with missing data are excluded; see “Data source and methods” for details.
SOURCE: CDC/NCHS, National Study of Long-Term Care Providers, 2014.
Summary
In 2014 in the United States, the sociodemographic, functional and health status, and service utilization characteristics of current adult day services center participants differed by type of center ownership. “Current participant” refers to those participants enrolled in the adult day services center on the day of data collection in 2014, rather than the total number of participants ever enrolled in the center at some time in 2014.
The racial and ethnic composition of participants in for-profit adult day services centers was more diverse than in nonprofit centers. A higher percentage of participants in for-profit centers than in nonprofit centers were aged 65 and over. Cardiovascular disease, diabetes, depression, and severe mental illness were more prevalent among participants in for-profit centers than in nonprofit centers. Conversely, compared with for-profit centers, nonprofit adult day services centers served higher percentages of participants with Alzheimer’s disease or other dementias, or with intellectual or developmental disability. Compared with those in for-profit centers, a higher percentage of participants in nonprofit centers needed assistance with dressing, toileting, or eating. A higher percentage of participants in nonprofit centers also received medication assistance than those in for-profit centers. Compared with 61% in for-profit centers, 46% of participants in nonprofit centers had some or all services paid by Medicaid in the last 30 days.
Slightly higher percentages of participants in nonprofit centers than in for-profit centers had an emergency department visit (7% compared with 6%), were discharged from an overnight hospital stay (6% compared with 5%), or had fallen (9% compared with 7%) in the last 90 days.
Findings on differences by center ownership should provide useful information for policy makers, providers, researchers, and consumer advocates as they plan how best to meet the needs of seniors and persons with disabilities. State estimates, and their standard errors, corresponding to the national estimates in this report are available in a state supplemental table.
Definitions
Adult day services center: A community-based center that provides an array of long-term care services, including structured activities, health monitoring, socialization, and assistance with ADLs to older adults and to young adults with disabilities. These centers are generally open 5 days a week for a minimum of 6 hours a day.
Assistance with selected ADLs: Refers to participants needing any help or supervision from another person (or use of special equipment for assistance), at their usual residence or at the center, due to limitations in ADLs (bathing, walking or locomotion, dressing, transferring in and out of a chair, toileting, and eating) that reflect a participant’s capacity for self-care.
Cardiovascular disease: Includes conditions such as heart disease, stroke, and high blood pressure.
Emergency department visits: Includes participants who were treated in a hospital emergency department at least once in the 90 days prior to the survey.
Falls: Includes participants with at least one on-site or off-site fall in the 90 days prior to the survey.
Medication assistance: Includes participants for whom the adult day services center provided medication-related services, such as storing medications, administering medications, or providing assistance with self-administration of medications.
Other race or ethnicity: Includes participants of the following racial and ethnic backgrounds: non-Hispanic American Indian or Alaska Native, non-Hispanic Asian, non-Hispanic Native Hawaiian or other Pacific Islander, non-Hispanic of two or more races, other race or ethnicity category not reported in the center’s system, and unknown race and ethnicity. Unknown race and ethnicity accounted for 1.2% of participants enrolled in adult day services centers.
Overnight hospital stays: Includes participants with at least one discharge from an overnight hospital stay in the 90 days prior to the survey. Trips to the emergency department that did not result in discharge from an overnight hospital stay were excluded.
Ownership type: Refers to categorization of adult day services centers into two ownership types, for-profit and nonprofit. For-profit includes private, for-profit centers; publicly traded centers; and limited liability centers. Nonprofit includes private nonprofit centers, as well as federal, state, county, and local government-owned centers.
Participants with some or all services paid by Medicaid: Includes participants who had some or all of their long-term care services paid for by Medicaid during the 30 days prior to the survey.
Data source and methods
Data are from the Adult Day Services Survey component of the 2014 wave of the biennial National Study of Long-Term Care Providers (NSLTCP), conducted by the Centers for Disease Control and Prevention’s (CDC) National Center for Health Statistics (NCHS). The survey used a census of adult day services centers in the National Adult Day Services Association’s database. To be eligible for the study, an adult day services center must (a) have been in operation as of March 28, 2014; (b) be licensed or certified by the state specifically to provide adult day services, or authorized or otherwise set up to participate in Medicaid; (c) have an average daily attendance of one or more participants based on a typical week; and (d) have one or more participants enrolled at the center at the designated location at the time of the survey. More details on the NSLTCP survey design and outcomes are published elsewhere (1,6).
Although 282,200 participants were enrolled in 4,800 adult day services centers nationwide, the analyses in this report are based on the 279,100 participants in adult day services centers for which ownership status was known; 3,100 participants were excluded from the analyses because ownership status of the centers where they received care was unknown. Cases with missing data were excluded from the analyses on a variable-by-variable basis, ranging from 1.0% for ownership to 5.1% for emergency department visit in the last 90 days.
Differences among subgroups were evaluated using t tests, and a ratio of weighted sums for each subgroup was computed and compared. All statistical significance tests were two-sided, using p < 0.05 as the significance level. All differences reported are statistically significant unless otherwise indicated. Data analyses were performed using SAS version 9.3 (7) and the SAS-callable SUDAAN version 11.0.0 statistical package (8), as well as Stata/SE version 12.1 (9).
About the authors
Eunice Park-Lee, Lauren D. Harris-Kojetin, Vincent Rome, and Jessica P. Lendon are with CDC’s National Center for Health Statistics, Division of Health Care Statistics.
References
- National Center for Health Statistics. 2014 National Study of Long-Term Care Providers survey methodology and documentationpdf icon. Hyattsville, MD. 2015.
- Anderson KA, Dabelko-Schoeny H, Johnson TD. The state of adult day services: Findings and implications from the MetLife National Study of Adult Day Services. J Appl Gerontol 32(6):729–48. 2013.
- Dwyer LL, Harris-Kojetin LD, Valverde RH. Differences in adult day services center characteristics by center ownership: United States, 2012pdf icon. NCHS data brief, no 165. Hyattsville, MD: National Center for Health Statistics. 2014.
- Harris-Kojetin L, Sengupta M, Park-Lee E, Valverde R. Long-term care services in the United States: 2013 overviewpdf icon. National Center for Health Statistics. Vital Health Stat 3(37). 2013.
- Dwyer LL, Harris-Kojetin LD, Valverde RH. Differences in adult day services center participant characteristics by center ownership: United States, 2012pdf icon. NCHS data brief, no 164. Hyattsville, MD: National Center for Health Statistics. 2014.
- National Center for Health Statistics. 2014 National Study of Long-Term Care Providers (NSLTCP) adult day services center survey restricted data file: Data description and usagepdf icon (readme). Hyattsville, MD. 2015.
- SAS Institute. SAS (release 9.3) [computer software]. 2011.
- RTI International. SUDAAN (release 11.0.0) [computer software]. 2012.
- StataCorp. Stata Statistical Software (release 12.1) [computer software]. 2011.
Suggested citation
Park-Lee E, Harris-Kojetin LD, Rome V, Lendon JP. Variation in adult day services center participant characteristics, by center ownership: United States, 2014. NCHS data brief, no 227. Hyattsville, MD: National Center for Health Statistics. 2015.
Copyright information
All material appearing in this report is in the public domain and may be reproduced or copied without permission; citation as to source, however, is appreciated.
National Center for Health Statistics
Charles J. Rothwell, M.S., M.B.A., Director
Nathaniel Schenker, Ph.D., Deputy Director
Jennifer H. Madans, Ph.D., Associate Director for Science
Division of Health Care Statistics
Clarice Brown, M.S., Director
Alexander Strashny, Ph.D., Associate Director for Science