Variation in Residential Care Community Resident Characteristics, by Size of Community: United States, 2014
- In 2014, residents in larger communities were older than those in smaller communities.
- A higher percentage of residents in communities with 4–25 beds were receiving Medicaid compared with residents in larger communities.
- The prevalence of Alzheimer’s disease and depression was higher among residents in communities with 4–25 beds than in larger communities.
- The percentage of residents needing assistance in bathing, dressing, toileting, transferring, walking, and eating was highest in communities with 4–25 beds.
- The percentage of residents who had fallen in the previous 90 days increased with increasing community bed size.
- Summary
- Definitions
- Data source and methods
- About the authors
- References
- Suggested citation
NCHS Data Brief No. 223, November 2015
PDF Versionpdf icon (307 KB)
Manisha Sengupta, Ph.D.; Lauren D. Harris-Kojetin, Ph.D.; and Christine Caffrey, Ph.D.
Key findings
Data from the 2014 National Study of Long-Term Care Providers
- Residents in residential care communities with more than 25 beds were older than those in smaller communities.
- A higher percentage of residents in communities with 4–25 beds were receiving Medicaid compared with residents in larger communities.
- The prevalence of Alzheimer’s disease and depression was higher among residents of communities with 4–25 beds than in larger communities, but the prevalence of cardiovascular disease was lower.
- The percentage of residents needing assistance in bathing, dressing, toileting, transferring, walking, and eating was highest in communities with 4–25 beds.
- The percentage of residents who had fallen in the previous 90 days increased with increasing community bed size.
Residents of residential care communities are persons who cannot live independently but generally do not require the skilled care provided by nursing homes. There were 835,200 current residents in residential care communities in 2014 (1,2). “Current residents” refers to those who were living in the community on the day of data collection (as opposed to the total number of residents who lived in the community at some time during the calendar year). This report presents national estimates of selected characteristics of current residents in 2014 and compares these characteristics by community bed size. State-level estimates for these characteristics are available online at: https://www.cdc.gov/nchs/nsltcp/nsltcp_products.htm.
Keywords: assisted living, long-term care services and supports, National Study of Long-Term Care Providers
In 2014, residents in larger communities were older than those in smaller communities.
- Overall, the majority of residents of residential care communities (53%) were aged 85 and over (Figure 1).
- In 2014, 15% of residents living in residential care communities with 4–25 beds were under age 65, compared with 5% in communities with more than 50 beds.
- Residents aged 85 and over made up a higher percentage in communities with more than 25 beds (54%) than in communities with 4–25 beds (47%).
Figure 1. Age distribution of residential care residents, by community size: United States, 2014
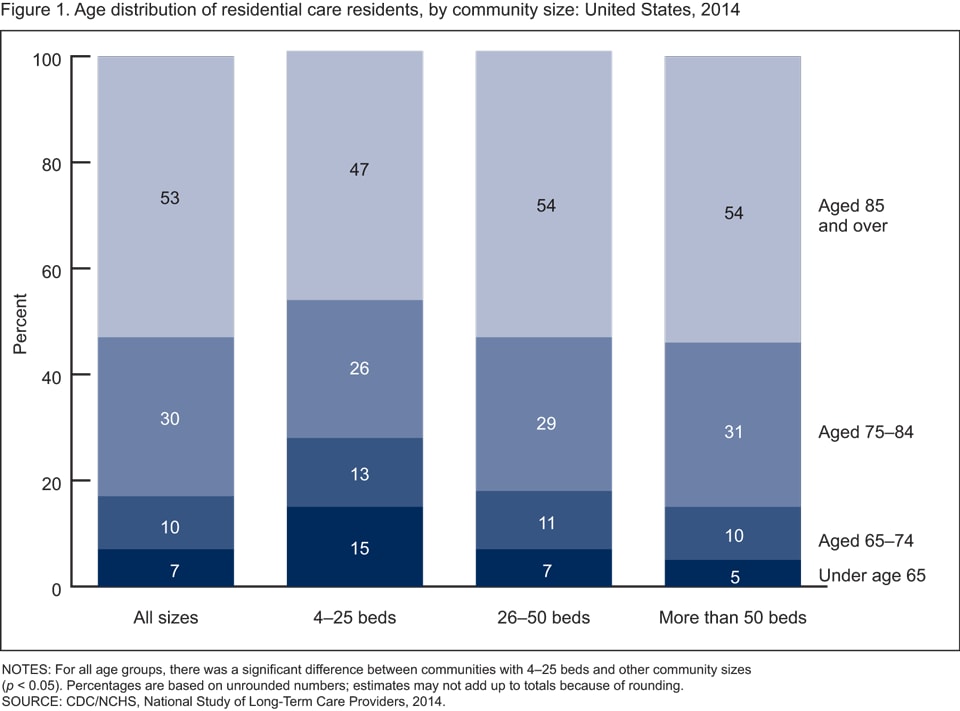
NOTES: For all age groups, there was a significant difference between communities with 4–25 beds and other community sizes (p < 0.05). Percentages are based on unrounded numbers; estimates may not add up to totals because of rounding.
SOURCE: CDC/NCHS, National Study of Long-Term Care Providers, 2014.
A higher percentage of residents in communities with 4–25 beds were receiving Medicaid compared with residents in larger communities.
- Overall, 70% of residents in residential care communities were female. The percentage of females was slightly higher in communities with 26–50 beds (72%) than in communities with 4–25 beds (69%) or more than 50 beds (70%) (Figure 2).
- Eighty percent of residents in communities with 4–25 beds were non-Hispanic white, compared with 87% in communities with 26–50 beds and 85% in communities with more than 50 beds.
- The percentage of residents receiving Medicaid decreased with increasing bed size. Twenty-three percent of residents in communities with 4–25 beds had at least some services paid for by Medicaid, compared with 17% of residents in communities with 26–50 beds and 13% in communities with more than 50 beds.
Figure 2. Selected characteristics of residential care residents, by community size: United States, 2014
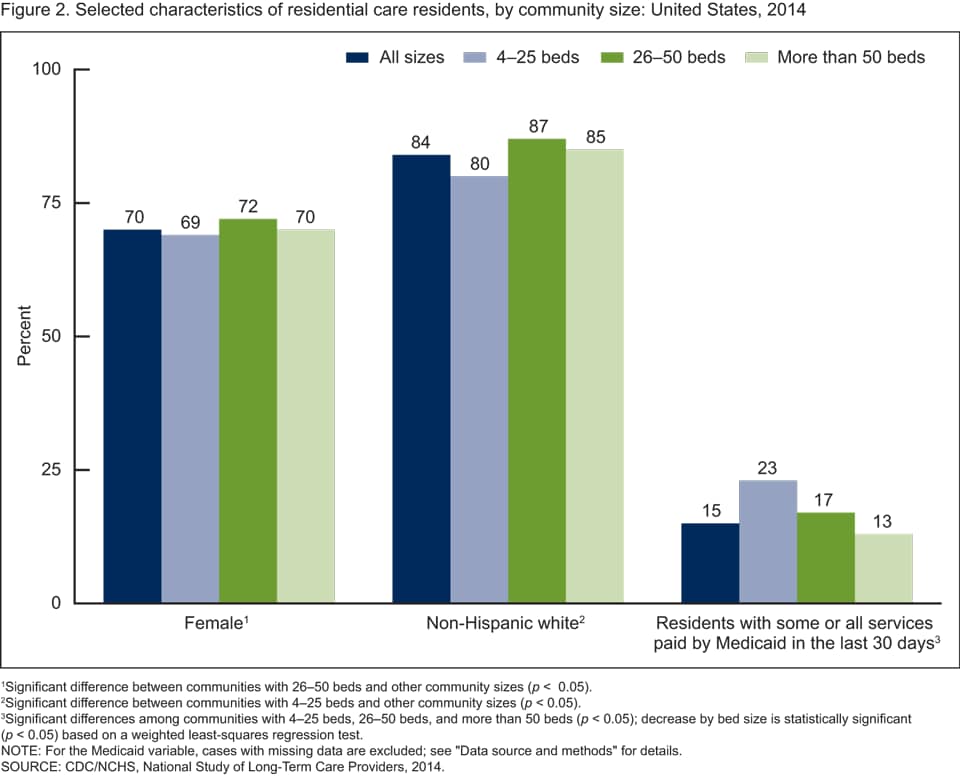
1Significant difference between communities with 26–50 beds and other community sizes (p < 0.05).
2Significant difference between communities with 4–25 beds and other community sizes (p < 0.05).
3Significant differences among communities with 4–25 beds, 26–50 beds, and more than 50 beds (p < 0.05); decrease by bed size is statistically significant (p < 0.05) based on a weighted least-squares regression test.
NOTE: For the Medicaid variable, cases with missing data are excluded; see “Data source and methods” for details.
SOURCE: CDC/NCHS, National Study of Long-Term Care Providers, 2014.
The prevalence of Alzheimer’s disease and depression was higher among residents in communities with 4–25 beds than in larger communities.
- Overall, nearly one-half of all residents were diagnosed with cardiovascular disease (46%) and about 4 in 10 were diagnosed with Alzheimer’s disease or other dementias; fewer were diagnosed with depression (23%) or diabetes (17%) (Figure 3).
- A higher percentage of residents in communities with 26–50 beds (47%) and more than 50 beds (46%) had cardiovascular disease compared with residents in smaller communities (43%).
- The percentage of residents with Alzheimer’s disease and other dementias decreased with increasing community size, from 47% of residents in communities with 4–25 beds, to 42% in communities with 26–50 beds, to 37% in larger communities.
- A higher percentage of residents in communities with 4–25 beds had ever been diagnosed with depression (27%) compared with residents in communities with 26–50 beds (23%) or more than 50 beds (22%).
Figure 3. Selected diagnosed medical conditions among residential care residents, by community size: United States, 2014
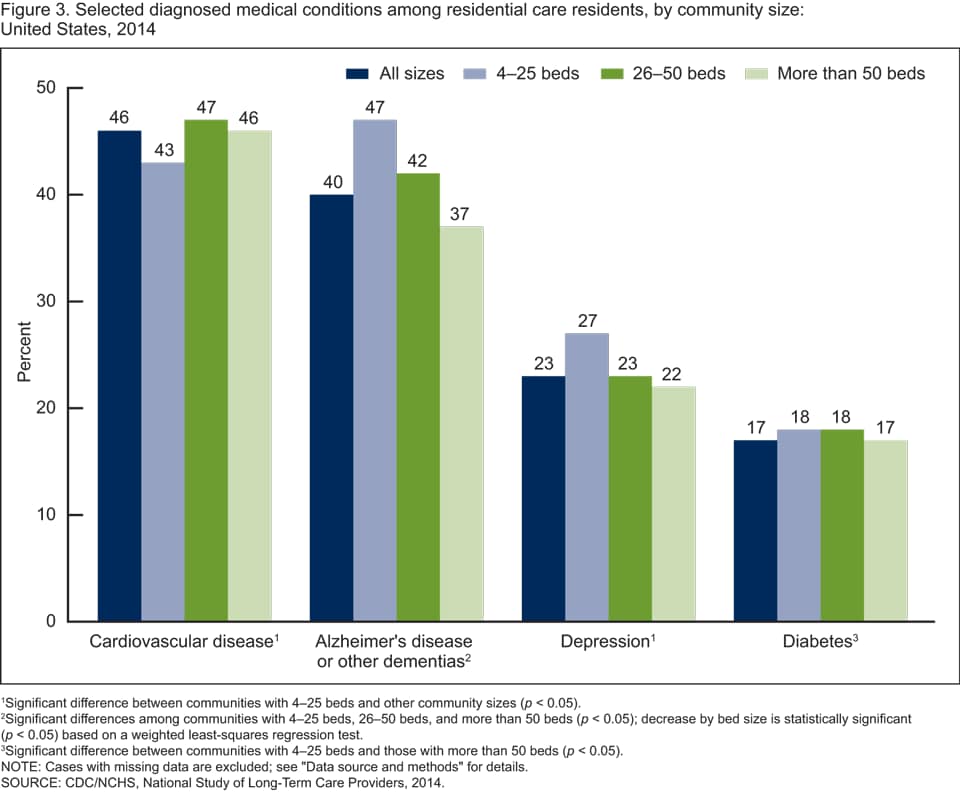
1Significant difference between communities with 4–25 beds and other community sizes (p < 0.05).
2Significant differences among communities with 4–25 beds, 26–50 beds, and more than 50 beds (p < 0.05); decrease by bed size is statistically significant (p < 0.05) based on a weighted least-squares regression test.
3Significant difference between communities with 4–25 beds and those with more than 50 beds (p< 0.05).
NOTE: Cases with missing data are excluded; see “Data source and methods” for details.
SOURCE: CDC/NCHS, National Study of Long-Term Care Providers, 2014.
The percentage of residents needing assistance in bathing, dressing, toileting, transferring, walking, and eating was highest in communities with 4–25 beds.
- About 62% of residents overall needed assistance with bathing, which was the most frequent functional limitation among residents (Figure 4).
- The percentage of residents needing assistance with bathing decreased with increasing community bed size, with 77% of those in communities with 4–25 beds needing help in bathing compared with 58% of those in communities with more than 50 beds.
Figure 4. Need for assistance with selected activities of daily living among residential care residents, by community size: United States, 2014
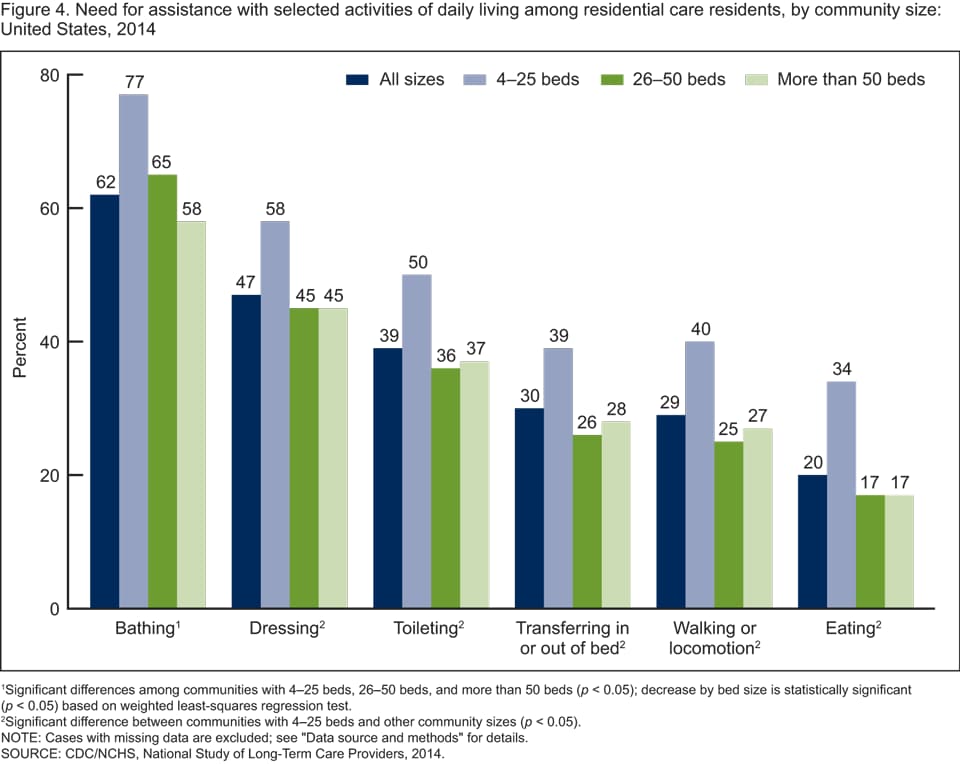
1Significant differences among communities with 4–25 beds, 26–50 beds, and more than 50 beds (p < 0.05); decrease by bed size is statistically significant (p < 0.05) based on weighted least-squares regression test.
2Significant difference between communities with 4–25 beds and other community sizes (p < 0.05).
NOTE: Cases with missing data are excluded; see “Data source and methods” for details.
SOURCE: CDC/NCHS, National Study of Long-Term Care Providers, 2014.
The percentage of residents who had fallen in the previous 90 days increased with increasing community bed size.
- Overall, about 2 in 10 residents in residential care communities had a fall in the previous 90 days (21%). The percentage increased with increasing community bed size, from 11% of residents in communities with 4–25 beds to 24% in communities with more than 50 beds (Figure 5).
- About 1 in 10 residents in residential care communities visited a hospital emergency department in the previous 90 days (12%). A slightly higher percentage of residents in communities with more than 50 beds (13%) had an emergency department visit compared with residents in communities with 26–50 beds (11%).
- A slightly higher percentage of residents in communities with more than 50 beds were discharged from overnight hospital stays in the previous 90 days (9%), compared with residents in communities with 50 or fewer beds (7%).
Figure 5. Falls, emergency department visits, and discharges from overnight hospital stays, among residential care residents, by community size: United States, 2014

1Significant differences among communities with 4–25 beds, 26–50 beds, and more than 50 beds (p < 0.05); increase by bed size is statistically significant (p < 0.05) based on a weighted least-squares regression test.
2Significant difference between communities with 26–50 beds and those with more than 50 beds (p < 0.05).
3Significant difference between communities with more than 50 beds and other community sizes (p < 0.05).
NOTE: Cases with missing data are excluded; see “Data source and methods” for details.
SOURCE: CDC/NCHS, National Study of Long-Term Care Providers, 2014.
Summary
In 2014 in the United States, the resident population living in residential care communities with 4–25 beds differed from the resident population living in larger residential care communities in a variety of sociodemographic, functional and health status, and service utilization characteristics.
Compared with residents in communities with more than 25 beds, a higher percentage of residents in 4- to 25-bed communities were older, receiving Medicaid, living with Alzheimer’s disease or other dementias or depression, and needing assistance with each of the six activities of daily living (ADLs) examined. Conversely, compared with residents in communities with more than 25 beds, a lower percentage of residents in communities with 4–25 beds were non-Hispanic white, lived with cardiovascular disease, or had fallen in the previous 90 days.
This report presents the most current national estimates of selected characteristics of residents in residential care communities and compares these characteristics by bed size. This brief profile of residential care residents provides useful information to policymakers, providers, researchers, and consumer advocates as they plan how best to meet the needs of an aging population. The findings also highlight the diversity of residents across the different sizes of residential care communities. Corresponding state estimates, and their standard errors, for the national figures in this data brief can be found at https://www.cdc.gov/nchs/nsltcp/nsltcp_products.htm.
Definitions
Assistance with selected activities of daily living (ADLs): Refers to needing any help or supervision from another person, or use of special equipment for assistance, with six limitations in ADLs (bathing, walking or locomotion, dressing, transferring in and out of a bed, toileting, and eating) that reflect a resident’s capacity for self-care.
Cardiovascular disease: Includes conditions such as heart disease, stroke, and high blood pressure.
Community bed size: Residents were grouped based on the number of licensed, registered, or certified residential care beds (both occupied and unoccupied) in their residential care community: 4–25 beds, 26–50 beds, and more than 50 beds.
Emergency department visits: Includes residents who were treated at least once in a hospital emergency department in the 90 days prior to the survey.
Falls: Includes residents with at least one onsite or offsite fall in the 90 days prior to the survey.
Overnight hospital stays: Includes residents with at least one discharge from an overnight hospital stay in the 90 days prior to the survey. Trips to the emergency department that did not result in a discharge from an overnight hospital stay were excluded.
Residential care communities: Includes assisted living communities and other residential care communities (e.g., personal care homes, adult care homes, board care homes, or adult foster care) that meet the study eligibility criteria described in the “Data source and methods” section.
Residents with some or all long-term care services paid for by Medicaid: Refers to residents who had some or all of their long-term care services paid for by Medicaid during the 30 days prior to the survey.
Data source and methods
Data for this report are from the residential care community survey component of the 2014 wave of the biennial National Study of Long-Term Care Providers (NSLTCP), conducted by the Centers for Disease Control and Prevention’s (CDC) National Center for Health Statistics (NCHS). To be eligible for the study, a residential care community must (a) be regulated by the state to provide room and board with at least two meals a day, around-the-clock onsite supervision, and help with personal care such as bathing and dressing or health-related services such as medication management; (b) have four or more licensed, certified, or registered beds; (c) have at least one resident currently living in the community at the time of the survey; and (d) serve a predominantly adult population. The survey used a combination of probability sampling and taking a census. More details about the NSLTCP design and outcomes are available elsewhere (2,3). The percentage of cases with missing data for variables in this report ranged from 1.7% for type of ownership to 7.4% for computerized support for electronic health information exchange with hospitals. These cases were excluded from the analyses on a variable-by-variable basis.
Data analyses were performed using the following statistical packages: SAS, version 9.3 (SAS Institute, Cary, N.C.); SAS-callable SUDAAN, version 11.0.0 (RTI International, Research Triangle Park, N.C., 2012); and STATA/SE, version 12.1 (StataCorp, College Station, Texas, 2013). Statements of differences among subgroups are based on two-tailed chi-squared and t tests with significance at the p < 0.05 level. If a chi-squared test was statistically significant, a post hoc t test procedure was used to make pairwise comparisons among different community bed sizes. A weighted least-squares regression method was used to test the significance of linear trends in bed size. The estimate of the number of residential care communities and residents varied among the 2010 National Survey of Residential Care Facilities and the 2012 and 2014 waves of NSLTCP (1–6).
About the authors
Manisha Sengupta, Lauren D. Harris-Kojetin, and Christine Caffrey are with CDC’s National Center for Health Statistics, Division of Health Care Statistics.
References
- Caffrey C, Harris-Kojetin L, Sengupta M. Variation in operating characteristics of residential care communities, by size of community: United States, 2014pdf icon. NCHS data brief, no 222. Hyattsville, MD: National Center for Health Statistics. 2015.
- National Center for Health Statistics. 2014 National Study of Long-Term Care Providers survey methodology and documentationpdf icon. Hyattsville, MD.
- National Center for Health Statistics. 2014 National Study of Long-Term Care Providers (NSLTCP) residential care communities survey restricted data file: Data description and usage (readme)pdf icon. Hyattsville, MD. 2015.
- Caffrey C, Harris-Kojetin L, Rome V, Sengupta M. Characteristics of residents living in residential care communities, by community bed size: United States, 2012pdf icon. NCHS data brief, no 171. Hyattsville, MD: National Center for Health Statistics. 2014.
- Park-Lee E, Caffrey C, Sengupta M, et al. Residential care facilities: A key sector in the spectrum of long-term care providers in the United Statespdf icon. NCHS data brief, no 78. Hyattsville, MD: National Center for Health Statistics. 2011.
- Caffrey C, Sengupta M, Park-Lee E, et al. Residents living in residential care facilities: United States, 2010pdf icon. NCHS data brief, no 91. Hyattsville, MD: National Center for Health Statistics. 2012.
Suggested citation
Sengupta M, Harris-Kojetin LD, Caffrey C. Variation in residential care community resident characteristics, by size of community: United States, 2014. NCHS data brief, no 223. Hyattsville, MD: National Center for Health Statistics. 2015.
Copyright information
All material appearing in this report is in the public domain and may be reproduced or copied without permission; citation as to source, however, is appreciated.
National Center for Health Statistics
Charles J. Rothwell, M.S., M.B.A., Director
Nathaniel Schenker, Ph.D., Deputy Director
Jennifer H. Madans, Ph.D., Associate Director for Science
Division of Health Care Statistics
Clarice Brown, M.S., Director
Alexander Strashny, Ph.D., Associate Director for Science