How Does Cause of Death Contribute to the Hispanic Mortality Advantage in the United States?
- Key findings
- How is the Hispanic mortality advantage reflected in life expectancy at birth in 2013?
- What causes of death influenced the difference in life expectancy between Hispanic and non-Hispanic white males in 2013?
- What causes of death influenced the difference in life expectancy between Hispanic and non-Hispanic black males in 2013?
- What causes of death influenced the difference in life expectancy between Hispanic and non-Hispanic white females in 2013?
- What causes of death influenced the difference in life expectancy between Hispanic and non-Hispanic black females in 2013?
- Summary
- Definitions
- Data source and methods
- About the authors
- References
- Suggested citation
NCHS Data Brief No. 221, November 2015
PDF Versionpdf icon (723 KB)
Elizabeth Arias, Ph.D.; Kenneth D. Kochanek, M.A.; and Robert N. Anderson, Ph.D.
Key findings
Data from the National Vital Statistics System, Mortality
- In 2013, life expectancy at birth for Hispanic males was 2.6 years greater than that of non-Hispanic white males and 7.3 years greater than that of non-Hispanic black males.
- The Hispanic male advantage was due to lower death rates from cancer, heart disease, unintentional injuries, chronic lower respiratory diseases, suicide, homicide, perinatal conditions, stroke, and diabetes.
- Life expectancy at birth for Hispanic females was 2.6 years greater than that of non-Hispanic white females and 5.7 years greater than that of non-Hispanic black females.
- The Hispanic female advantage was due to lower death rates from cancer, heart disease, chronic lower respiratory diseases, stroke, unintentional injuries, suicide, perinatal conditions, diabetes, Alzheimer’s disease, and kidney disease.
The Hispanic population in the United States has lower overall mortality and higher life expectancy at birth than the non-Hispanic white and non-Hispanic black populations. The expectation has been that the Hispanic population should exhibit a mortality profile that is similar to that of the non-Hispanic black population, not one that is advantaged relative to the non-Hispanic white population (1–4). In this report, differences in the leading causes of death between the Hispanic and non-Hispanic white and black populations are explored to determine how they contributed to the life expectancy advantage of the Hispanic population in 2013.
Keywords: life expectancy, race, ethnicity, National Vital Statistics System, Mortality
How is the Hispanic mortality advantage reflected in life expectancy at birth in 2013?
Life expectancy at birth for the total U.S. population in 2013 was 78.8 years. The Hispanic population had a life expectancy (81.6 years) that was 2.7 years greater than the non-Hispanic white population (78.9 years) and 6.5 years greater than the non-Hispanic black population (75.1 years) (Figure 1). Hispanic females had the highest life expectancy at birth (83.8 years), followed by non-Hispanic white females (81.2 years), Hispanic males (79.1 years), non-Hispanic black females (78.1 years), non-Hispanic white males (76.5 years), and non-Hispanic black males (71.8 years) (5).
Figure 1. Life expectancy at birth, by Hispanic origin, race, and sex: United States, 2013
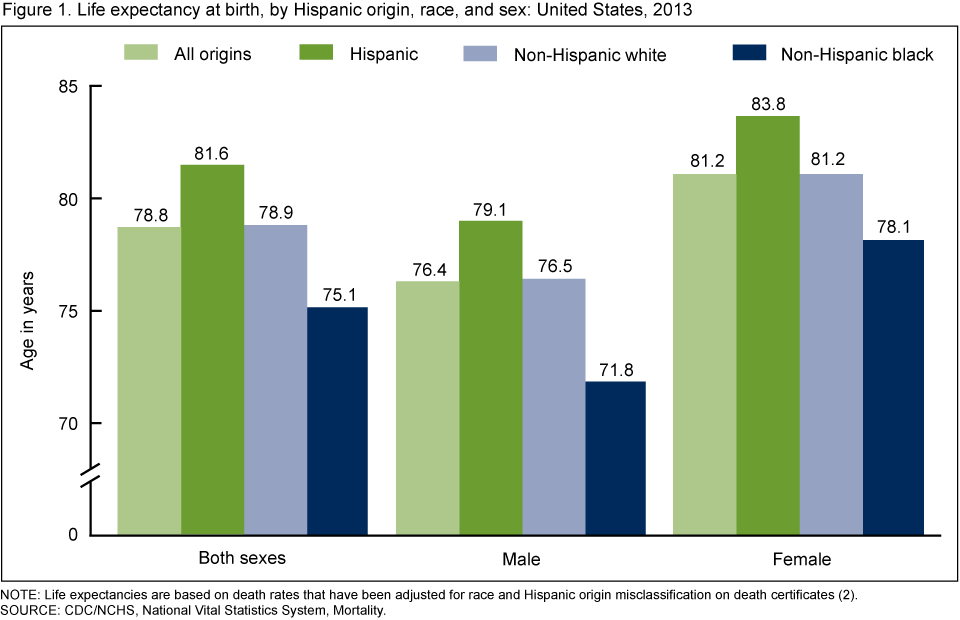
NOTE: Life expectancies are based on death rates that have been adjusted for race and Hispanic origin misclassification on death certificates (2).
SOURCE: CDC/NCHS, National Vital Statistics System, Mortality.
What causes of death influenced the difference in life expectancy between Hispanic and non-Hispanic white males in 2013?
- Life expectancy at birth for Hispanic males was higher by 2.6 years than that of non-Hispanic white males because of lower death rates due to cancer, heart disease, unintentional injuries, suicide, chronic lower respiratory diseases, and Parkinson’s disease (Figure 2). Lower death rates for these causes accounted for 83% of the Hispanic male advantage.
- Lower cancer mortality for Hispanic males accounted for a gain of 0.741 years in life expectancy. Lung cancer alone accounted for 0.442 years or 59.6% of the Hispanic male cancer mortality advantage.
- The Hispanic male life expectancy advantage would have been greater if not for higher death rates due to homicide, diabetes, chronic liver disease, and HIV disease, which accounted for 75.4% of the Hispanic male disadvantage, or a loss of 0.444 years.
Figure 2. Contribution of the leading causes of death to the difference in life expectancy between Hispanic and non-Hispanic white males: United States, 2013
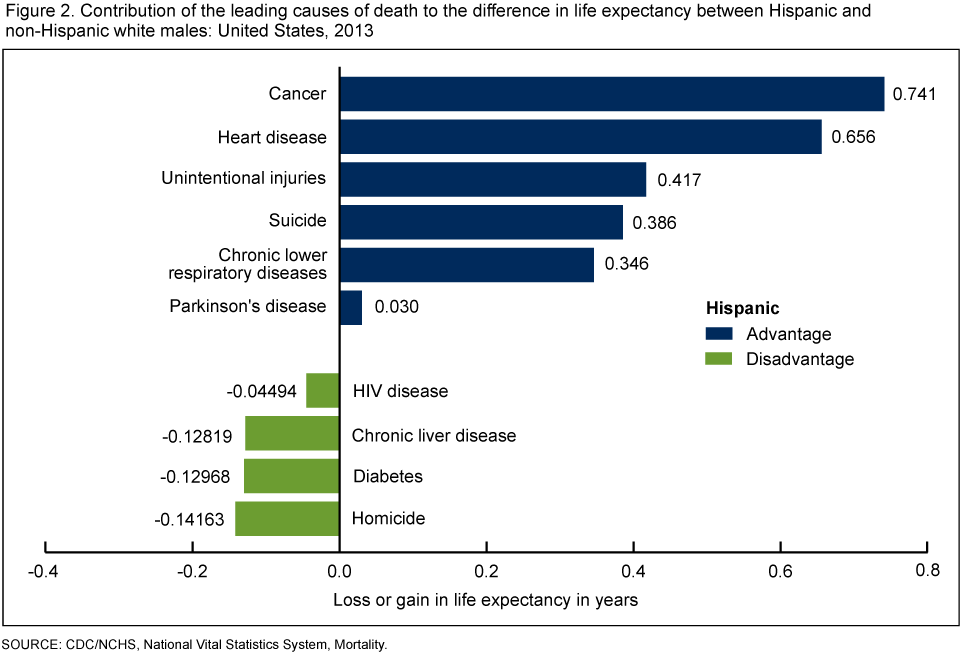
SOURCE: CDC/NCHS, National Vital Statistics System, Mortality.
What causes of death influenced the difference in life expectancy between Hispanic and non-Hispanic black males in 2013?
- Hispanic male life expectancy was 7.3 years greater than that of non-Hispanic black males.
- Lower death rates for Hispanic males due to heart disease, cancer, homicide, perinatal conditions, stroke, unintentional injuries, chronic lower respiratory diseases, diabetes, kidney disease, and HIV disease (Figure 3) accounted for 78.9% of the Hispanic male advantage.
- Heart disease accounted for a gain of 1.771 years in life expectancy for Hispanic males. Cancer mortality accounted for a gain of 1.425 years. Lung cancer alone accounted for 0.593 years or 41.6% of the Hispanic male cancer mortality advantage.
- The Hispanic male life expectancy advantage would have been greater if not for higher death rates due to chronic liver disease, Parkinson’s disease, and viral hepatitis, which accounted for 98.9% of the Hispanic male disadvantage, or a loss of 0.194 years.
Figure 3. Contribution of the leading causes of death to the difference in life expectancy between Hispanic and non-Hispanic black males: United States, 2013
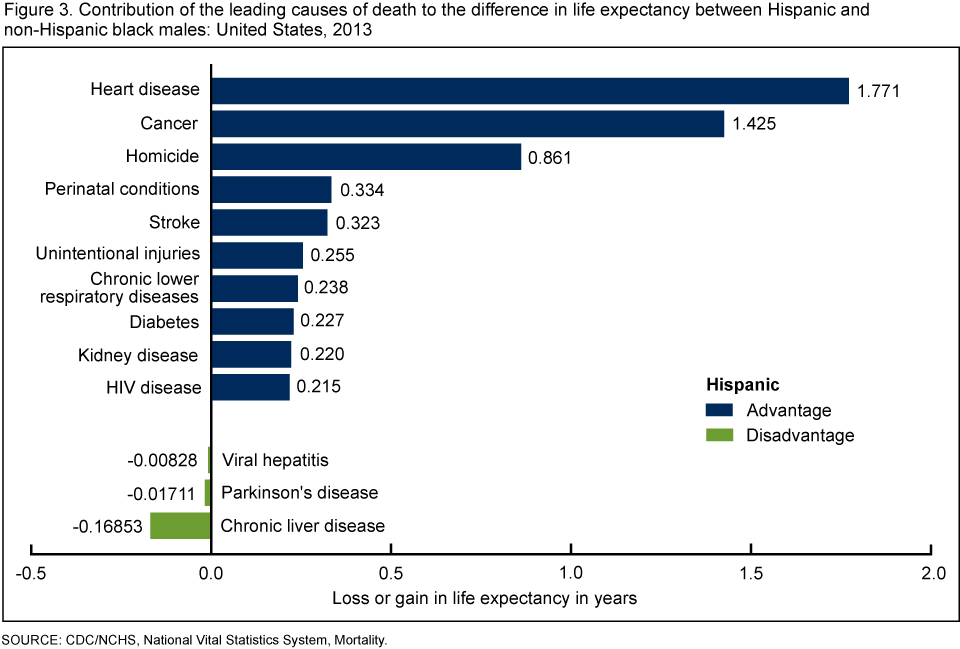
SOURCE: CDC/NCHS, National Vital Statistics System, Mortality.
What causes of death influenced the difference in life expectancy between Hispanic and non-Hispanic white females in 2013?
- Hispanic female life expectancy was 2.6 years greater than that of non-Hispanic white females.
- Lower death rates for Hispanic females due to cancer, chronic lower respiratory diseases, heart disease, unintentional injuries, suicides, and Alzheimer’s disease (Figure 4) accounted for 76.7% of the Hispanic female advantage.
- Cancer accounted for a gain of 0.764 years in life expectancy for Hispanic females. Lung cancer alone accounted for 0.512 years or 67% of the Hispanic female cancer mortality advantage.
- Higher death rates for Hispanic females due to diabetes, chronic liver disease, perinatal conditions, and viral hepatitis accounted for 81.2% of the Hispanic female disadvantage, or a loss of life expectancy of 0.275 years.
Figure 4. Contribution of the leading causes of death to the difference in life expectancy between Hispanic and non-Hispanic white females: United States, 2013
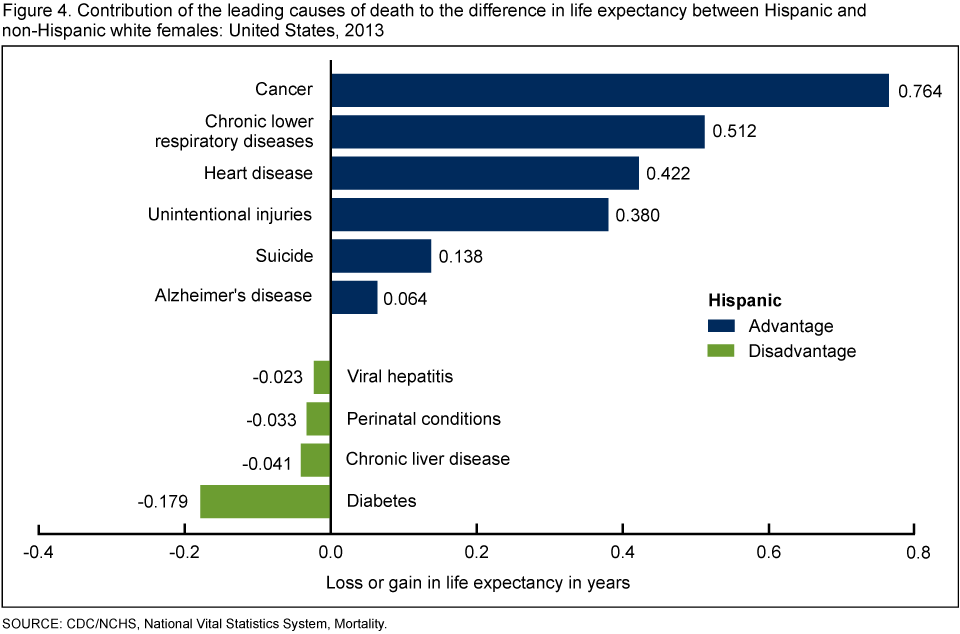
SOURCE: CDC/NCHS, National Vital Statistics System, Mortality.
What causes of death influenced the difference in life expectancy between Hispanic and non-Hispanic black females in 2013?
- Hispanic female life expectancy was 5.7 years higher than that of non-Hispanic black females.
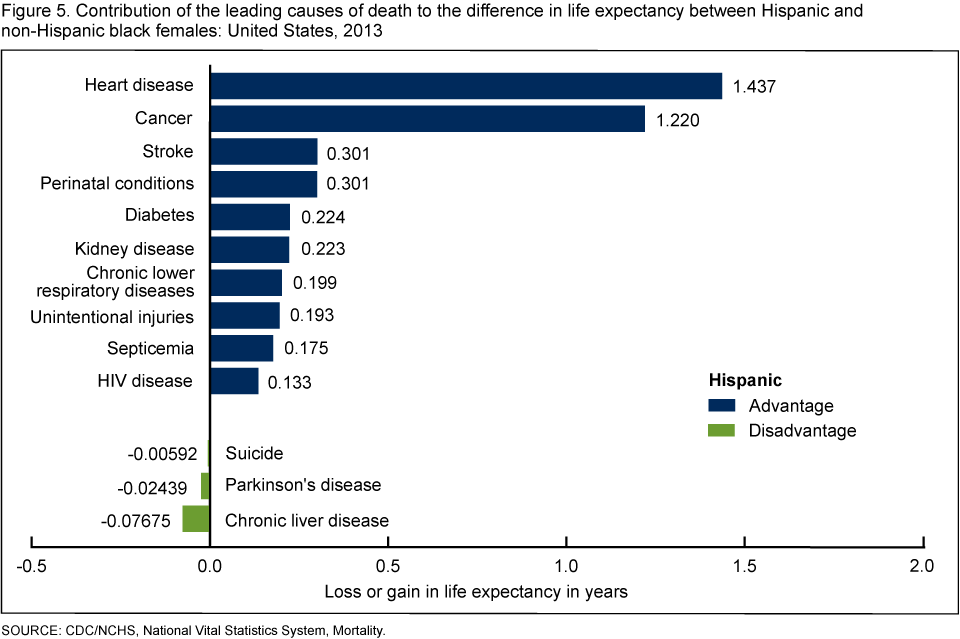
- Lower death rates for Hispanic females due to heart disease, cancer, stroke, perinatal conditions, diabetes, kidney disease, chronic lower respiratory diseases, unintentional injuries, septicemia, and HIV disease (Figure 5) accounted for 75.2% of the Hispanic female advantage.
- Heart disease accounted for a gain of 1.437 years in life expectancy for Hispanic females. Cancer accounted for 1.220 years and lung cancer alone accounted for 0.424 years or 34.8% of the Hispanic female cancer mortality advantage.
- Higher death rates for Hispanic females due to chronic liver disease, Parkinson’s disease, and suicides accounted for 91.2% of the Hispanic female disadvantage, or a loss of life expectancy of 0.107 years.
Figure 5. Contribution of the leading causes of death to the difference in life expectancy between Hispanic and non-Hispanic black females: United States, 2013
SOURCE: CDC/NCHS, National Vital Statistics System, Mortality.
Summary
In 2013, the Hispanic population had higher life expectancy at birth than both the non-Hispanic white and non-Hispanic black populations. These findings are consistent with those of numerous mortality studies conducted over the past 4 decades and are based on life table estimates that have been adjusted for race and Hispanic origin misclassification on U.S. death certificates (1–4). Approximately 5% of Hispanic decedents are misclassified, while less than 1% of non-Hispanic black and 0.5% of non-Hispanic white decedents are misclassified (2). The causes of the Hispanic mortality advantage have not been definitively identified.
In this report, the relationship between cause of death and life expectancy was explored to better understand the mechanisms behind the life expectancy differentials between the Hispanic and each of the non-Hispanic white and non-Hispanic black populations. The difference between the Hispanic and non-Hispanic white populations was a function of the Hispanic population experiencing lower mortality from cancer, heart disease, chronic lower respiratory diseases, unintentional injuries, suicides, Alzheimer’s disease, and Parkinson’s disease. The difference between the Hispanic and non-Hispanic black populations was due to the Hispanic population having lower mortality from heart disease, cancer, stroke, perinatal conditions, diabetes, homicide, unintentional injuries, chronic lower respiratory diseases, kidney disease, HIV disease, and septicemia. In both comparisons, the causes of death contributing to the Hispanic advantage were the same across sex with minor exceptions. For example, homicide accounts for a large portion of the Hispanic male life expectancy advantage relative to non-Hispanic black males, but plays no role with respect to the Hispanic female advantage.
This report is the third in a series of data briefs that explore the causes of death contributing to differences in life expectancy between detailed ethnic and racial populations in the United States (6,7).
Definitions
Cause-of-death classification: Medical information—including injury diagnoses and external causes of injury—that is entered on death certificates filed in the United States is classified and coded in accordance with the International Statistical Classification of Diseases and Related Health Problems, Tenth Revision (ICD–10) (8). Corresponding cause-of-death categories and ICD–10 codes presented in this report are as follows:
Heart disease [Diseases of heart (I00–I09, I11, I13, I20–I51)]
Cancer [Malignant neoplasms (C00–C97)]
Lung Cancer [Malignant neoplasms of trachea, bronchus, and lung (C33–C34)]
Stroke [Cerebrovascular diseases (I60–I69)]
Chronic lower respiratory diseases (J40–J47)
Unintentional injuries [Accidents (V01–X59, Y85–Y86)]
Alzheimer’s disease (G30)
Diabetes [Diabetes mellitus (E10–E14)]
Suicide [Intentional self-harm (*U03, X60–X84, Y87.0)]
Chronic liver disease [Chronic liver disease and cirrhosis (K70, K73–K74)]
Parkinson’s disease (G20–G21)
Homicide [Assault (*U01–*U02, X85–Y09, Y87.1)]
Perinatal conditions [Certain conditions originating in the perinatal period (P00–P96)]
HIV disease [Human immunodeficiency virus (HIV) disease (B20–B24)]
Kidney disease [Nephritis, nephrotic syndrome, and nephrosis (N00–N07, N17–N19, N25– N27)]
Viral hepatitis (B15–B19)
Septicemia (A40–A41)
Life expectancy: The average number of years that a group of infants would live if the group was to experience throughout life the age-specific death rates present in the year of birth; also referred to as period or current life expectancy (9).
Data source and methods
All data are from the 2013 mortality file from the National Vital Statistics System. Life table methodology is explained in the report “United States Life Tables, 2011” (9). A complete description of the Arriaga life table partitioning methodology can be found in references 10 and 11. There is no information currently available about cause of death misclassification, and there is no reason to believe cause of death classification differs by race and ethnicity. The most current research shows that the factors associated with the quality of racial and ethnic classification on death certificates are predominantly contextual and demographic, including geography, coethnic concentration, and nativity (12).
About the authors
Elizabeth Arias, Kenneth D. Kochanek, and Robert N. Anderson are with CDC’s National Center for Health Statistics, Division of Vital Statistics, Mortality Statistics Branch.
References
- Palloni A, Arias E. Paradox lost: Explaining the Hispanic adult mortality advantage. Demography 41(3):385–415. 2004.
- Arias E. United States life tables by Hispanic origin. National Center for Health Statistics. Vital Health Stat 2(152). 2010.
- Markides KS, Coreil J. The health of Hispanics in the southwestern United States: An epidemiologic paradox. Public Health Rep 101(3):253–65. 1986.
- Sorlie PD, Backlund E, Johnson NJ, Rogot E. Mortality by Hispanic status in the United States. JAMA 270(20):2464–8. 1993.
- 2013 Mortality multiple cause-of-death microdata file.
- Kochanek KD, Arias E, Anderson RN. How did cause of death contribute to racial differences in life expectancy in the United States in 2010? NCHS data brief, no 125. Hyattsville, MD: National Center for Health Statistics. 2013.
- Kochanek KD, Arias E, Anderson RN. Leading causes of death contributing to decrease in life expectancy gap between black and white populations: United States, 1999–2013. NCHS data brief, no 218. Hyattsville, MD: National Center for Health Statistics. 2015.
- WHO. International statistical classification of diseases and related health problems, tenth revision. 2nd edition. Geneva, Switzerland. 2004.
- Arias E. United States life tables, 2011. National vital statistics reports; vol 64 no 11. Hyattsville, MD: National Center for Health Statistics. 2015.
- Arriaga EE. Measuring and explaining the change in life expectancies. Demography 21(1):83–96. 1984.
- Arriaga E. Changing trends in mortality decline during the last decades. In: Ruzicka L, Wunsch G, Kane P, editors. Differential mortality: Methodological issues and biosocial factors. Oxford: Clarendon Press. 1989.
- Arias E, Schauman WS, Eschbach K, et al. The validity of race and Hispanic origin reporting on death certificates in the United States. National Center for Health Statistics. Vital Health Stat 2(148). 2008.
Suggested citation
Arias E, Kochanek KD, Anderson RN. How does cause of death contribute to the Hispanic mortality advantage in the United States? NCHS data brief, no 221. Hyattsville, MD: National Center for Health Statistics. 2015.
Copyright information
All material appearing in this report is in the public domain and may be reproduced or copied without permission; citation as to source, however, is appreciated.
National Center for Health Statistics
Charles J. Rothwell, M.S., M.B.A., Director
Nathaniel Schenker, Ph.D., Deputy Director
Jennifer H. Madans, Ph.D., Associate Director for Science
Division of Vial Statistics
Delton Atkinson, M.P.H., M.P.H., P.M.P., Director
Hanyu Ni, Ph.D., M.P.H., Associate Director for Science