When Are Babies Born: Morning, Noon, or Night? Birth Certificate Data for 2013
- Key findings
- Newborns were most likely to be delivered during daytime hours.
- Time-of-birth patterns differed markedly by method of delivery.
- Cesarean deliveries with no trial of labor were most likely to occur in the morning and midday hours.
- Out-of-hospital births were most likely to occur in the early morning.
- Summary
- Definitions
- Data source and methods
- About the authors
- References
- Suggested citation
NCHS Data Brief No. 200, May 2015
PDF Version (604 KB)
T.J. Mathews, M.S.; and Sally C. Curtin, M.A.
Key findings
Data from the National Vital Statistics System
- The highest percentages of births occurred during the morning and midday hours.
- Births on Saturday and Sunday were more likely to occur in the late evening and early morning hours than births Monday through Friday.
- Compared with induced vaginal deliveries and noninduced vaginal deliveries, cesarean deliveries were the least likely to occur during the evening and early morning.
- Noninduced vaginal births were more likely than cesarean and induced vaginal births to occur in the early morning.
- Cesarean deliveries with no trial of labor were much more concentrated during the day than were cesarean deliveries with a trial of labor.
- Births delivered in hospitals and all births show similar time-of-day patterns.
As the use of medical interventions for childbirth (i.e., induction of labor and cesarean delivery) has increased during the last few decades, an increasing proportion of deliveries occur during regular daytime hours (1,2). Hospital personnel resources and maternal and newborn outcomes can be influenced by the time of day of delivery (3–7). Data on the time of day of the birth became available with the 2003 revision of the birth certificate. This report examines 2013 birth certificate data from the National Vital Statistics System (NVSS) to describe the time of day of birth by method of delivery and place of birth for a 41-state and District of Columbia (DC) reporting area that had adopted the 2003 revised birth certificate by January 2013. This reporting area represents 90% of U.S. births.
Keywords: time of day of birth, cesarean, trial of labor
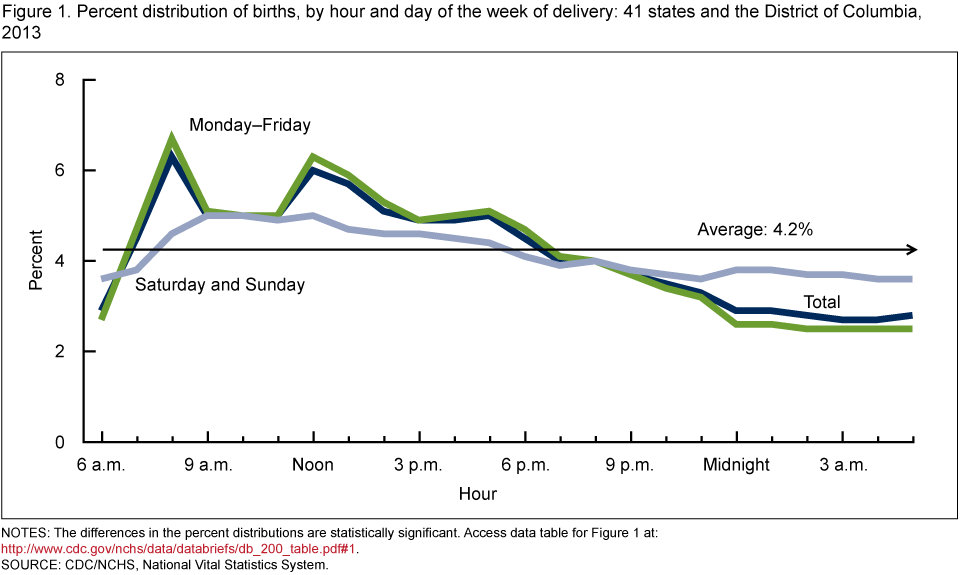
Newborns were most likely to be delivered during daytime hours.
Figure 1. Percent distribution of births, by hour and day of the week of delivery: 41 states and the District of Columbia, 2013
NOTES: The differences in the percent distributions are statistically significant. Access data table for Figure 1 [PDF – 105 KB].
SOURCE: CDC/NCHS, National Vital Statistics System.
- If births were equally timed throughout the day, an average of 4.2% of newborns would be delivered each hour. However, the percentage of deliveries is higher than 4.2% for each hour from 8:00 a.m. through 5:59 p.m. for all days of the week (Figure 1).
- The highest percentages of births occurred during the 8:00 a.m. (6.3%) and noon (6.0%) hours.
- In contrast, less than 3.0% of infants were born during each hour from midnight through 6:59 a.m.
- While weekdays show a similar pattern in the timing of births as for all births, weekend days show a more evenly distributed pattern of births throughout the day.
- Births on Saturday and Sunday were more likely than those Monday through Friday to occur in the late evening and early morning hours from 11:00 p.m. through 5:59 a.m.
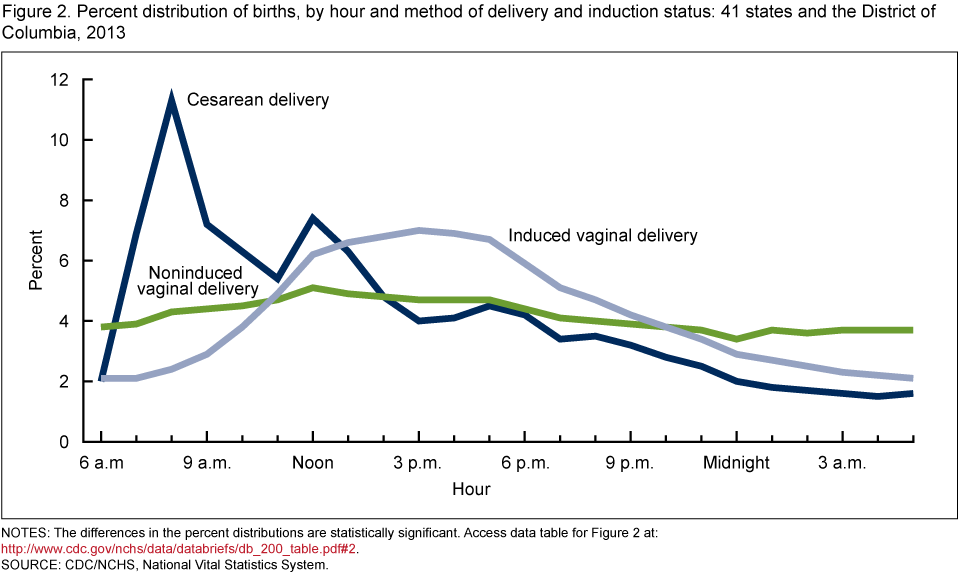
Time-of-birth patterns differed markedly by method of delivery.
- Compared with induced vaginal deliveries and noninduced vaginal deliveries, cesarean deliveries were the least likely to occur during the evening and early morning hours (Figure 2). Cesarean deliveries peaked during the 8:00 a.m. hour (11.6%) and had another smaller peak during the noon hour (7.4%).
- Noninduced vaginal deliveries were more likely to occur from 11:00 p.m. through 6:59 a.m. than were induced vaginal deliveries or cesarean deliveries.
- Noninduced vaginal deliveries had the most even distribution across the hours of the day, fluctuating close to the average of 4.2%.
- In contrast, induced vaginal deliveries rose in the morning hours, peaked in the 3:00 p.m. hour, and then declined from 6:00 p.m. onward.
Figure 2. Percent distribution of births, by hour and method of delivery and induction status: 41 states and the District of Columbia, 2013
NOTES: The differences in the percent distributions are statistically significant. Access data table for Figure 2 [PDF – 105KB].
SOURCE: CDC/NCHS, National Vital Statistics System.
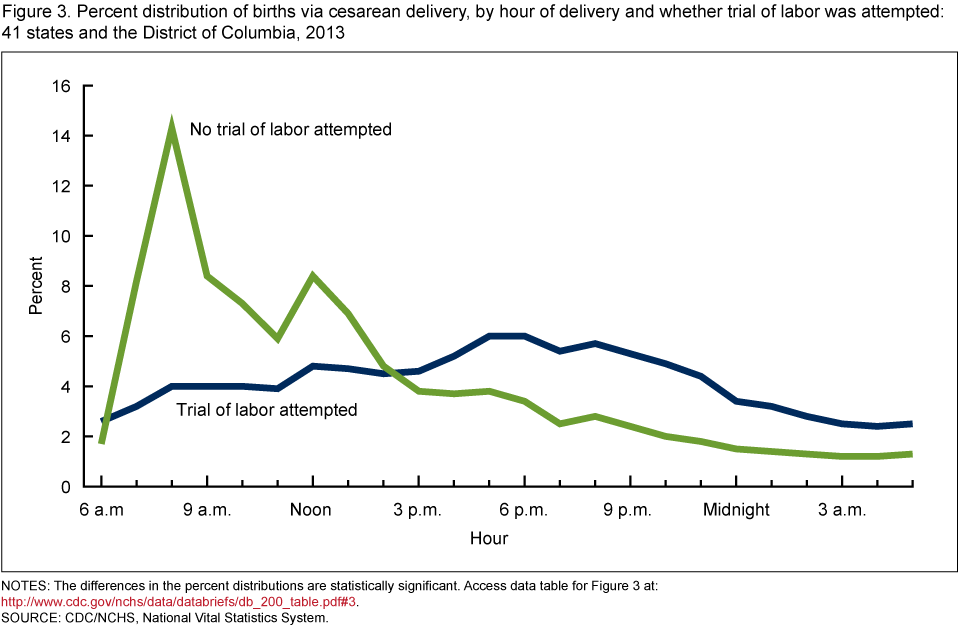
Cesarean deliveries with no trial of labor were most likely to occur in the morning and midday hours.
- The percentage of births occurring during the 8:00 a.m. hour (14.3%) for cesareans with no trial of labor was more than three times as high as for cesareans with a trial of labor (4.0%) (Figure 3).
- Cesarean births with no trial of labor peaked during the 8:00 a.m. hour and then, to a lesser extent, during the noon hour. In contrast, the percentage of births for cesareans with a trial of labor generally rose throughout the day, starting at 6:00 a.m. and peaking from 5:00 p.m. through 6:59 p.m.
- Cesareans with a trial of labor were more likely to be delivered from 4:00 p.m. through 5:59 a.m. compared with cesareans without a trial of labor, with the largest differences seen during the evening hours from 6:00 p.m. through 11:59 p.m.
Figure 3. Percent distribution of births via cesarean delivery, by hour of delivery and whether trial of labor was attempted: 41 states and the District of Columbia, 2013
NOTES: The differences in the percent distributions are statistically significant. Access data table for Figure 3 [PDF – 105KB].
SOURCE: CDC/NCHS, National Vital Statistics System.
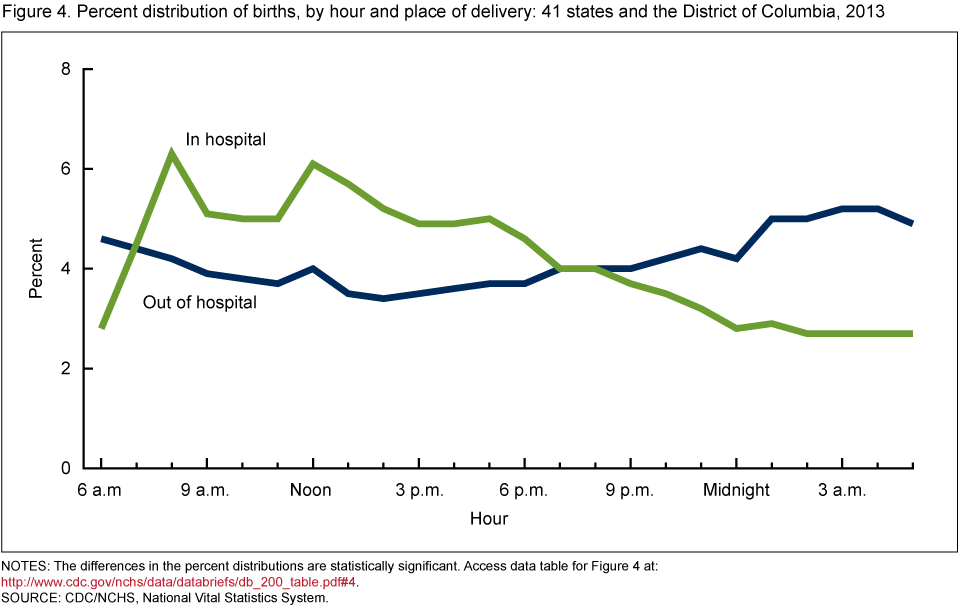
Out-of-hospital births were most likely to occur in the early morning.
- Births delivered in hospitals, which make up more than 98% of deliveries in the reporting area, and all births show similar time-of-day patterns, with peaks during the 8:00 a.m. (6.3%) and noon (6.1%) hours. Declines in the percentages of deliveries in hospitals are observed from 6:00 p.m. through 5:59 a.m. (Figure 4).
- Out-of-hospital deliveries showed a unique pattern by time of day. The percentage of deliveries declined during the hours of 6:00 a.m. through 2:59 p.m., with one uptick at noon, and increased from 3:00 p.m. through 3:59 a.m., with a brief dip at midnight.
- Births delivered out of hospital were most likely to occur in the early morning hours of 1:00 a.m. through 4:59 a.m. During these same hours, the lowest percentages were observed for in-hospital births.
Figure 4. Percent distribution of births, by hour and place of delivery: 41 states and the District of Columbia, 2013
NOTES: The differences in the percent distributions are statistically significant. Access data table for Figure 4 [PDF – 105KB].
SOURCE: CDC/NCHS, National Vital Statistics System.
Summary
This report presents new data from birth certificates for a 41-state and DC reporting area (90% of U.S. births) on the time of day of birth. Differences in the likelihood of delivery during the day are partly due to childbirth interventions such as cesarean delivery and induction of labor. Three distinct patterns in time of birth are evident for cesarean delivery, induced vaginal deliveries, and noninduced vaginal deliveries. Cesarean deliveries without a trial of labor and deliveries in hospitals exhibited distinct peaks at 8:00 a.m.–8:59 a.m. and noon–12:59 p.m. and were both concentrated during daytime hours. Vaginal births, particularly those that were noninduced, were more likely than cesarean births to occur during the late evening and early morning hours, although the majority were still delivered in the daytime. Births in out-of-hospital settings were most likely to occur in the early morning, starting at 1:00 a.m. In general, these births have fewer interventions (8), and thus likely exhibit a more natural time-of-day delivery pattern compared with births delivered in hospitals.
Because the data in this report represent 90% of all U.S. births, the results may not be generalizable to the United States as a whole. Time-of-birth data will be available for the entire United States in 2016.
Definitions
Time of day of birth: Reported on the birth certificate in 1-minute increments. Time-of-birth data in this report are grouped according to 24 1-hour increments, and time is grouped into the following categories:
Morning hours: 6:00 a.m.–11:59 a.m.
Afternoon hours: 12:00 p.m.–5:59 p.m.
Evening hours: 6:00 p.m.–11:59 p.m.
Early morning hours: 12:00 a.m.–5:59 a.m.
Daytime hours: 6:00 a.m.–5:59 p.m.
Vaginal birth: Delivery of the entire fetus through the vagina.
Induction of labor: Initiation of uterine contractions by medical and/or surgical means for the purpose of delivery before the spontaneous onset of labor (i.e., before labor has begun).
Cesarean birth and trial of labor
Cesarean: Extraction of the fetus, placenta, and membranes through an incision in the maternal abdominal and uterine walls.
If a cesarean birth is indicated, then the following question is asked: “If cesarean, was a trial of labor attempted?”
Trial of labor: Labor was allowed, augmented, or induced with plans for a vaginal delivery.
Data source and methods
This report contains data from the Natality Data File from the NVSS, which includes information for 41 states and DC, representing 90% of all births occurring in the United States. A description of the reporting area is given in the User Guide to the 2013 Natality Public Use File. Data for 2013 and earlier years may also be accessed from the interactive data access tool VitalStats.
All statements in the text on the differences and distributions of births by time of day are statistically significant. Differences were tested at the 0.01 level using two-sided significance tests (z tests). Distributions were tested at the 0.05 level using a chi-square test.
About the authors
T.J. Mathews and Sally C. Curtin are with CDC’s National Center for Health Statistics, Division of Vital Statistics.
References
- Martin JA, Hamilton BE, Osterman MJK, et al. Births: Final data for 2013. National vital statistics reports; vol 64 no 1. Hyattsville, MD: National Center for Health Statistics. 2015.
- Bernis C, Varea C. Hour of birth and birth assistance: From a primate to a medicalized pattern? Am J Hum Biol 24(1):14–21. 2012.
- Pasupathy D, Wood AM, Pell JP, Fleming M, Smith GC. Time of birth and risk of neonatal death at term: Retrospective cohort study. BMJ 341:c3498. 2010.
- Wu YW, Pham TN, Danielsen B, Towner D, Smith L, Johnston SC. Nighttime delivery and risk of neonatal encephalopathy. Am J Obstet Gynecol 204(1):37.e1–6. 2011.
- Woodhead N, Lindow S. Time of birth and delivery outcomes: A retrospective cohort study. J Obstet Gynaecol 32(4):335–7. 2012.
- Kalogiannidis I, Margioula-Siarkou C, Petousis S, Goutzioulis M, Prapas N, Agorastos T. Infant births during the internal night are at increased risk for operative delivery and NICU admission. Arch Gynecol Obstet 284(1):65–71. 2011.
- Gijsen R, Hukkelhoven CW, Schipper CM, Ogbu UC, de Bruin-Kooistra M, Westert G. Effects of hospital delivery during off-hours on perinatal outcome in several subgroups: A retrospective cohort study. BMC Pregnancy Childbirth 12:92. 2012.
- MacDorman MF, Mathews TJ, Declercq E. Trends in out-of-hospital births in the United States, 1990–2012. NCHS data brief, no 144. Hyattsville, MD: National Center for Health Statistics. 2014.
Suggested citation
Mathews TJ, Curtin SC. When are babies born: Morning, noon, or night? Birth certificate data for 2013. NCHS data brief, no 200. Hyattsville, MD: National Center for Health Statistics. 2015.
Copyright information
All material appearing in this report is in the public domain and may be reproduced or copied without permission; citation as to source, however, is appreciated.
National Center for Health Statistics
Charles J. Rothwell, M.S., M.B.A., Director
Nathaniel Schenker, Ph.D., Deputy Director
Jennifer H. Madans, Ph.D., Associate Director for Science
Division of Vital Statistics
Delton Atkinson, M.P.H., M.P.H., P.M.P., Director