Aging Differently: Physical Limitations Among Adults Aged 50 years and Over: United States, 2001–2007
- Key findings
- Does the prevalence of physical limitations increase with age?
- Does the prevalence of physical limitations vary by race?
- Does sex make a difference in the prevalence of physical limitations?
- Does the prevalence of physical limitations differ by educational attainment?
- Summary
- Definitions
- Data source and methods
- About the authors
- References
- Suggested Citation
NCHS Data Brief No. 20, July 2009
PDF Versionpdf icon (988 KB)
by Julia Holmes, Ph.D.; Eve Powell-Griner, Ph.D.; Margaret Lethbridge-Cejku, Ph.D.; and Kathleen Heyman, M.S.
Key findings
Data from the National Health Interview Survey
- The prevalence of physical limitations increases with age, as does the number of physical limitations among adults aged 50 years and over.
- Non-Hispanic black adults aged 50 years and over have higher rates of physical limitations than non-Hispanic white adults in each age group
- Non-Hispanic black adults generally have rates of physical limitations similar to non-Hispanic white adults a decade older.
- In each race group, women are more likely than men of the same age to have one or more physical limitations, and the gap widens with increasing age.
- Adults aged 50 years and over with less than a high school education have higher rates of physical limitations than their counterparts with at least a high school diploma.
Many adults experience increases in physical limitations with age. A physical limitation, as defined here, refers to having difficulty performing any of eight physical activities, (see “Definitions”). Physical limitation is important because of its relationship with the ability to live independently and to overall quality of life (1). Recent studies show that in the United States the onset of physical limitations occurs later in today’s older population than in earlier cohorts of the elderly (2,3). This “compression of morbidity” (4,5) means that on average older adults are living longer without experiencing a significant loss of independence in performing a wide range of activities. However, not all Americans have shared equally in this compression of morbidity; less advantaged groups such as minorities and the poor are more likely to report limitations in physical functioning at earlier ages than their more advantaged counterparts (6).
Keywords: aging, physical limitations, functional limitations, National Health Interview Survey
Does the prevalence of physical limitations increase with age?
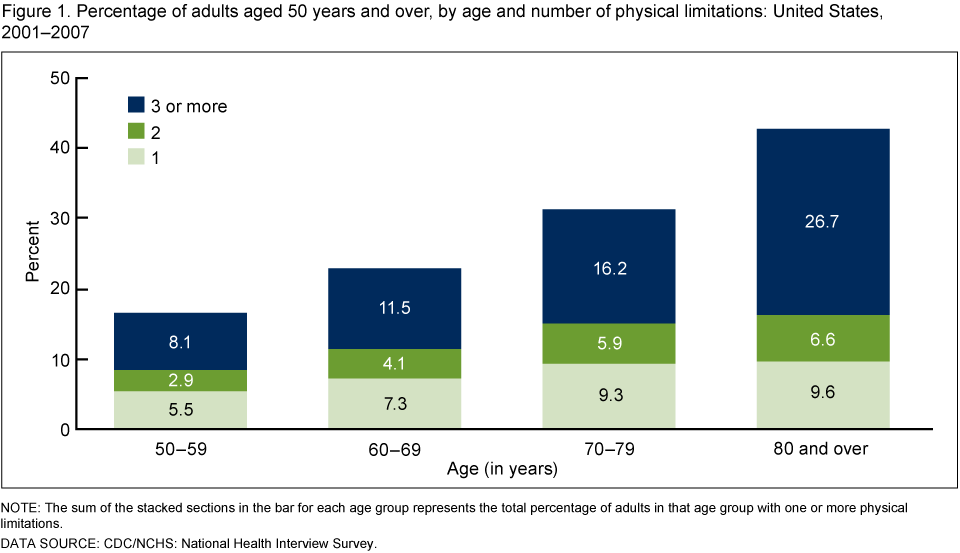 image icon
- The presence of one or more physical limitations increases with age. Adults aged 80 and over are 2.5 times as likely to have one or more physical limitations as adults aged 50–59 (43% and 17%, respectively).
- The percentage of adults with three or more physical limitations also increases with age. Among adults aged 50-59, 8% have three or more physical limitations compared with 27% of adults aged 80 and over.
Does the prevalence of physical limitations vary by race?
- Rates of physical limitations vary by race as well as age. Non-Hispanic black adults are more likely to have one or more physical limitations than non-Hispanic white adults. For example, at aged 50–59, fewer than one in five non-Hispanic white adults have physical limitations, whereas almost one in four non-Hispanic black adults have physical limitations.
- Non-Hispanic black adults generally have rates of physical limitations similar to non-Hispanic white adults a decade older. For example, non-Hispanic black adults aged 50–59 have about the same rate of physical limitations (24%) as non-Hispanic white adults aged 60–69 (24%).
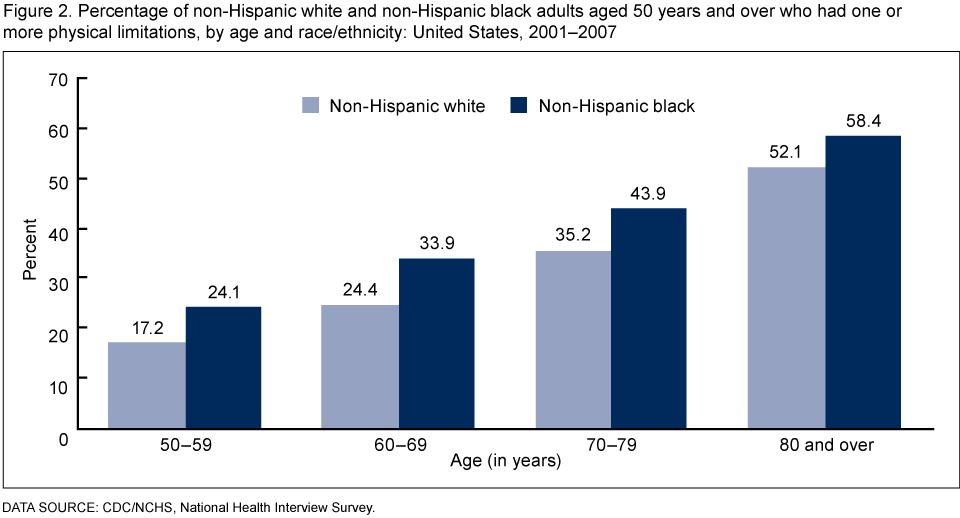 image icon
Does sex make a difference in the prevalence of physical limitations?
- For each age and race group, women are more likely than men of the same age to have one or more physical limitations. For example, 20% of non-Hispanic white men aged 60–69 have a physical limitation compared with 28% of non-Hispanic white females of the same age. Similarly, 27% of non-Hispanic black males experience physical limitations at aged 60–69 in contrast to 40% of non-Hispanic black females aged 60–69.
- Differences between men and women in the prevalence of one or more physical limitations widens with increasing age.
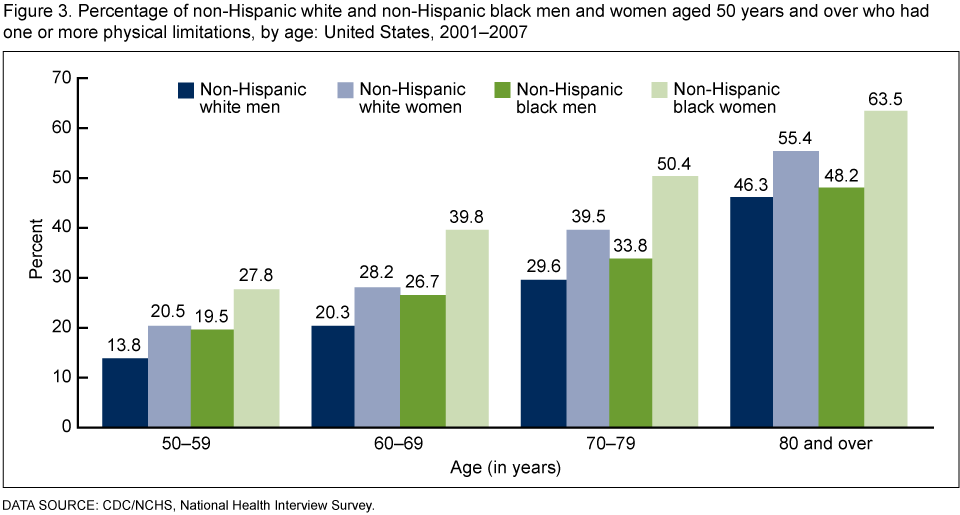 image icon
Does the prevalence of physical limitations differ by educational attainment?
- Among adults aged 50 years and over, those with less than a high school education have higher rates of physical limitations than adults in the same age group with a high school education or higher.
- The effect of education on the prevalence of physical limitations applies for each age and race group. For example, the rate of physical limitations among non-Hispanic white adults aged 60–69 with less than a high school education is about twice the rate of their counterparts with a high school diploma. Similarly, among non-Hispanic black adults aged 70–79, those without a high school diploma are 1.5 times as likely to have one or more physical limitations than non-Hispanic blacks aged 70–79 with a high school diploma.
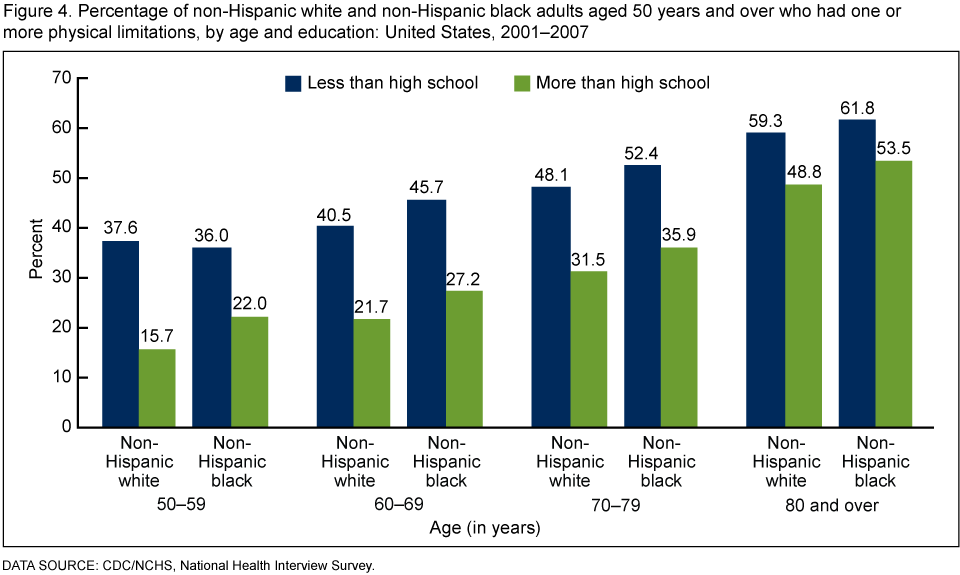 image icon
Summary
The prevalence of having one or more physical limitations as well as the prevalence of having three or more physical limitations increases with advancing age. Almost 43% of adults aged 80 and over have physical limitations, and about 27% of adults in this age group have three or more physical limitations. The prevalence of physical limitations varies by race, sex, and educational attainment. Non-Hispanic black adults aged 50 and over not only have higher rates of physical limitations than non-Hispanic white adults of the same age, but they generally experience rates of physical limitations similar to non-Hispanic white adults a decade older. In each age group, women are more likely than men to have physical limitations, and these differences increase with age. Adults with less than a high school education have higher rates of physical limitations than adults with a high school diploma or higher. The social and economic costs of earlier onset of functional decline in segments of an aging society and the subsequent need to provide supportive services at an earlier age, and perhaps for a longer period of time, imposes heavy burdens on the individual, the family, and society.
Definitions
Physical limitation: A response of “can’t do at all” or “very difficult” to any of eight separate questions asking about difficulties in doing certain activities because of a health problem. By yourself, and without using any special equipment, how difficult is it for you to . . . walk a quarter of a mile ― about 3 city blocks; walk up 10 steps without resting; stand or be on your feet for about 2 hours; sit for about 2 hours; stoop, bend, or kneel; reach up over your head; use your fingers to grasp or handle small objects; lift or carry something as heavy as 10 pounds, such as a full bag of groceries?
Data source and methods
Data from the 2001–2007 National Health Interview Survey (NHIS) were used for this analysis. NHIS collects information about the health and health care of the civilian noninstitutionalized population of the United States. Most interviews are conducted in the respondents’ households, but follow ups in order to complete interviews may be conducted over the telephone. In 2001–2007, 238,018 persons aged 50 and over from the Sample Adult component of the NHIS, were included in this analysis.
NHIS is designed to yield a nationally representative sample of the civilian noninstitutionalized U.S. population, and this analysis uses weights to produce national estimates. Data weighting procedures are described in more detail elsewhere (7). Point estimates and estimates of corresponding variances for this analysis were calculated using the SUDAAN software package (8) to account for the complex sample design of the NHIS. The Taylor series linearization method was chosen for variance estimation. All estimates shown meet the National Center for Health Statistics (NCHS) standard for having a relative standard error less than or equal to 30%. Differences between percentages were evaluated using two-sided significance tests at the 0.05 level. Terms such as “higher than” and “less than” indicate statistically significant differences. Terms such as “similar” and “no difference” indicate that the statistics being compared were not significantly different. Lack of comment regarding the difference between any two statistics does not necessarily suggest that the difference was tested and found to not be significant. NHIS is conducted continuously throughout the year by interviewers of the U.S. Census Bureau for the Centers for Disease Control and Prevention’s NCHS. For further information about NHIS visit the NHIS website.
About the authors
Julia Holmes is with the Centers for Disease Control and Prevention’s National Center for Health Statistics, Division of Vital Statistics; Eve Powell-Griner, Margaret Lethbridge-Cejku, and Kathleen Heyman are with the Centers for Disease Control and Prevention’s National Center for Health Statistics, Division of Health Interview Statistics.
References
- Kaplan, GA. Maintenance of functioning in the elderly. AEP Vol 2(6): 823–34. 1992.
- Manton KG, Gu X, Lowrimore GR. Cohort changes in active life expectancy in the U.S. elderly population: experience from the 1982–2004 National Long-Term Care Survey. J Gerontol B Psychol Sci Soc Sci Vol 63(5):S269–81. 2008.
- Kramarow E, Lubitz J, Lentzner H, Gorina Y. Trends in the health of older Americans, 1970–2005. Health Aff Vol 26(5): 1417–25. 2007.
- Fries, JF. Measuring and monitoring success in compressing morbidity. Ann Intern Med Vol 139(5): 455-9. 2003.
- Cai L, Lubitz J. Was there compression of disability for older Americans from 1992 to 2003? Demography Vol 44(3): 479–95. 2007.
- House JS, Lantz PM, Herd P. Continuity and change in the social stratification of aging and health over the life course: evidence from a nationally representative longitudinal study from 1986 to 2001/2002 (America’s changing lives study). J Gerontol B Vol 60B (Special Issue II): 15–26. 2005.
- Botman SL, Moore TF, Moriarity CL, Parsons VL. Design and estimation for the National Health Interview Survey, 1995–2004. National Center for Health Statistics. Vital Health Stat 2(130). 2000.
- Research Triangle Institute. SUDAAN (Release 9.1). Research Triangle Park, NC: Research Triangle Institute. 2004.
Suggested Citation
Holmes J, Powell-Griner E, Lethbridge-Cejku M, Heyman K. Aging differently: Physical limitations among adults aged 50 years and over: United States, 2001–2007. NCHS data brief, no 20. Hyattsville, MD: National Center for Health Statistics. 2009.
Copyright information
All material appearing in this report is in the public domain and may be reproduced or copied without permission; citation as to source, however, is appreciated.
National Center for Health Statistics
Director
Edward J. Sondik, Ph.D.
Acting Co-Deputy Directors
Jennifer H. Madans, Ph.D
Michael H. Sadagursky