Trends in Elevated Triglyceride in Adults: United States, 2001–2012
- Key findings
- What percentage of adults had elevated triglyceride during 2009–2012, and were differences noted by age and sex?
- Did the percentage of adults with elevated triglyceride change between 2001–2004 and 2009–2012?
- Did the trend in the percentage of adults with elevated triglyceride differ by sex and age between 2001–2004 and 2009–2012?
- Did the trend in the percentage of adults with elevated triglyceride differ by sex and race and Hispanic origin between 2001–2004 and 2009–2012?
- Did the trend in the percentage with elevated triglyceride differ by sex and weight status between 2001–2004 and 2009–2012?
- Summary
- Definitions
- Data sources and methods
- About the authors
- References
- Suggested citation
NCHS Data Brief No. 198, May 2015
PDF Versionpdf icon (492 KB)
Margaret D. Carroll, M.S.P.H.; Brian K. Kit, M.D., M.P.H.; and David A. Lacher, M.D., M.Ed.
Key findings
Data from the National Health and Nutrition Examination Survey, 2001–2012
- The percentage of adults aged 20 and over with elevated triglyceride (150 mg/dL or more) declined from 33.3% during 2001–2004 to 25.1% during 2009–2012.
- Percentages with elevated triglyceride decreased for both men and women—among men, from 37.3% for 2001–2004 to 28.7% for 2009–2012, and among women, from 29.3% for 2001–2004 to 21.5% for 2009–2012.
- For adults aged 60 and over, declines in elevated triglyceride levels were seen in both men (from 39.9% during 2001–2004 to 24.8% during 2009–2012) and women (from 43.5% during 2001–2004 to 30.9% during 2009–2012).
- Declines in elevated triglyceride levels were observed in overweight and obese men and women between 2001–2004 and 2009–2012.
Elevated triglyceride is associated with cardiovascular disease (1). For adults aged 20 and over with elevated triglyceride, recommendations for therapeutic lifestyle changes include increased physical activity (2,3), weight loss (2,3), optimal nutrition-related practices (3), and smoking cessation (2). In this report, trends in the percentage of U.S. adults aged 20 and over with elevated triglyceride (150 mg/dL or more) (2,3) are examined using data from National Health and Nutrition Examination Surveys (NHANES) 2001–2004, 2005–2008, and 2009–2012.
Keywords: cardiovascular disease, obesity, NHANES
What percentage of adults had elevated triglyceride during 2009–2012, and were differences noted by age and sex?
Approximately one-quarter of adults aged 20 and over had elevated triglyceride levels during 2009–2012 (Figure 1). A greater percentage of men (28.7%) than women (21.5%) had elevated triglyceride levels.
Figure 1. Age-adjusted and age-specific percentages of adults aged 20 and over with elevated triglyceride, by sex and age: United States, 2009–2012
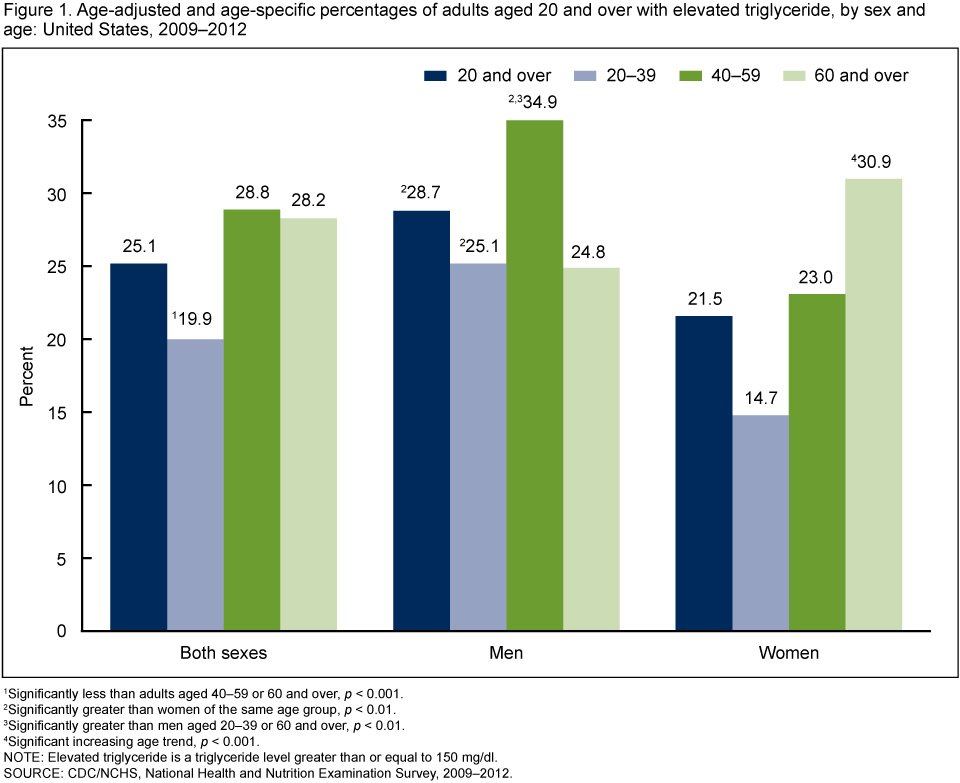
1Significantly less than adults aged 40–59 or 60 and over, p < 0.001.
2Significantly greater than women of the same age group, p < 0.01.
3Significantly greater than men aged 20–39 or 60 and over, p < 0.01.
4Significant increasing age trend, p < 0.001.
NOTE: Elevated triglyceride is a triglyceride level greater than or equal to 150 mg/dl.
SOURCE: CDC/NCHS, National Health and Nutrition Examination Survey, 2009–2012.
This sex difference was seen in adults aged 20–39 (25.1% men, 14.7% women) and 40–59 (34.9% men, 23.0% women). However, for adults aged 60 and over, no significant difference by sex was observed in the percentage with elevated triglyceride. A greater percentage of men aged 40–59 (34.9%) than men aged 20–39 (25.1%) or 60 and over (24.8%) had elevated triglyceride. For women, an increasing trend in elevated triglyceride occurred with age (14.7% for age group 20–39, 23.0% for 40–59, and 30.9% for 60 and over).
Did the percentage of adults with elevated triglyceride change between 2001–2004 and 2009–2012?
A decreasing trend was observed in the percentage of adults with elevated triglyceride, from 33.3% during 2001–2004 to 25.1% during 2009–2012 (Figure 2). Declines in elevated triglyceride were observed both in men, from 37.3% during 2001–2004 to 28.7% during 2009–2012, and in women, from 29.3% during 2001–2004 to 21.5% during 2009–2012.
Figure 2. Age-adjusted percentage of adults aged 20 and over with elevated triglyceride, by sex: United States, 2001–2012

1Significant decreasing trend, p < 0.001.
NOTE: Elevated triglyceride is a triglyceride level greater than or equal to 150 mg/dL.
SOURCE: CDC/NCHS, National Health and Nutrition Examination Survey, 2001–2012.
Did the trend in the percentage of adults with elevated triglyceride differ by sex and age between 2001–2004 and 2009–2012?
Among adults aged 60 and over from 2001–2004 to 2009–2012, the percentage with elevated triglyceride declined from 39.9% to 24.8% for men, and from 43.5% to 30.9% for women (Figure 3). For adults aged 40–59, a decreasing trend was seen in men (from 44.4% during 2001–2004 to 34.9% during 2009–2012) and in women (from 28.7% during 2001–2004 to 23.0% during 2009–2012). For younger adults, aged 20–39, the percentage of men with elevated triglyceride did not change significantly. However, the percentage of women in the youngest age group with elevated triglyceride declined from 21.6% during 2001–2004 to 14.7% during 2009–2012.
Figure 3. Percentage of adults aged 20 and over with elevated triglyceride, by sex and age: United States, 2001–2012
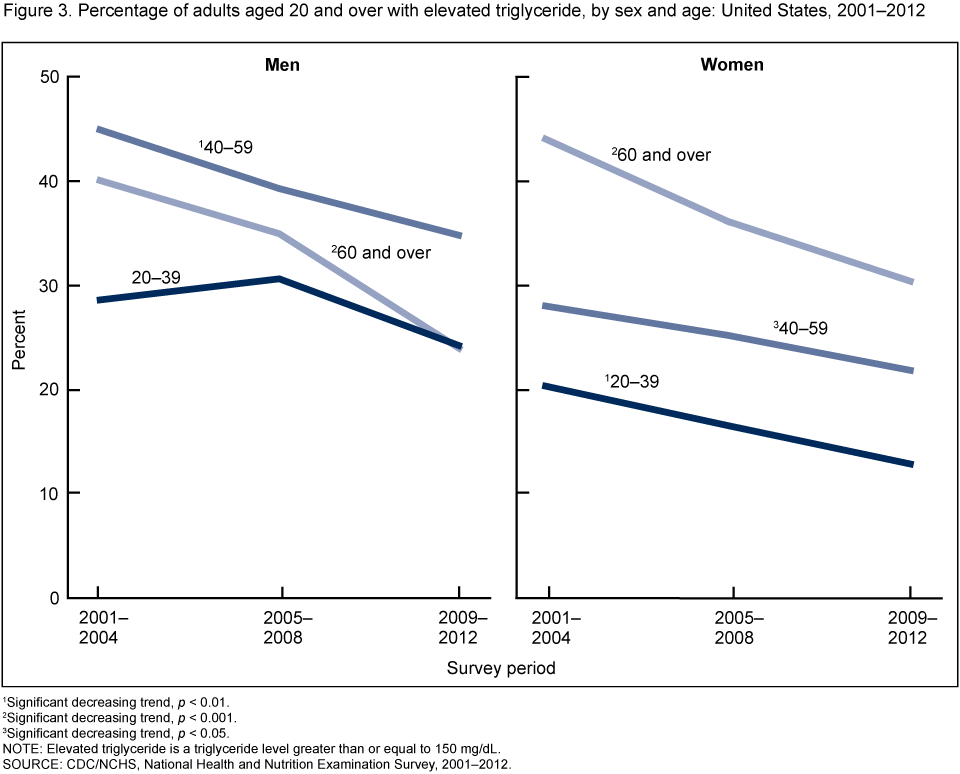
1Significant decreasing trend, p < 0.01.
2Significant decreasing trend, p < 0.001.
3Significant decreasing trend, p < 0.05.
NOTE: Elevated triglyceride is a triglyceride level greater than or equal to 150 mg/dL.
SOURCE: CDC/NCHS, National Health and Nutrition Examination Survey, 2001–2012.
Did the trend in the percentage of adults with elevated triglyceride differ by sex and race and Hispanic origin between 2001–2004 and 2009–2012?
Decreasing trends in the percentage with elevated triglyceride were seen in Mexican-American women (from 39.6% for 2001–2004 to 27.8% for 2009–2012), but not in Mexican-American men (Figure 4). For non-Hispanic white adults, declining trends in the percentage with elevated triglyceride were observed from 2001–2004 to 2009–2012 both in men (from 39.1% to 27.8%) and in women (from 29.6% to 22.7%). No change was observed in the percentage of non-Hispanic black men or women with elevated triglyceride. During the entire study period, the percentage of adults with elevated triglyceride was consistently lower in non-Hispanic black adults than in non-Hispanic white or Mexican-American adults. No consistent difference was found in the percentage with elevated triglyceride between non-Hispanic white and Mexican-American adults across the survey periods.
Figure 4. Age-adjusted percentage of adults aged 20 and over with elevated triglyceride, by sex and race and ethnicity: United States, 2001–2012
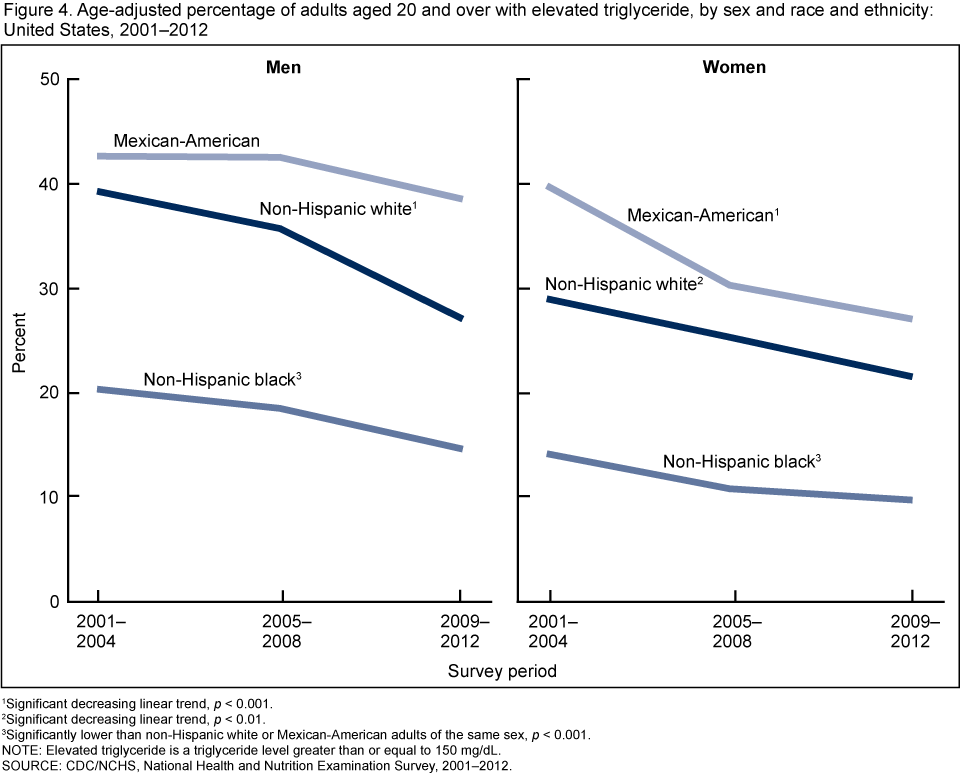
1Significant decreasing linear trend, p < 0.001.
2Significant decreasing linear trend, p < 0.01.
3Significantly lower than non-Hispanic white or Mexican-American adults of the same sex, p < 0.001.
NOTE: Elevated triglyceride is a triglyceride level greater than or equal to 150 mg/dL.
SOURCE: CDC/NCHS, National Health and Nutrition Examination Survey, 2001–2012.
Did the trend in the percentage with elevated triglyceride differ by sex and weight status between 2001–2004 and 2009–2012?
Decreasing trends were noted in the percentage of obese men with elevated triglyceride, from 48.0% for 2001–2004 to 38.7% for 2009–2012 (Figure 5). Decreasing trends in elevated triglyceride were also seen in overweight men (from 40.7% for 2001–2004 to 27.5% for 2009–2012). However, the percentage of normal weight men with elevated triglyceride did not change during the study period.
Decreasing trends were observed in the percentage of obese women with elevated triglyceride during 2001–2012 (from 39.9% for 2001–2004 to 31.9% for 2009–2012), as well as overweight women (from 34.0% for 2001–2004 to 22.9% for 2009–2012). The percentage of normal weight women with elevated triglyceride also decreased linearly over the same time period (from 18.0% to 9.3%).
Figure 5. Age-adjusted percentage of adults aged 20 and over with elevated triglyceride, by sex and classification of body mass index: United States, 2001–2012
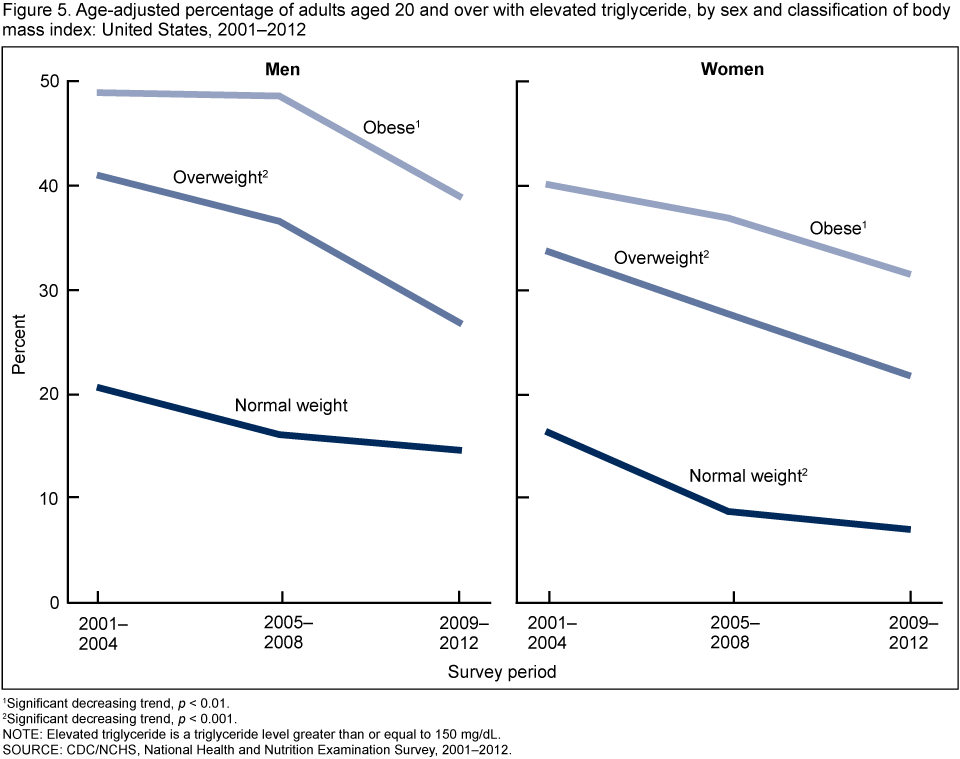
1Significant decreasing trend, p < 0.01.
2Significant decreasing trend, p < 0.001.
NOTE: Elevated triglyceride is a triglyceride level greater than or equal to 150 mg/dL.
SOURCE: CDC/NCHS, National Health and Nutrition Examination Survey, 2001–2012.
Summary
The percentage of adults aged 20 and over with elevated triglyceride (150 mg/dL or more) declined between 2001–2004 and 2009–2012. During 2009–2012, about one-quarter of the U.S. adult population aged 20 and over had elevated triglyceride.
Declining trends in the percentage of adults with elevated triglyceride since 2001–2004 occurred for men and for women overall; for adults in age groups 40–59 and 60 and over; among non-Hispanic white men and non-Hispanic white women; and among overweight men and women and obese men and women.
The lower percentage of elevated triglyceride for non-Hispanic black adults, compared with Mexican-American or non-Hispanic white adults, has been documented (2). One possible explanation is that levels of lipoprotein lipase (the enzyme responsible for clearing triglyceride-containing lipoproteins from the circulation) are higher in black persons than in white persons (4).
Factors affecting triglyceride levels include a sedentary lifestyle (2,3), increased body weight (2,3), and cigarette smoking (2). Furthermore, simple carbohydrates (including added sugars and fructose), trans-fatty acids, and alcohol increase triglyceride, whereas monounsaturated and polyunsaturated fatty acids and marine-based omega-3 products may reduce triglyceride (3). Decreases in the percentage of adults who smoke cigarettes (5), the decline in plasma concentrations of trans-fatty acids (6), and the increased percentage of adults taking cholesterol-lowering medications (7) could have contributed to the declining trends in elevated triglyceride. Limited results from clinical trials have demonstrated a 10%–30% reduction in triglyceride with statin monotherapy in patients with elevated triglyceride at baseline (3). However, further clinical outcome trials are necessary to definitively demonstrate the benefits of statins on reducing triglyceride levels.
Definitions
Elevated triglyceride: A triglyceride level of 150 mg/dL or more.
Weight status
Body mass index (BMI): Weight in kilograms divided by height in meters squared
(kg/m2), rounded to the nearest tenth.
Normal weight: BMI of at least 18.5 kg/m2 but less than 25 kg/m2.
Overweight: BMI of at least 25 kg/m2 but less than 30 kg/m2.
Obesity: BMI greater than or equal to 30 kg/m2.
Data sources and methods
Results presented in this report are based on data from three NHANES survey periods: 2001–2004 (8), 2005–2008 (8,9), and 2011–2012 (9). These cross-sectional surveys are designed to monitor the health and nutritional status of the U.S. civilian noninstitutionalized population (8,9). Each survey consists of interviews conducted in participants’ homes and standardized physical examinations in a mobile examination center (MEC), including laboratory tests. One-half of MEC examination participants aged 12 and over were randomly assigned to the morning session and instructed to fast for at least 8 hours prior to venipuncture. The percentage with elevated triglyceride is based on adults (aged 20 and over) examined in the morning and fasting for at least 8.5 hours but no more than 23 hours prior to venipuncture. Adults with data on triglyceride totaled 4,115 for NHANES 2001–2004, 4,306 for NHANES 2005–2008, and 4,881 for NHANES 2009–2012.
The NHANES sample is selected through a complex multistage probability design (8,9). Data collection is based on a representative sample covering all ages of the civilian noninstitutionalized population. Sample weights, accounting for differential selection probabilities, nonresponse, and noncoverage, are incorporated in the estimation process. In estimating the percentage of adults with elevated triglyceride, morning fasting sample weights were used. All variance estimates accounted for the complex survey design using Taylor series linearization (10). Percentage estimates for the total adult population were age-adjusted by the direct method to the U.S. Census 2000 population using age groups 20–39, 40–59, and 60 and over (11). Differences between groups were tested using a Student’s t statistic with the appropriate degrees of freedom at the p < 0.05 significance level (where p is the probability of rejecting the null hypothesis when it is true). Linear survey trends were tested using orthogonal contrast matrices. All differences reported are statistically significant unless otherwise indicated. Statistical analyses were conducted using SAS System for Windows release 9.3 (SAS Institute Inc., Cary, N.C.) and SUDAAN release 11.0 (RTI International, Research Triangle Park, N.C.).
About the authors
Margaret D. Carroll, Brian K. Kit, and David A. Lacher are with CDC’s National Center for Health Statistics, Division of Health and Nutrition Examination Surveys.
References
- Austin MA, Hokanson JE, Edwards KL. Hypertriglyceridemia as a cardiovascular risk factor. Am J Cardiol 81(4A):7B–12B. 1998.
- National Institutes of Health, National Heart, Lung and Blood Institute. Third report of the National Cholesterol Education Program (NCEP) Expert Panel on Detection, Evaluation, and Treatment of High Blood Cholesterol in Adults (Adult treatment panel III): Final report. NIH publication no. 02–5215. 2002.
- Miller M, Stone NJ, Ballantyne C, Bittner V, Criqui MH, Ginsberg HN, et al. Triglycerides and cardiovascular disease: A scientific statement from the American Heart Association. Circulation 123(20):2292–333. 2011.
- Summer AE, Finley KB, Genovese DJ, Criqui MH, Boston RC. Fasting triglyceride and the triglyceride-HDL cholesterol ratio are not markers of insulin resistance in African Americans. Arch Intern Med 165(12):1395–400. 2005.
- Ward BW, Schiller JS, Freeman G. Early release of selected estimates based on data from the January–September 2013 National Health Interview Survey pdf icon[PDF – 1.02MB]. National Center for Health Statistics. March 2014.
- Vesper HW, Kuiper HC, Mirel LB, Johnson CL, Pirkle JL. Levels of plasma trans-fatty acids in non-Hispanic white adults in the United States in 2000 and 2009. JAMA 307(6):562–3. 2012.
- Gu Q, Paulose-Ram R, Burt VL, Kit BK. Prescription cholesterol-lowering medication use in adults aged 40 and over: United States, 2003–2012. NCHS data brief, no 177. Hyattsville, MD: National Center for Health Statistics. 2014.
- Curtin LR, Mohadjer LK, Dohrmann SM, et al. The National Health and Nutrition Examination Survey: Sample design, 1999–2006. National Center for Health Statistics. Vital Health Stat 2(155). 2012.
- Curtin LR, Mohadjer LK, Dohrmann SM, et al. National Health and Nutrition Examination Survey: Sample design, 2007–2010. National Center for Health Statistics. Vital Health Stat 2(160). 2013.
- Wolter KM. Taylor series methods. In: Introduction to variance estimation. 2nd ed. New York, NY: Springer Science+Business Media, LLC. 2007.
- Klein RJ, Schoenborn CA. Age adjustment using the 2000 projected U.S. population. Healthy People 2010 Statistical Notes, no. 20. Hyattsville, MD: National Center for Health Statistics. January 2001.
Suggested citation
Carroll MD, Kit BK, Lacher DA. Trends in elevated triglyceride in adults: United States, 2001–2012. NCHS data brief, no 198. Hyattsville, MD: National Center for Health Statistics. 2015.
Copyright information
All material appearing in this report is in the public domain and may be reproduced or copied without permission; citation as to source, however, is appreciated.
National Center for Health Statistics
Charles J. Rothwell, M.S., M.B.A., Director
Nathaniel Schenker, Ph.D., Deputy Director
Jennifer H. Madans, Ph.D., Associate Director for Science
Division of Health and Nutrition Examination Surveys
Kathryn S. Porter, M.D., M.S., Director