Emergency Department Visits and Proximity to Patients’ Residences, 2009–2010
- Key findings
- How far from patients’ residences do ED visits usually occur, and does this differ if visits occur within a metropolitan statistical area?
- What percentage of visits occurred at the closest ED, and are there differences by patient age?
- Does hospital visit volume affect whether visits take place at the closest ED?
- Are wait times associated with whether visits take place at the closest ED?
- Summary
- Definitions
- Data source and methods
- About the authors
- References
- Suggested citation
NCHS Data Brief No. 192, March 2015
PDF Versionpdf icon (320 KB)
Amy M. Brown, M.P.H.; Sandra L. Decker, Ph.D.; and Frederic W. Selck, Ph.D.
Key findings
Data from the National Hospital Ambulatory Medical Care Survey
- In 2009–2010, visits to emergency departments (EDs) occurred an average 6.8 miles from the patient’s residence, while the nearest ED was 3.9 miles from the home.
- Less than one-half of all ED visits (43.8%) occurred at the ED closest to where the patient lived.
- Visits within metropolitan statistical areas were less likely (37.2%) to take place at the closest ED compared with visits outside of metropolitan statistical areas (70.1%).
- Within metropolitan statistical areas, visits that did not take place at the closest ED occurred more frequently among younger patients, at larger hospitals, and in EDs with longer waiting times, compared with visits to the closest ED.
The number of emergency department (ED) visits rose 44% from 1991 through 2010, even as the number of hospital EDs declined 10% over the same period (1). As a result, EDs have increasingly experienced overcrowding and longer waiting times (2,3). However, little is known about which ED patients visit, how often patients go to the ED closest to their home, and how differences in geography, patient demographics, and hospital characteristics are associated with ED selection patterns.
Keywords: distance, National Hospital Ambulatory Medical Care Survey
How far from patients’ residences do ED visits usually occur, and does this differ if visits occur within a metropolitan statistical area?
- Visits to EDs occurred an average 6.8 miles from the patient’s residence, while the nearest ED was 3.9 miles from the home (Figure 1).
Figure 1. Average distance from home among emergency department visits to closest and visited emergency departments, by metropolitan statistical area status: United States, 2009–2010
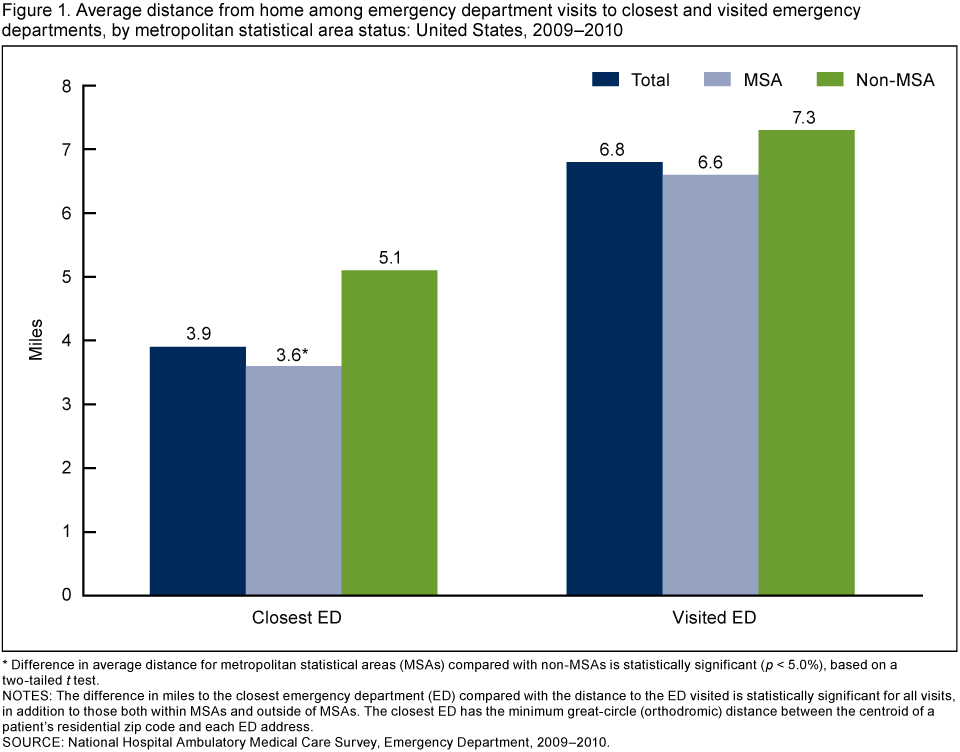
* Difference in average distance for metropolitan statistical areas (MSAs) compared with non-MSAs is statistically significant (p < 5.0%), based on a two-tailed t test.
NOTES: The difference in miles to the closest emergency department (ED) compared with the distance to the ED visited is statistically significant for all visits, in addition to those both within MSAs and outside of MSAs. The closest ED has the minimum great-circle (orthodromic) distance between the centroid of a patient’s residential zip code and each ED address.
SOURCE: National Hospital Ambulatory Medical Care Survey, Emergency Department, 2009–2010.
- Among those who visited an ED, the nearest ED was significantly closer to home (3.6 miles) for visits within metropolitan statistical areas (MSAs) compared with those outside of MSAs (5.1 miles).
- However, the distance to the ED visited was not significantly different based on whether a patient visited an ED within or outside of an MSA (about 7 miles in either case).
What percentage of visits occurred at the closest ED, and are there differences by patient age?
- In 2009–2010, 43.8% of all ED visits occurred at the ED closest to a patient’s home (Figure 2).
- Visits to EDs within MSAs were less likely to take place at the closest ED (37.2%) compared with visits in non-MSAs (70.7%). This difference was also significant for each age group.
- Within MSAs, visits by patients aged 18 and under (35.3%) and 19–64 (37.5%) were less likely to take place at the closest ED compared with visits among patients aged 65 and over (40.1%).
- Outside of MSAs, no significant difference was found in the percentage of visits that took place at the closest ED by patient age group.
Figure 2. Percentage of visits to closest emergency department, by metropolitan statistical area status and age group: United States, 2009–2010
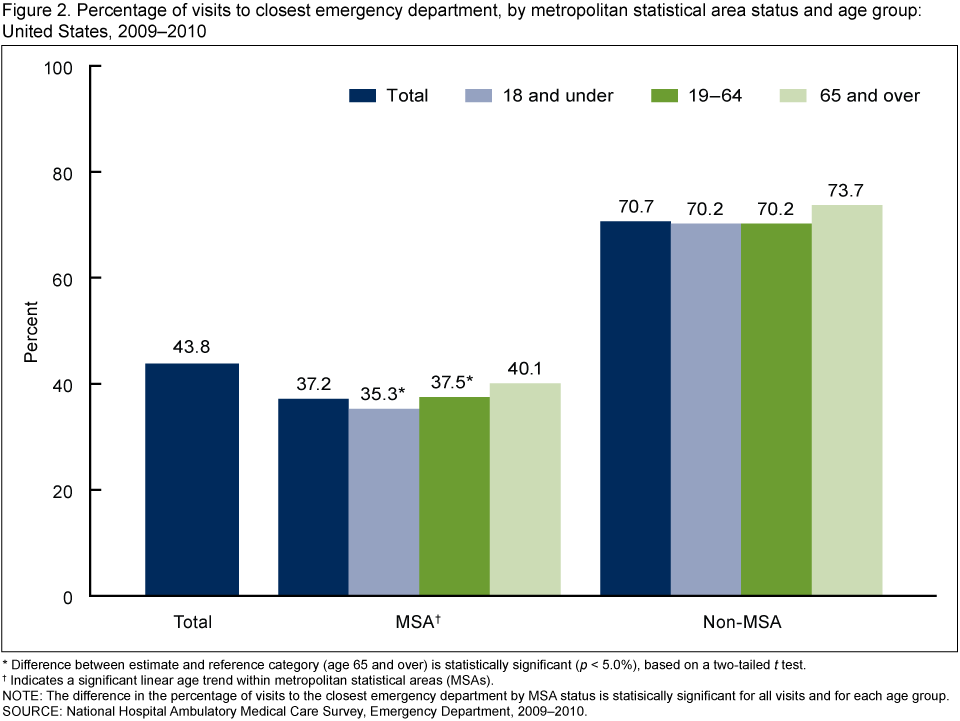
* Difference between estimate and reference category (age 65 and over) is statistically significant (p < 5.0%), based on a two-tailed t test.
† Indicates a significant linear age trend within metropolitan statistical areas (MSAs).
NOTE: The difference in the percentage of visits to the closest emergency department by MSA status is statisically significant for all visits and for each age group.
SOURCE: National Hospital Ambulatory Medical Care Survey, Emergency Department, 2009–2010.
Does hospital visit volume affect whether visits take place at the closest ED?
- Within MSAs, a lower percentage of visits occurred at the closest ED if the ED was within a hospital having more than 20,000 visits per year (35.6%) compared with visits within hospitals having an annual volume of 20,000 or fewer visits (60.3%) (Figure 3).
- The percentage of visits to the closest ED did not differ significantly by hospital visit volume outside of MSAs.
Figure 3. Percentage of visits to closest emergency department, by metropolitan statistical area status and hospital visit volume: United States, 2009–2010
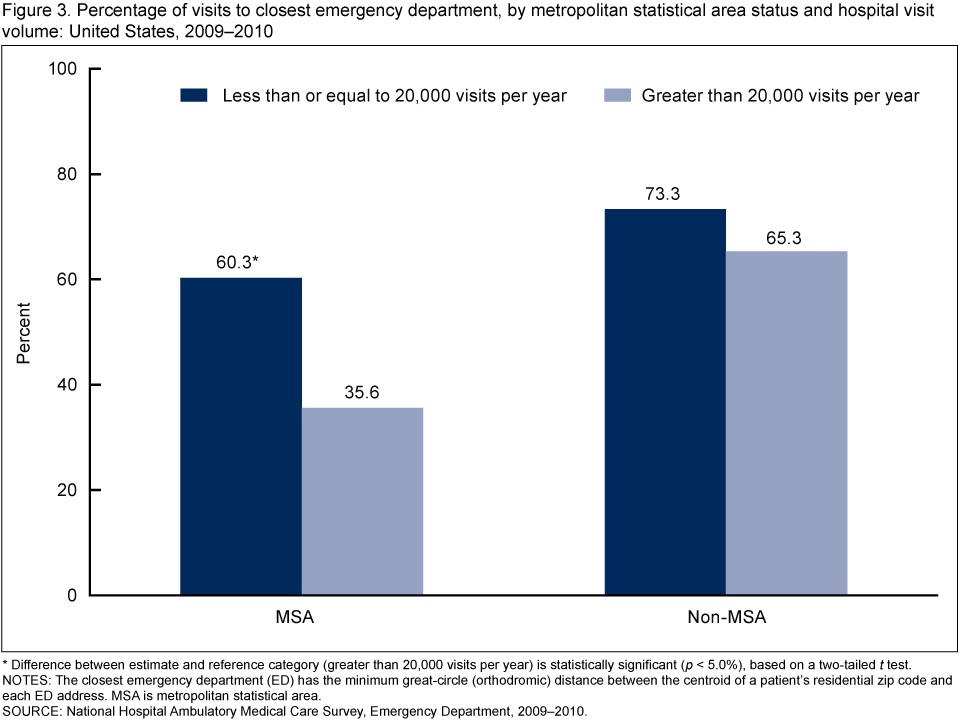
* Difference between estimate and reference category (greater than 20,000 visits per year) is statistically significant (p < 5.0%), based on a two-tailed t test.
NOTES: The closest emergency department (ED) has the minimum great-circle (orthodromic) distance between the centroid of a patient’s residential zip code and each ED address. MSA is metropolitan statistical area.
SOURCE: National Hospital Ambulatory Medical Care Survey, Emergency Department, 2009–2010.
Are wait times associated with whether visits take place at the closest ED?
- Within MSAs, visits to the ED closest to a patient’s home had shorter average wait times for being seen by a physician, physician’s assistant, or nurse practitioner (52.3 minutes) compared with visits to EDs that were farther away (average wait time of 62.3 minutes) (Figure 4).
- Outside of MSAs, average wait time did not differ between visits to the closest ED and the ED visited.
Figure 4. Average waiting time among visits to closest emergency department and those more distant, by metropolitan statistical area status: United States, 2009–2010
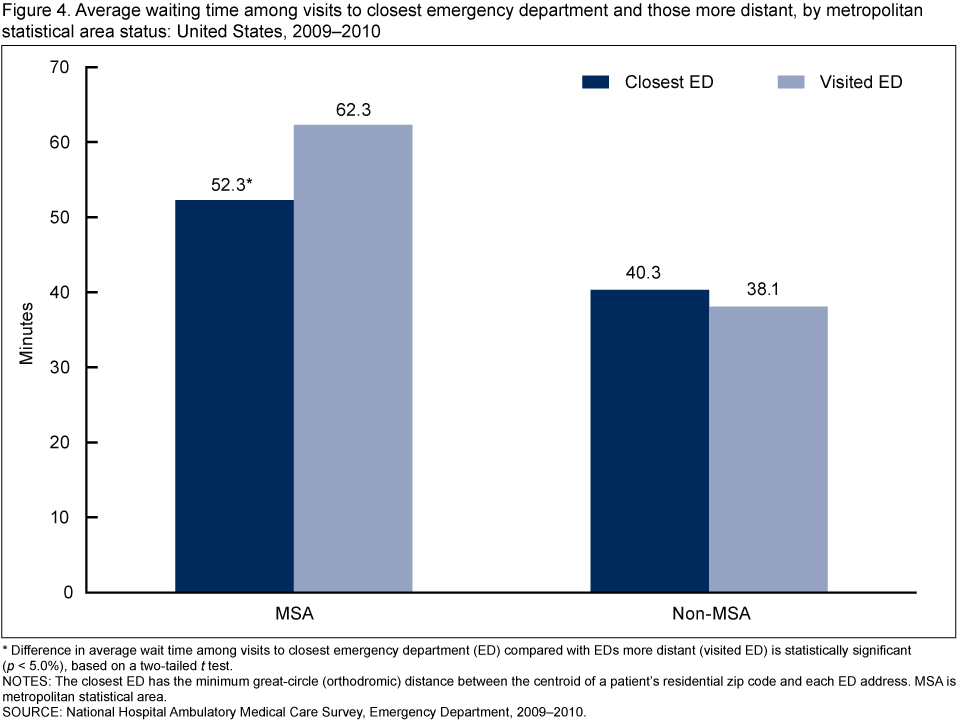
* Difference in average wait time among visits to closest emergency department (ED) compared with EDs more distant (visited ED) is statistically significant (p < 5.0%), based on a two-tailed t test.
NOTES: The closest ED has the minimum great-circle (orthodromic) distance between the centroid of a patient’s residential zip code and each ED address. MSA is metropolitan statistical area.
SOURCE: National Hospital Ambulatory Medical Care Survey, Emergency Department, 2009–2010.
Summary
If the demand for emergency care continues to grow, understanding the circumstances in which patients visit an ED other than the one closest to their home may become increasingly important. This report uses geographic information about the location of EDs throughout the United States in conjunction with information about the location of patient residences to assess a) whether visits take place at the ED closest to where patients live and b) which factors are associated with where these visits occurred.
Results suggest that ED visit patterns vary considerably by MSA status. Outside of MSAs, the majority of visits take place at the ED closest to a patient’s home, while within MSAs, several factors are associated with patients bypassing the closest ED and visiting an ED farther away. In 2009–2010, visits to an ED farther than the closest one were more likely to occur among patients younger than age 65 and at hospitals with a higher visit volume. Visits within MSAs were more likely than visits outside of MSAs to occur at an ED farther than the closest one, despite the fact that EDs closest to a patient’s home had lower average wait times for seeing a clinician.
Definitions
Closest emergency department (ED): Among all EDs in the United States, the ED that has the minimum great-circle (orthodromic) distance between the centroid of a patient’s zip code of residence and the ED’s address. Zip codes for patient residences were obtained from the 2009–2010 National Hospital Ambulatory Medical Care Survey (NHAMCS), and addresses for each ED in the United States were obtained from IMS Health (4). Geocoding of ED addresses was performed using Pitney Bowes Group 1 Geographic Coding Plus version 5.2 (Stamford, Conn.).
Metropolitan statistical area (MSA): A metropolitan area containing a core urban area of 50,000 or more population (5).
Data source and methods
Data from the 2009–2010 NHAMCS were used. This survey is conducted annually by the Centers for Disease Control and Prevention’s National Center for Health Statistics. NHAMCS collects data on a nationally representative sample of visits to hospital outpatient departments and EDs of nonfederal, short-stay general hospitals and children’s general hospitals, and uses a multistage probability sample design that is described elsewhere (6). The analyses in this report use data on 50,951 (unweighted) ED visits from NHAMCS 2009–2010 after excluding 16,281 visits. Most of the excluded visits (14,046) listed an ambulance as the mode of arrival, and were excluded because the patient likely had little or no choice of ED visited. Another 2,235 visits lacking valid zip codes of patient residences were excluded. In calculating average distances, an additional 4.6% (unweighted) of visits were excluded that had outlier distances to the ED visited equal to or greater than 50 miles. These visits were excluded because they were outside of the reasonable distance range and likely occurred while the patient was traveling far from home.
Estimates were considered statistically significant (p < 0.05) based on two-tailed t tests. All reported comparisons are statistically significant unless otherwise indicated. For (Figure 2), a weighted least-squares regression method (7) was used to test for a linear trend in the percentage of visits that occurred at the closest ED by age group. Data analyses were performed using the statistical packages SAS version 9.3 (SAS Institute, Cary, N.C.), SUDAAN version 11.0 (RTI International, Research Triangle Park, N.C.), and Stata version 11.0 (College Station, Texas).
Note that although straight-line distances between patients’ zip codes of residence and ED addresses were calculated, distances that accounted for available roadways and travel time would have been preferred. Distance also is calculated from the centroid of a patient’s zip code of residence because exact patient addresses were not available. Separate analyses were also conducted defining the closest ED as any ED within a 1–mile radius of the shortest distance between the centroid of the patient’s zip code and the address of every other ED in the country. This increased the percentage of ED visits occurring at the closest ED (to 56.7%), although all comparisons in this report remained similar. For example, the percentage of visits to the closest ED remained larger for visits outside of MSAs compared with inside MSAs. Lastly, although this report measured distance from home to an ED, the analyses did not take into account where patients were actually coming from at the time of the ED visit, because this information was not collected. In some instances, the patient may have been away from home (e.g., at work or school, or on vacation) prior to traveling to the ED.
About the authors
Amy M. Brown is with CDC’s National Center for Health Statistics, Division of Health Care Statistics. Sandra L. Decker is with CDC’s National Center for Health Statistics, Office of Analysis & Epidemiology. Frederic W. Selck is with Bates White, an economic consulting firm in Washington, D.C.
References
- American Hospital Association. Trendwatch Chartbook 2012: Trends affecting hospitals and health systems: Chart 3.7.external icon
- Henneman PL, Garb JL, Capraro GA, Li H, Smithline HA, Wait RB. Geography and travel distance impact emergency department visits. J Emerg Med 40(3):333–9. 2011.
- Sommers A, Boukus ER, Carrier E. Dispelling myths about emergency department use: Majority of Medicaid visits are for urgent or more serious symptomsexternal icon. Center for Studying Health System Change research brief, no 23. 2012.
- National Center for Health Statistics. 2010 NHAMCS micro-data file documentation pdf icon[PDF – 1.52MB]. Hyattsville, MD. 2010.
- U.S. Census Bureau. Metropolitan and micropolitan statistical areasexternal icon.
- National Center for Health Statistics. National Hospital Ambulatory Medical Care Survey documentation, 2009–2010.
-
Gillum BS, Graves EJ, Kozak LJ. Trends in hospital utilization: United States, 1988–92. National Center for Health Statistics.
Vital Health Stat 13(124). 1996.
Suggested citation
Brown AM, Decker SL, Selck FW. Emergency department visits and proximity to patients’ residences, 2009–2010. NCHS data brief, no 192. Hyattsville, MD: National Center for Health Statistics. 2015.
Copyright information
All material appearing in this report is in the public domain and may be reproduced or copied without permission; citation as to source, however, is appreciated.
National Center for Health Statistics
Charles J. Rothwell, M.S., M.B.A., Director
Nathaniel Schenker, Ph.D., Deputy Director
Jennifer H. Madans, Ph.D., Associate Director for Science
Division of Health Care Statistics
Clarice Brown, M.S., Director
Office of Analysis and Epidemiology
Irma E. Arispe, Ph. D., Director