Emergency Department Visits for Motor Vehicle Traffic Injuries: United States, 2010–2011
- Key findings
- Did ED visit rates for motor vehicle traffic injuries differ by age?
- Did ED visit rates for motor vehicle traffic injuries differ by race and ethnicity?
- Did arrival by ambulance, triage status, and hospital admission differ for motor vehicle traffic injury ED visits compared with other injury-related ED visits?
- Did the percentage of imaging tests ordered or provided at ED visits for motor vehicle traffic injuries differ from other injury-related ED visits?
- What were the leading primary diagnoses associated with ED visits for motor vehicle traffic injuries? Did these differ from other injury-related ED visits?
- Summary
- Definitions
- Data source and methods
- About the authors
- References
- Suggested citation
NCHS Data Brief No. 185, January 2015
Michael Albert, M.D., M.P.H.; and Linda F. McCaig, M.P.H.
Key findings
Data from the National Hospital Ambulatory Medical Care Survey, 2010–2011
- In 2010–2011, the emergency department (ED) visit rate for motor vehicle traffic injuries was highest among persons aged 16–24 years. The rates declined with age after 16–24, with rates for those aged 0–15 similar to those 65 and over.
- The overall ED visit rate for motor vehicle traffic injuries was higher among non-Hispanic black persons compared with non-Hispanic white and Hispanic persons.
- Imaging services were ordered or provided at 70.2% of ED visits for motor vehicle traffic injuries, which was higher than for other injury-related ED visits (55.9%).
- About one-half of ED visits for motor vehicle traffic injuries had a primary diagnosis of sprains and strains of the neck and back, contusion with intact skin surface, or spinal disorders.
In spite of improvements in motor vehicle safety in recent years, motor vehicle crashes remain a major source of morbidity and mortality in the United States (1–3). Motor vehicle-related deaths and injuries also result in substantial economic and societal costs related to medical care and lost productivity (4). This report describes the rates and characteristics of emergency department (ED) visits for motor vehicle traffic injuries during 2010–2011 based on nationally representative data from the National Hospital Ambulatory Medical Care Survey (NHAMCS).
Keywords: health care utilization, injury, National Hospital Ambulatory Medical Care Survey
Did ED visit rates for motor vehicle traffic injuries differ by age?
- In 2010–2011, there were an estimated 3.9 million annual average ED visits for motor vehicle traffic injuries. The overall ED visit rate for motor vehicle traffic injuries was 129 per 10,000 persons (Figure 1).
- The ED visit rate for motor vehicle traffic injuries was highest among persons aged 16–24 years. The rate increased from 70 per 10,000 persons among those aged 0–15 to peak at 286 per 10,000 persons for those aged 16–24. The rate then declined with increasing age, reaching a rate of 65 per 10,000 persons for those aged 65 and over.
Figure 1. Emergency department visit rates for motor vehicle traffic injuries, by age: United States, 2010–2011
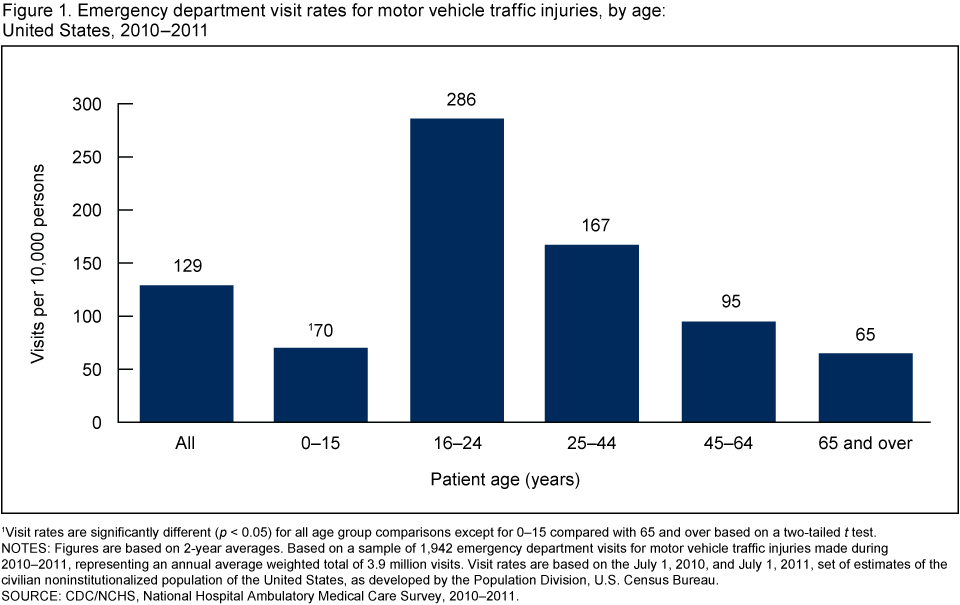
1Visit rates are significantly different (p < 0.05) for all age group comparisons except for 0–15 compared with 65 and over based on a two-tailed t test.
NOTES: Figures are based on 2-year averages. Based on a sample of 1,942 emergency department visits for motor vehicle traffic injuries made during 2010–2011, representing an annual average weighted total of 3.9 million visits. Visit rates are based on the July 1, 2010, and July 1, 2011, set of estimates of the civilian noninstitutionalized population of the United States, as developed by the Population Division, U.S. Census Bureau.
SOURCE: CDC/NCHS, National Hospital Ambulatory Medical Care Survey, 2010–2011.
Did ED visit rates for motor vehicle traffic injuries differ by race and ethnicity?
- The overall ED visit rate for motor vehicle traffic injuries was higher among non-Hispanic black persons (260 per 10,000 persons) compared with non-Hispanic white persons (119 per 10,000 persons) and Hispanic persons (104 per 10,000 persons) (Figure 2).
- The visit rate was higher for non-Hispanic black persons compared with Hispanic persons for all age groups. The visit rate was higher for non-Hispanic black persons compared with non-Hispanic white persons for all age groups except 16–24.
- For persons aged 16–24, the visit rate was higher for non-Hispanic white persons compared with Hispanic persons.
Figure 2. Emergency department visit rates for motor vehicle traffic injuries, by age and race and ethnicity: United States, 2010–2011
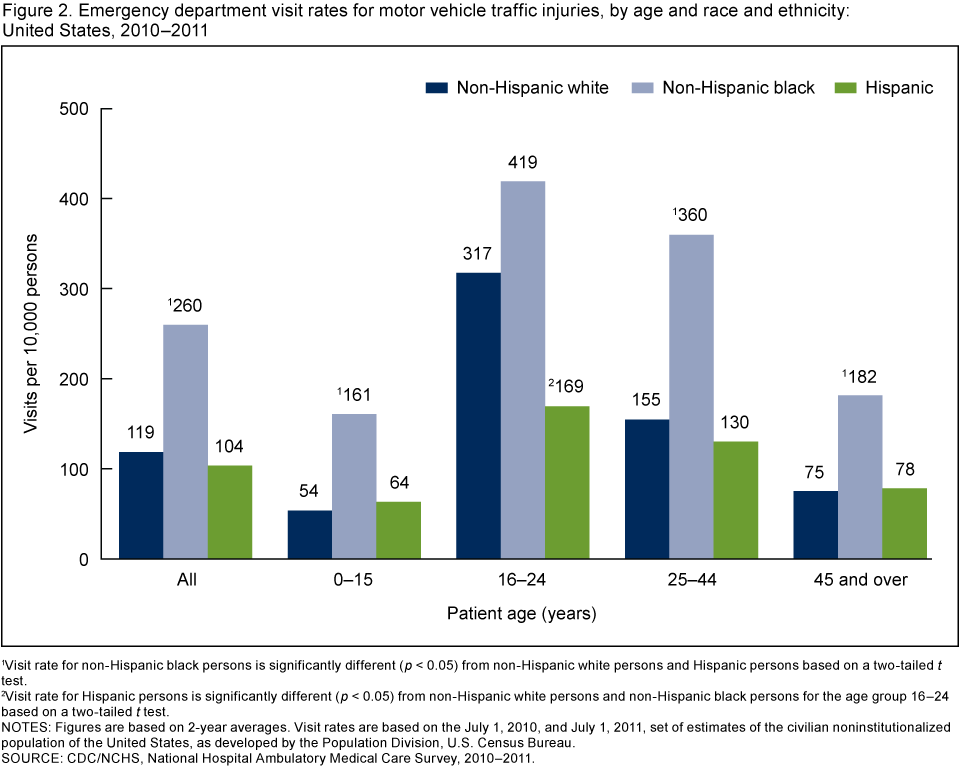
1Visit rate for non-Hispanic black persons is significantly different (p < 0.05) from non-Hispanic white persons and Hispanic persons based on a two-tailed t test.
2Visit rate for Hispanic persons is significantly different (p < 0.05) from non-Hispanic white persons and non-Hispanic black persons for the age group 16–24 based on a two-tailed t test.
NOTES: Figures are based on 2-year averages. Visit rates are based on the July 1, 2010, and July 1, 2011, set of estimates of the civilian noninstitutionalized population of the United States, as developed by the Population Division, U.S. Census Bureau.
SOURCE: CDC/NCHS, National Hospital Ambulatory Medical Care Survey, 2010–2011.
Did arrival by ambulance, triage status, and hospital admission differ for motor vehicle traffic injury ED visits compared with other injury-related ED visits?
- Ambulance was the mode of arrival for 42.9% of ED visits for motor vehicle traffic injuries. This percentage was more than twice as high as for other injury-related ED visits (16.6%) (Figure 3).
- In spite of more frequent arrival by ambulance, the percentage of ED visits for motor vehicle traffic injuries with a triage status of immediate or emergent (11.4%) was only slightly higher than for other injury-related ED visits (8.9%).
- No statistically significant difference was observed in the percentage of ED visits for motor vehicle traffic injuries leading to hospital admission (5.7%) compared with other injury-related ED visits (6.6%).
Figure 3. Percentage of injury-related emergency department visits, by ambulance arrival, triage status, and hospital admission, according to cause of injury: United States, 2010–2011
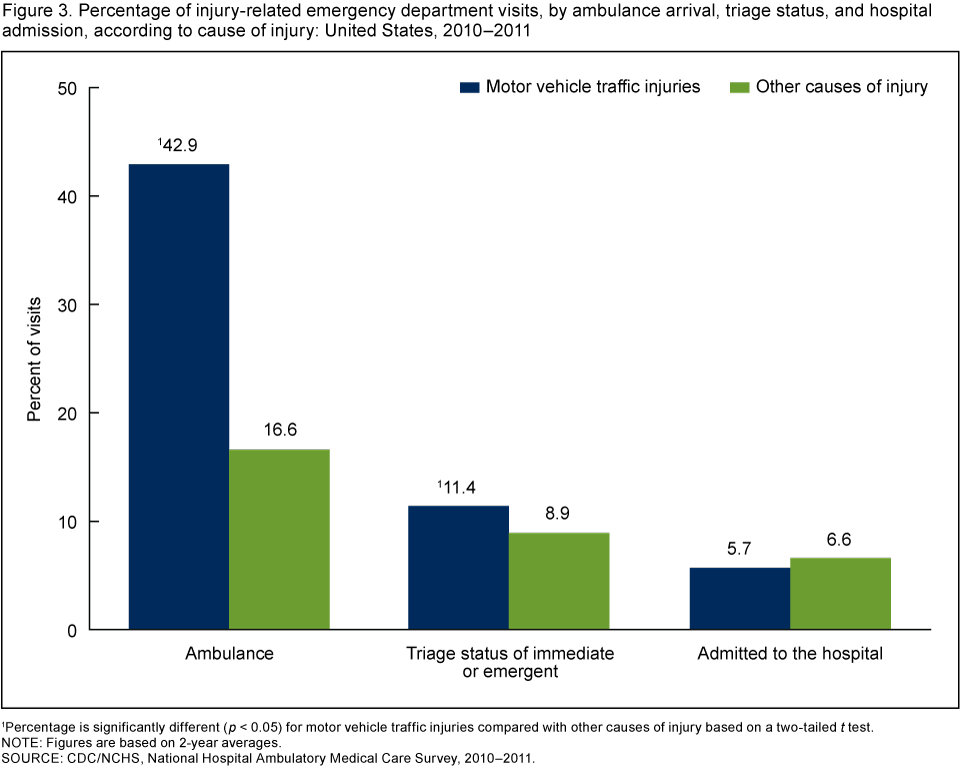
1Percentage is significantly different (p < 0.05) for motor vehicle traffic injuries compared with other causes of injury based on a two-tailed t test.
NOTE: Figures are based on 2-year averages.
SOURCE: CDC/NCHS, National Hospital Ambulatory Medical Care Survey, 2010–2011.
Did the percentage of imaging tests ordered or provided at ED visits for motor vehicle traffic injuries differ from other injury-related ED visits?
- Imaging was ordered or provided at 70.2% of ED visits for motor vehicle traffic injuries, which was higher than for other injury-related ED visits (55.9%) (Figure 4).
- A higher percentage of x-rays, any computerized tomography (CT) scans, head CT scans, CT scans other than head, and other imaging were ordered or provided at ED visits for motor vehicle traffic injuries compared with other injury-related ED visits.
Figure 4. Percentage of injury-related emergency department visits with imaging tests ordered or provided, according to cause of injury: United States, 2010–2011
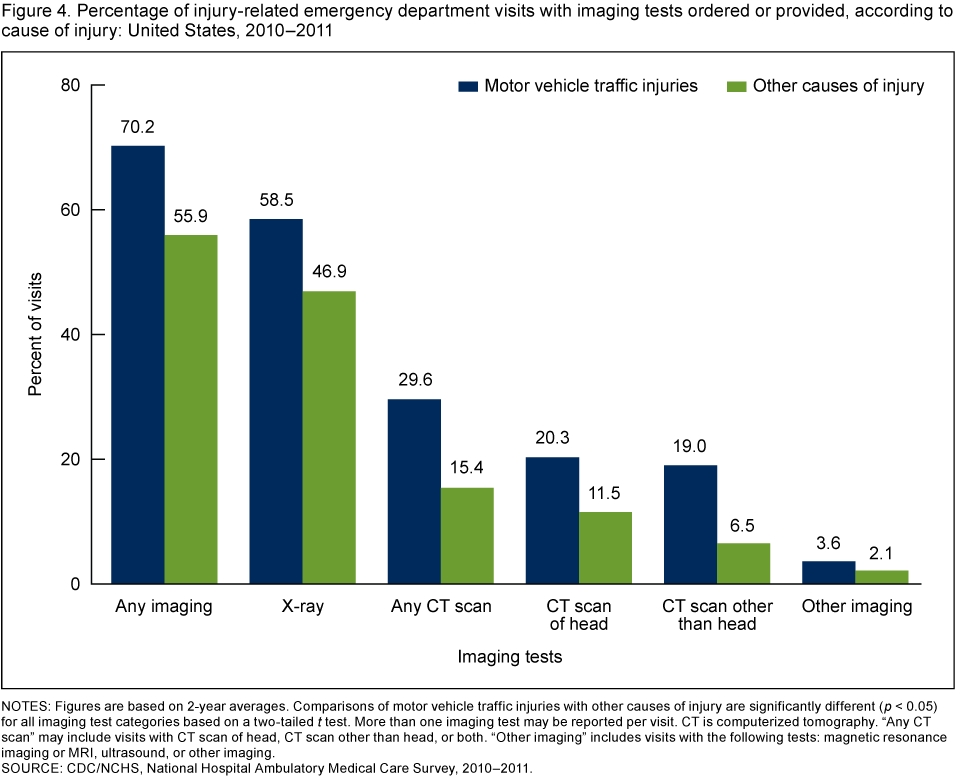
NOTES: Figures are based on 2-year averages. Comparisons of motor vehicle traffic injuries with other causes of injury are significantly different (p < 0.05) for all imaging test categories based on a two-tailed t test. More than one imaging test may be reported per visit. CT is computerized tomography. “Any CT scan” may include visits with CT scan of head, CT scan other than head, or both. “Other imaging” includes visits with the following tests: magnetic resonance imaging or MRI, ultrasound, or other imaging.
SOURCE: CDC/NCHS, National Hospital Ambulatory Medical Care Survey, 2010–2011.
What were the leading primary diagnoses associated with ED visits for motor vehicle traffic injuries? Did these differ from other injury-related ED visits?
- Sprains and strains of the neck and back (23.6%) was the leading primary diagnosis associated with ED visits for motor vehicle traffic injuries, followed by contusion with intact skin surface (15.2%) and then spinal disorders (8.0%) (Figure 5). These diagnoses, along with observation and evaluation for suspected conditions not found (5.4%), were more likely to be made at ED visits for motor vehicle traffic injuries compared with other injury-related ED visits.
- Sprains and strains excluding neck and back (6.5%), fractures (6.1%), and open wounds (3.7%) were also among the leading primary diagnoses, but were less likely to be made at ED visits for motor vehicle traffic injuries compared with other injury-related ED visits.
Figure 5. Percentage of injury-related emergency department visits, by leading primary diagnoses, according to cause of injury: United States, 2010–2011
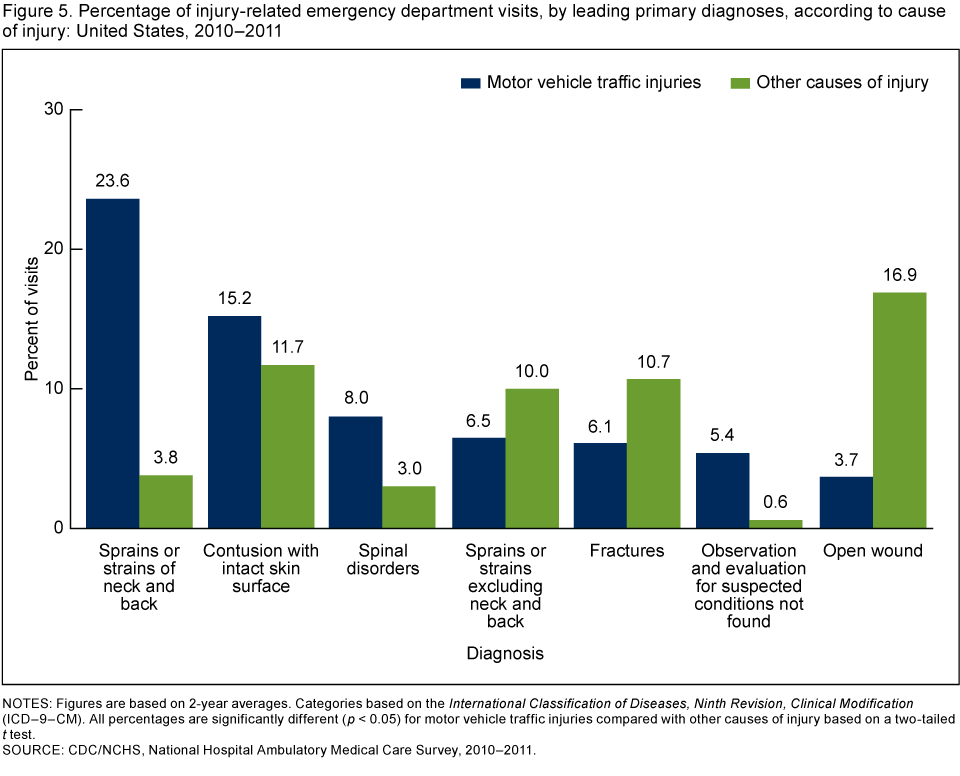
NOTES: Figures are based on 2-year averages. Categories based on the International Classification of Diseases, Ninth Revision, Clinical Modification (ICD–9–CM). All percentages are significantly different (p < 0.05) for motor vehicle traffic injuries compared with other causes of injury based on a two-tailed t test.
SOURCE: CDC/NCHS, National Hospital Ambulatory Medical Care Survey, 2010–2011.
Summary
This analysis of NHAMCS data indicates that in 2010–2011, there were approximately 3.9 million ED visits for motor vehicle traffic injuries annually, which accounted for 10.1% of all injury-related ED visits. Visit rates were highest among those aged 16–24 and then declined with age, with rates for persons aged 0–15 similar to those for persons aged 65 and over. Visit rates were also higher for non-Hispanic black persons compared with non-Hispanic white and Hispanic persons. Although arrival by ambulance occurred more than twice as often for ED visits for motor vehicle traffic injuries than for other injury-related ED visits, the percentage with a triage status of immediate or emergent was only slightly higher, and there was no difference in the percentage admitted to the hospital. Imaging was more frequently ordered or provided at ED visits for motor vehicle traffic injuries compared with other injury-related ED visits. Finally, sprains and strains of the neck and back, contusion with intact skin surface, and spinal disorders accounted for about one-half of all ED visits for motor vehicle traffic injuries.
Injury prevention objectives were recently outlined for Healthy People 2020, and these include reducing motor vehicle crash-related deaths and nonfatal motor vehicle crash-related injuries (5). Data on the rates and characteristics of ED visits for motor vehicle traffic injuries can help inform public health efforts aimed at meeting these objectives and continuing the progress made in improving motor vehicle safety.
Definitions
Injury-related visit: A visit in which a first-, second-, or third-listed external cause of injury, or first-, second-, or third-listed reason for visit or diagnosis code that is injury- or poison-related was recorded. Adverse effect and medical and surgical misadventure or complication external cause-of-injury codes were excluded; however, if these codes were present in combination with other valid definitional codes, the visit was considered injury-related. Diagnosis and external cause of injury were coded using the International Classification of Diseases, Ninth Revision, Clinical Modification (ICD–9–CM) (6).
Visit for motor vehicle traffic injury: An injury-related visit with a first-listed external cause-of-injury code of 810–819 from the ICD–9–CM (6). Specifically, these codes are:
- E810—Motor vehicle traffic accident involving collision with train
- E811—Motor vehicle traffic accident involving re-entrant collision with another motor vehicle
- E812—Other motor vehicle traffic accident involving collision with motor vehicle
- E813—Motor vehicle traffic accident involving collision with other vehicle
- E814—Motor vehicle traffic accident involving collision with pedestrian
- E815—Other motor vehicle traffic accident involving collision on the highway
- E816—Motor vehicle traffic accident due to loss of control, without collision on the highway
- E817—Noncollision motor vehicle traffic accident while boarding or alighting
- E818—Other noncollision motor vehicle traffic accident
- E819—Motor vehicle traffic accident of unspecified nature
Data source and methods
Data are from the 2010–2011 NHAMCS, an annual nationally representative survey of nonfederal, general, and short-stay hospitals that is conducted by the Centers for Disease Control and Prevention’s (CDC) National Center for Health Statistics. NHAMCS uses a multistage probability design with samples of primary sampling units (PSUs), hospitals within PSUs, and patient visits within EDs. Each year, approximately 480 hospitals are selected for inclusion in NHAMCS. Data were collected on approximately 35,000 ED visits in 2010 and 31,000 visits in 2011. Additional information on the methodology of NHAMCS is available online (7).
Data were imputed for patient birth year, race, ethnicity, and triage level (7). For the ED component of NHAMCS, race data were missing for 10.5% of visits in 2010 and 12.9% of visits in 2011; ethnicity data were missing for 12.8% of visits in 2010 and 16.2% of visits in 2011; and triage data were missing for 20.4% of visits in 2010 and 19.6% of visits in 2011. Race and ethnicity data were combined in Figure 2 to form the categories of Hispanic, non-Hispanic white, and non-Hispanic black; visits by other racial and ethnic groups are not shown in this figure. The primary diagnosis groups shown in Figure 5 correspond to the following ICD–9–CM codes:
- 720–724—Spinal disorders
- 800–829—Fractures
- 840–845 and 848—Sprains and strains excluding neck and back
- 846–847—Sprains and strains of neck and back
- 870–897—Open wound
- 920–924—Contusion with intact skin surface
- V71—Observation and evaluation for suspected conditions not found
Data analyses were performed using the statistical packages SAS, version 9.3 (SAS Institute, Cary, N.C.) and SAS-callable SUDAAN, version 11.0 (RTI International, Research Triangle Park, N.C.). Differences among subgroups were evaluated using a two-tailed t test (p < 0.05).
About the authors
Michael Albert and Linda F. McCaig are with CDC’s National Center for Health Statistics, Division of Health Care Statistics.
References
- CDC. Ten significant public health achievements—United States, 2001–2010: Motor vehicle safety.
- CDC. Injury prevention & control: Motor vehicle safety.
- CDC. FastStats: Accidents or unintentional injuries.
- Naumann RB, Dellinger AM, Zaloshnja E, Lawrence BA, Miller TR. Incidence and total lifetime costs of motor vehicle-related fatal and nonfatal injury by road user type, United States, 2005. Traffic Inj Prev 11(4):353–60. 2010.
- U.S. Department of Health and Human Services, Office of Disease Prevention and Health Promotion. Healthy People 2020 topics and objectives: Injury and violence preventionexternal icon. Washington, DC.
- Centers for Medicare & Medicaid Services. International classification of diseases, ninth revision, clinical modification, 6th ed. DHHS Pub No. (PHS) 06–1260. 2006.
- NCHS. 2010 NHAMCS micro-data file documentationpdf icon. 2010.
Suggested citation
Albert M, McCaig LF. Emergency department visits for motor vehicle traffic injuries: United States, 2010–2011. NCHS data brief, no 185. Hyattsville, MD: National Center for Health Statistics. 2015.
Copyright information
All material appearing in this report is in the public domain and may be reproduced or copied without permission; citation as to source, however, is appreciated.
National Center for Health Statistics
Charles J. Rothwell, M.S., M.B.A., Director
Jennifer H. Madans, Ph.D., Associate Director for Science
Division of Health Care Statistics
Clarice Brown., M.S., Director